

The DOI matches its Crossref record; 60 of the 60 references it cites were found in a registry or an index.
Anti-inflammatory/anti-amyloidogenic effects of plasmalogens in lipopolysaccharide-induced neuroinflammation in adult mice
Open accessAbstract
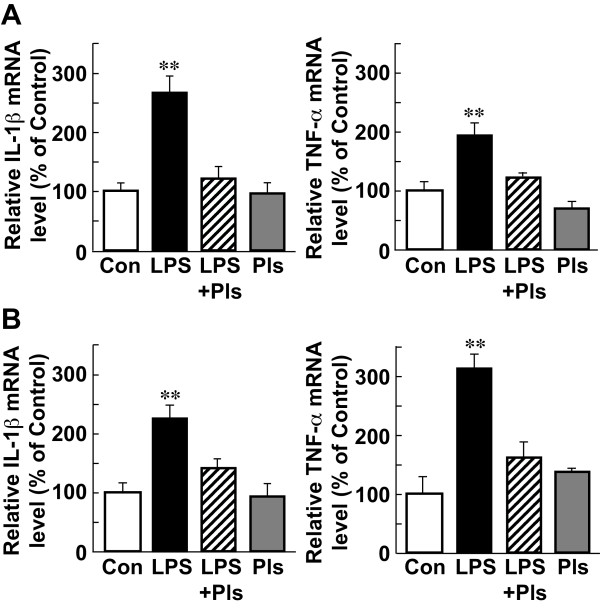
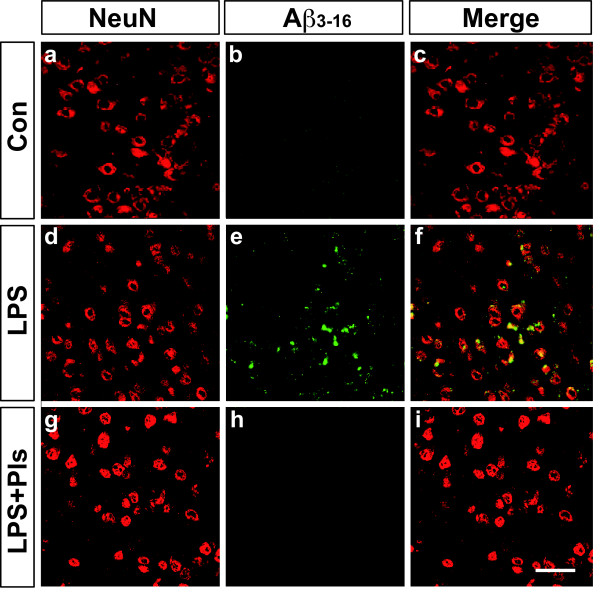
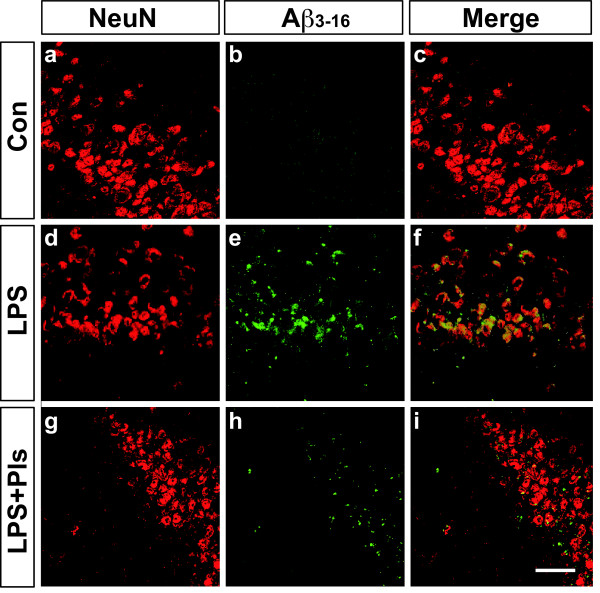
BACKGROUND: Neuroinflammation involves the activation of glial cells in neurodegenerative diseases such as Alzheimer's disease (AD). Plasmalogens (Pls) are glycerophospholipids constituting cellular membranes and play significant roles in membrane fluidity and cellular processes such as vesicular fusion and signal transduction. METHODS: In this study the preventive effects of Pls on systemic lipopolysaccharide (LPS)-induced neuroinflammation were investigated using immunohistochemistry, real-time PCR methods and analysis of brain glycerophospholipid levels in adult mice. RESULTS: Intraperitoneal (i.p.) injections of LPS (250 μg/kg) for seven days resulted in increases in the number of Iba-1-positive microglia and glial fibrillary acidic protein (GFAP)-positive astrocytes in the prefrontal cortex (PFC) and hippocampus accompanied by the enhanced expression of IL-1β and TNF-α mRNAs. In addition, β-amyloid (Aβ3-16)-positive neurons appeared in the PFC and hippocampus of LPS-injected animals. The co-administration of Pls (i.p., 20 mg/kg) after daily LPS injections significantly attenuated both the activation of glial cells and the accumulation of Aβ proteins. Finally, the amount of Pls in the PFC and hippocampus decreased following the LPS injections and this reduction was suppressed by co-treatment with Pls. CONCLUSIONS: These findings suggest that Pls have anti-neuroinflammatory and anti-amyloidogenic effects, thereby indicating the preventive or therapeutic application of Pls against AD.
Overview
The claims and statistics of this paper haven’t been checked yet.
Run the check — free, no account needed. It reads the open-access text and checks the sources it cites.
Integrity signals
Registry
Cites
Statistics
Figures
Verification
Claims the paper makes
The claims and statistics of this paper haven’t been checked yet.
Run the check — free, no account needed. It reads the open-access text and checks the sources it cites.
Claims other papers make about this one
Each is checked against this paper’s own text: does it say what the citing paper says it does?
The check wasn’t confident either way, so it gives no verdict — never disputed.
In the citing paper
“Not only has chronic neuroinflammation been shown to increase α-synuclein deposition in various synucleinopathy animal models (51–56), but when these animals were treated with drugs to reduce neuroinflammation, α-synuclein neuropathology also decreased (57, 58).”
From LRRK2 mediates microglial neurotoxicity via NFATc2 in rodent models of synucleinopathies (2020) · cites this paper as [54]
Experimental — accuracy not yet measuredIn the citing paper
“This concept is also supported by the finding that plasmalogens suppress microglia activation after systemic injection of lipopolysaccharides (LPS) in mice [221,222].”
From Peroxisomes in brain development and function (2016) · cites this paper as [221]
Self-check
Percentages, sums and reported differences re-computed from the paper’s own numbers.
The self-check needs the paper’s full text.
Citations
Cites
A SIMPLE METHOD FOR THE ISOLATION AND PURIFICATION OF TOTAL LIPIDES FROM ANIMAL TISSUES
Folch, J., Lees, M., & Stanley, G. H. S. (1957) · Journal of Biological Chemistry · doi:10.1016/s0021-9258(18)64849-5 · Cited by 65,189
Querfurth, H. W., & LaFerla, F. M. (2010) · New England Journal of Medicine · doi:10.1056/nejmra0909142 · Cited by 4,569
The Opposing Effects of N-3 and n-6 Fatty Acids
Schmitz, G., & Ecker, J. (2008) · Progress in Lipid Research · doi:10.1016/j.plipres.2007.12.004 · Cited by 1,245
Deciphering the Molecular Basis of Memory Failure in Alzheimer's Disease
Walsh, D. M., & Selkoe, D. J. (2004) · Neuron · doi:10.1016/j.neuron.2004.09.010 · Cited by 1,207
Cholesterol depletion inhibits the generation of β-amyloid in hippocampal neurons
Simons, M., Keller, P., Strooper, B. D., Beyreuther, K. T., Dotti, C. G., & Simons, K. (1998) · Proceedings of the National Academy of Sciences · doi:10.1073/pnas.95.11.6460 · Cited by 1,177
Oxidative stress and Alzheimer disease
Christen, Y. (2000) · American Journal of Clinical Nutrition · doi:10.1093/ajcn/71.2.621s · Cited by 1,176
Butterfield, D. A., & Lauderback, C. M. (2002) · Free Radical Biology and Medicine · doi:10.1016/s0891-5849(02)00794-3 · Cited by 1,013
Low cholesterol stimulates the nonamyloidogenic pathway by its effect on the α-secretase ADAM 10
Kojro, E., Gimpl, G., Lammich, S., März, W., & Fahrenholz, F. (2001) · Proceedings of the National Academy of Sciences · doi:10.1073/pnas.081612998 · Cited by 804
Lee, J. W., Lee, Y. K., Yuk, D. Y., Choi, D. Y., Ban, S. B., Oh, K. W., & Hong, J. T. (2008) · Journal of Neuroinflammation · doi:10.1186/1742-2094-5-37 · Cited by 772
Docosahexaenoic acid protects from dendritic pathology in an Alzheimer's disease mouse model
Calon, F., Lim, G. P., Yang, F., Morihara, T., Teter, B., Ubeda, O., Rostaing, P., Triller, A., Salem, N., Ashe, K. H., et al. (2004) · Neuron · doi:10.1016/j.neuron.2004.08.013 · Cited by 707
Cited by
Sorted by citations
Items 101–130 of 130
Tan, H.-L., Liang, D., Lu, N., Zhang, J., Zhang, S., & Tan, G.-J. (2024) · Aging · doi:10.18632/aging.205830 · Cited by 7
Sugimoto, K., Hosomi, R., Yoshida, M., & Fukunaga, K. (2020) · Food Science & Nutrition · doi:10.1002/fsn3.1967 · Cited by 6
Nanodelivery vehicles induce remote biochemical changes in vivo
Sikora, K. N., Castellanos-García, L. J., Hardie, J. M., Liu, Y., Farkas, M. E., Rotello, V. M., & Vachet, R. W. (2021) · Nanoscale · doi:10.1039/d1nr02563e · Cited by 6
Modulation of endogenous plasmalogens by genetic ablation of lysoplasmalogenase (Tmem86b) in mice
Paul, S., Morgan, P. K., Pernes, G., Schooneveldt, Y. L., Duong, T., Mellett, N. A., Huynh, K., Murphy, A. J., Lancaster, G. I., & Meikle, P. J. (2025) · Journal of Lipid Research · doi:10.1016/j.jlr.2025.100808 · Cited by 5
KIT-13, a novel plasmalogen derivative, attenuates neuroinflammation and amplifies cognition
Hossain, M. S., Mawatari, S., Honsho, M., Okauchi, T., & Fujino, T. (2024) · Frontiers in Cell and Developmental Biology · doi:10.3389/fcell.2024.1443536 · Cited by 5
Lauer, A. A., Griebsch, L. V., Pilz, S. M., Janitschke, D., Theiss, E. L., Reichrath, J., Herr, C., Beißwenger, C., Bals, R., Valencak, T. G., et al. (2021) · Biomolecules · doi:10.3390/biom11111699 · Cited by 5
The Plasmalogen composition of post laying-eggs hen and the production method for edible use
MIAKE, K., Yunoki, K., KAWAMURA, J., Fuchu, H., Sugiyama, M., & Ohnishi, M. (2014) · Nihon Chikusan Gakkaiho · doi:10.2508/chikusan.85.153 · Cited by 5
Abdou, H. M., Hamaad, F. A., Elmageed, G. M. A., Katano, H., & Ghoneum, M. H. (2025) · Oxidative Medicine and Cellular Longevity · doi:10.1155/omcl/3673280 · Cited by 4
Myers, S., McCracken, K., Buck, D. J., Curtis, J. T., & Davis, R. L. (2022) · Inflammopharmacology · doi:10.1007/s10787-022-01113-9 · Cited by 4
Hayashi, M., Kudo, M., & Gao, M. (2022) · Journal of Nutritional Science and Vitaminology · doi:10.3177/jnsv.68.140 · Cited by 4
Wu, Y., Angelov, B., Deng, Y., Fujino, T., Hossain, M. S., Bizien, T., & Angelova, A. (2024) · Advanced Therapeutics · doi:10.1002/adtp.202400093 · Cited by 3
Paul, S., Lancaster, G. I., & Meikle, P. J. (2019) · Progress in Lipid Research · doi:10.1016/j.plipres.2019.100993 · Cited by 3
Phospholipid analyses of rabbit ocular surface tissues
Greiner, J. V., & Glonek, T. (2024) · Experimental Eye Research · doi:10.1016/j.exer.2024.109911 · Cited by 2
Matuszewska, M., Cieślik, M., Sulejczak, D., Wilkaniec, A., & Czapski, G. A. (2026) · Brain Research · doi:10.1016/j.brainres.2026.150318 · Cited by 2
Liu, Y., Li, P., Liu, Y., Jiang, T., Xu, J., & Xue, C. (2022) · Food Bioscience · doi:10.1016/j.fbio.2022.102169 · Cited by 2
Expressional prerequisites for targeted drug delivery to the pathological brain
Helgudóttir, S. S. (2021) · VBN Forskningsportal (Aalborg Universitet) · doi:10.54337/aau424058297 · Cited by 1
Shimshek, D. R., Zurbruegg, S., Neuhaus, A., Schubart, A., Gasparini, F., & Beckmann, N. (2025) · BMC Medical Imaging · doi:10.1186/s12880-025-01962-0 · Cited by 2
Irimajiri, R., Kuwabara, M., Ishibashi, Y., Ano, S., 藤野, 泰., Honsho, M., Fukami, K., Mawatari, S., Fujino, T., & Doi, K. (2025) · Applied and Environmental Microbiology · doi:10.1128/aem.00940-25 · Cited by 1
Yamada, S., Shirai, M., Katsumata, M., Kurono, M., Matahira, Y., Ono, K., & Kageyama, S. (2024) · Journal of Oleo Science · doi:10.5650/jos.ess24128 · Cited by 2
Roles of Brain Lipids in Glial Activation
Hossain, M. S., & Katafuchi, T. (2016) · Advances in Neuroimmune Biology · doi:10.3233/nib-160120
Huynh, K., Lim, W. L. F., Giles, C., Jayawardana, K. S., Salim, A., Mellett, N. A., Smith, A., Olshansky, G., Drew, B. G., Chatterjee, P., et al. (2020) · medRxiv · doi:10.1101/2020.05.26.20114215
The potential of extracellular vesicle lipid profiling in Alzheimer's disease.Preprint
Su, H., Masters, C. L., Bush, A. I., Barnham, K. J., Reid, G. E., & Vella, L. J. (2023) · doi:10.22541/au.168388562.25020996/v1
Identification of characteristic lipids of Tan lamb and their potential health benefits
Xu, L., Li, S., Chen, P., Gu, M., Yang, Q., Chen, L., & Zhang, D. (2025) · Food Research International · doi:10.1016/j.foodres.2025.116860
Inoue, R., & Sakamoto, K. (2025) · Food and Nutrition Sciences · doi:10.4236/fns.2025.166040
MY FRIEND DR. H. KORNEVA AND RUSSIA
Katafuchi, T. (2014) · Medical academic journal · doi:10.17816/maj14438-40
ApoE in Lipidomic Signature of Alzheimer’s Disease
Wartchow, K. M., Souza, D. O., & McIntire, L. B. (2026) · Springer eBooks · doi:10.1007/978-3-031-52641-1_65-1
Xu, Z., & Deng, Y. (2026) · Elsevier eBooks · doi:10.1016/b978-0-443-27340-7.00012-7
ApoE in Lipidomic Signature of Alzheimer’s Disease
Wartchow, K. M., Souza, D. O., & McIntire, L. B. (2026) · Springer eBooks · doi:10.1007/978-3-031-96089-5_65
Fukuchi, M., Tanaka, M., Nagata, M., Takara, T., & Sasuga, Y. (2026) · Frontiers in Nutrition · doi:10.3389/fnut.2026.1906996
Peng, J., Zeng, Y., Luo, Y., Xu, G., Xiao, Z., Gu, X., Lin, Z., Wang, Q., Yang, W., & Li, J. (2026) · Molecular Nutrition & Food Research · doi:10.1002/mnfr.70567
Metadata
- Authors
- Ifuku, M., Katafuchi, T., Mawatari, S., Noda, M., Miake, K., Sugiyama, M., & Fujino, T.
- Affiliations
- Kyushu University (JP)
- Institute of Rheological Functions of Food (JP)
- Marudai FOOD Co., Ltd. (Japan) (JP)
- Corresponding author
- Katafuchi, Toshihiko
- Venue
- Journal of Neuroinflammation
- Published
- 2012-08-13
- Volume
- 9
- Issue
- 1
- Pages
- 197-197
- ISSN
- 1742-2094 (ISSN-L)
- PMC
- PMC3444880
- OpenAlex
- W2037650763
- Cited by
- 130
- References
- 60
- Citations by year
- 2026: 7 · 2025: 8 · 2024: 13 · 2023: 8 · 2022: 12 · 2021: 15 · 2020: 11 · 2019: 13 · 2018: 12 · 2017: 9 · 2016: 6 · 2015: 6 · 2014: 5 · 2013: 5
- FWCI
- 2.57
- Type
- journal article
- Language
- en
- Open access
- gold
- doi.org
- Locations
- Journal of Neuroinflammation (publishedVersion, cc-by)
- PubMed Central (publishedVersion, cc-by)
- PubMed (publishedVersion)
- DOAJ (DOAJ: Directory of Open Access Journals) (submittedVersion)
- Funders
- Ministry of Education, Culture, Sports, Science and Technology
- Japan Society for the Promotion of Science (22590084, 22590225)
- Topics
- Life Sciences › Neuroscience › Neurology › Neuroinflammation and Neurodegeneration Mechanisms
- Life Sciences › Neuroscience › Cellular and Molecular Neuroscience › Alzheimer's disease research and treatments
- Health Sciences › Nursing › Nutrition and Dietetics › Fatty Acid Research and Health
- Keywords
- plasmalogens, neuroinflammation, lipopolysaccharide, Alzheimer's disease, amyloid-beta, microglial activation, astrocytes, glycerophospholipids, prefrontal cortex, hippocampus, IL-1β, TNF-α, anti-inflammatory activity
- MeSH terms
- Animals, Anti-Inflammatory Agents, Brain Edema, Chickens, Inflammation, Lipopolysaccharides, Male, Mice, Inbred C57BL, Plasmalogens, Amyloid beta-Peptides, Glycerophospholipids, Mice
About these checks
Registry, retraction, Cites and statistics results are computed, not judged, with one exception: a printed reference that no index lists is read once by a model before it counts as a citation error. Claims are extracted by a model and kept only when their quote appears verbatim in the text; each cited source is then checked, with a model’s help, for whether it says what the claim relies on. Those verdicts can be wrong — read the claim’s quote and the cited source before relying on one.
Statistics and arithmetic are recomputed, not judged.
Confidence bands are shown only for fields calibrated on our annotated test set. None is calibrated yet, so no band is shown.
What counts as a claim ›How we measure confidence ›How we check this ›
Are you an author, or do you see a problem with this page? Request a review
