

The DOI matches its Crossref record; 39 of the 40 references it cites were found in a registry or an index.
A ketogenic diet reduces amyloid beta 40 and 42 in a mouse model of Alzheimer's disease
Open accessAbstract
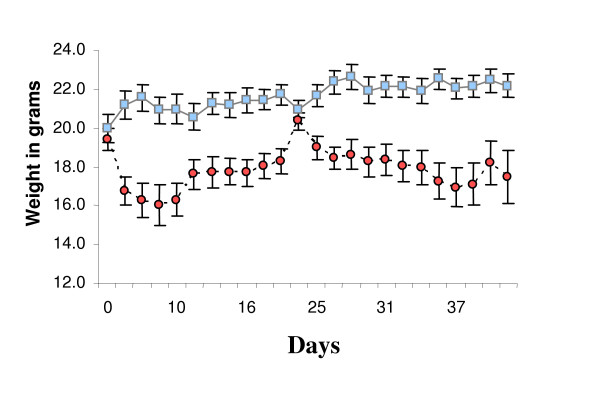
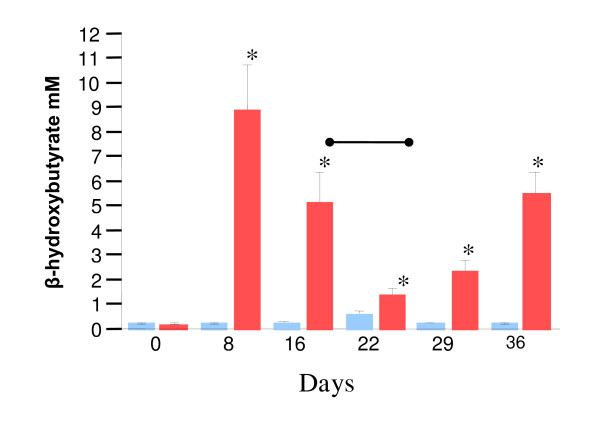
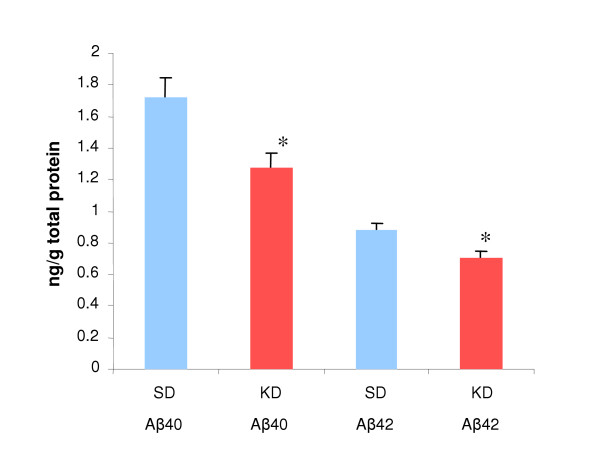
Background: Alzheimer's disease (AD) is a progressive neurodegenerative disorder that primarily strikes the elderly. Studies in both humans and animal models have linked the consumption of cholesterol and saturated fats with amyloid-β (Aβ) deposition and development of AD. Yet, these studies did not examine high fat diets in combination with reduced carbohydrate intake. Here we tested the effect of a high saturated fat/low carbohydrate diet on a transgenic mouse model of AD. Results: Starting at three months of age, two groups of female transgenic mice carrying the "London" APP mutation (APP/V717I) were fed either, a standard diet (SD) composed of high carbohydrate/low fat chow, or a ketogenic diet (KD) composed of very low carbohydrate/high saturated fat chow for 43 days. Animals fed the KD exhibited greatly elevated serum ketone body levels, as measured by β-hydroxybutyrate (3.85 ± 2.6 mM), compared to SD fed animals (0.29 ± 0.06 mM). In addition, animals fed the KD lost body weight (SD 22.2 ± 0.6 g vs. KD 17.5 ± 1.4 g, p = 0.0067). In contrast to earlier studies, the brief KD feeding regime significantly reduced total brain Aβ levels by approximately 25%. Despite changes in ketone levels, body weight, and Aβ levels, the KD diet did not alter behavioral measures. Conclusion: Previous studies have suggested that diets rich in cholesterol and saturated fats increased the deposition of Aβ and the risk of developing AD. Here we demonstrate that a diet rich in saturated fats and low in carbohydrates can actually reduce levels of Aβ. Therefore, dietary strategies aimed at reducing Aβ levels should take into account interactions of dietary components and the metabolic outcomes, in particular, levels of carbohydrates, total calories, and presence of ketone bodies should be considered.
Overview
The claims and statistics of this paper haven’t been checked yet.
Run the check — free, no account needed. It reads the open-access text and checks the sources it cites.
Integrity signals
Registry
Cites
Statistics
Figures
Verification
Claims the paper makes
The claims and statistics of this paper haven’t been checked yet.
Run the check — free, no account needed. It reads the open-access text and checks the sources it cites.
Claims other papers make about this one
Each is checked against this paper’s own text: does it say what the citing paper says it does?
In the citing paper
“Several clinical studies have shown a positive effect of a ketogenic diet on patients with AD or mild cognitive impairment (MCI), consistent with preclinical results [87–91] (Table 1).”
From Role of diet and its effects on the gut microbiome in the pathophysiology of mental disorders (2022) · cites this paper as [89]
Self-check
Percentages, sums and reported differences re-computed from the paper’s own numbers.
The self-check needs the paper’s full text.
Citations
Cites
Alzheimer's Disease: Genes, Proteins, and Therapy
Selkoe, D. J. (2001) · Physiological Reviews · doi:10.1152/physrev.2001.81.2.741 · Cited by 6,063
Alzheimer Disease in the US Population: Prevalence Estimates Using the 2000 Census
Hebert, L. E., Scherr, P. A., Bienias, J. L., Bennett, D. A., & Evans, D. A. (2003) · Archives of Neurology · doi:10.1001/archneur.60.8.1119 · Cited by 2,168
Evans, D. A. (1989) · JAMA · doi:10.1001/jama.262.18.2551 · Cited by 1,627
Evans, D. A. (1989) · JAMA · doi:10.1001/jama.1989.03430180093036 · Cited by 1,226 · cited 1×
“Background Alzheimer's disease (AD) is an age-associated neurodegenerative disease that is very common in the US, affecting up to 50% of people between the ages of 75 to 84 years [1].”
BackgroundAxonopathy and Transport Deficits Early in the Pathogenesis of Alzheimer’s Disease
Stokin, G. B., Lillo, C., Falzone, T. L., Brusch, R. G., Rockenstein, E., Mount, S. L., Raman, R., Davies, P., Masliah, E., Williams, D. S., et al. (2005) · Science · doi:10.1126/science.1105681 · Cited by 1,214
Calorie restriction, SIRT1 and metabolism: understanding longevity
Bordone, L., & Guarente, L. (2005) · Nature Reviews Molecular Cell Biology · doi:10.1038/nrm1616 · Cited by 1,038
Dietary fat intake and the risk of incident dementia in the Rotterdam study
Kalmijn, S., Launer, L. J., Ott, A., Witteman, J. C. M., Hofman, A., & Breteler, M. M. B. (1997) · Annals of Neurology · doi:10.1002/ana.410420514 · Cited by 895 · cited 2×
“The results from this analysis led the author to suggest that diets rich in saturated fats and cholesterol increased the risk of several types of dementia [5].”
BackgroundResultHypercholesterolemia Accelerates the Alzheimer's Amyloid Pathology in a Transgenic Mouse Model
Refolo, L. M., Pappolla, M. A., Malester, B., LaFrancois, J., Bryant-Thomas, T., Wang, R., Tint, G. S., Sambamurti, K., & Duff, K. (2000) · Neurobiology of Disease · doi:10.1006/nbdi.2000.0304 · Cited by 783
Moechars, D., Dewachter, I., Lorent, K., Reversé, D., Baekelandt, V., Naidu, A., Tesseur, I., Spittaels, K., Haute, C. V. D., Checler, F., et al. (1999) · Journal of Biological Chemistry · doi:10.1074/jbc.274.10.6483 · Cited by 668
Apolipoprotein E (APOE) allele distribution in the world. Is APOE*4 a ‘thrifty’ allele?
Corbo, R. M., & Scacchi, R. (1999) · Annals of Human Genetics · doi:10.1046/j.1469-1809.1999.6340301.x · Cited by 653
Cited by
Sorted by citations
Blennow, K., de Leon, M. J., & Zetterberg, H. (2006) · The Lancet · doi:10.1016/s0140-6736(06)69113-7 · Cited by 3,134
Beyond weight loss: a review of the therapeutic uses of very-low-carbohydrate (ketogenic) diets
Paoli, A., Rubini, A., Volek, J. S., & Grimaldi, K. A. (2013) · European Journal of Clinical Nutrition · doi:10.1038/ejcn.2013.116 · Cited by 885
Nagpal, R., Neth, B. J., Wang, S., Craft, S., & Yadav, H. (2019) · EBioMedicine · doi:10.1016/j.ebiom.2019.08.032 · Cited by 653
Brain fuel metabolism, aging, and Alzheimer’s disease
Cunnane, S. C., Nugent, S., Roy, M., Courchesne‐Loyer, A., Croteau, É., Tremblay, S., Castellano, A., Pifferi, F., Bocti, C., Paquet, N., et al. (2010) · Nutrition · doi:10.1016/j.nut.2010.07.021 · Cited by 633
The neuroprotective properties of calorie restriction, the ketogenic diet, and ketone bodies
Maalouf, M., Rho, J. M., & Mattson, M. P. (2008) · Brain Research Reviews · doi:10.1016/j.brainresrev.2008.09.002 · Cited by 584
Metadata
- Authors
- Van der Auwera, I., Wera, S., Van Leuven, F., & Henderson, S. T.
- Affiliations
- KU Leuven (BE)
- Corresponding author
- Henderson, Samuel T
- Venue
- Nutrition & Metabolism
- Published
- 2005-10-17
- Volume
- 2
- Issue
- 1
- Pages
- 28-28
- ISSN
- 1743-7075 (ISSN-L)
- PMC
- PMC1282589
- OpenAlex
- W2109680432
- Cited by
- 307
- References
- 40
- Citations by year
- 2026: 8 · 2025: 12 · 2024: 12 · 2023: 22 · 2022: 36 · 2021: 23 · 2020: 36 · 2019: 24 · 2018: 15 · 2017: 15 · 2016: 12 · 2015: 12 · 2014: 15 · 2013: 11 · 2012: 13
- FWCI
- 3.61
- Type
- journal article
- Language
- en
- Open access
- gold
- doi.org
- Licence
- cc-by
- Locations
- Nutrition & Metabolism (publishedVersion, cc-by)
- PubMed Central (publishedVersion, cc-by)
- PubMed (publishedVersion)
- DOAJ (DOAJ: Directory of Open Access Journals) (submittedVersion)
- Topics
- Health Sciences › Medicine › Physiology (medical) › Diet and metabolism studies
- Life Sciences › Neuroscience › Cellular and Molecular Neuroscience › Alzheimer's disease research and treatments
- Health Sciences › Medicine › Physiology (medical) › Dietary Effects on Health
- Keywords
- ketogenic diet, Alzheimer's disease, amyloid-beta, Aβ40, amyloid-beta 42, high saturated fat diet, low-carbohydrate diet, ketone bodies, beta-hydroxybutyrate, dietary intervention, cholesterol, weight loss
About these checks
Registry, retraction, Cites and statistics results are computed, not judged, with one exception: a printed reference that no index lists is read once by a model before it counts as a citation error. Claims are extracted by a model and kept only when their quote appears verbatim in the text; each cited source is then checked, with a model’s help, for whether it says what the claim relies on. Those verdicts can be wrong — read the claim’s quote and the cited source before relying on one.
Statistics and arithmetic are recomputed, not judged.
Confidence bands are shown only for fields calibrated on our annotated test set. None is calibrated yet, so no band is shown.
What counts as a claim ›How we measure confidence ›How we check this ›
Are you an author, or do you see a problem with this page? Request a review
