

The DOI matches its Crossref record; 31 of the 31 references it cites were found in a registry or an index.
Sample size requirements to estimate key design parameters from external pilot randomised controlled trials: a simulation study
Open accessAbstract
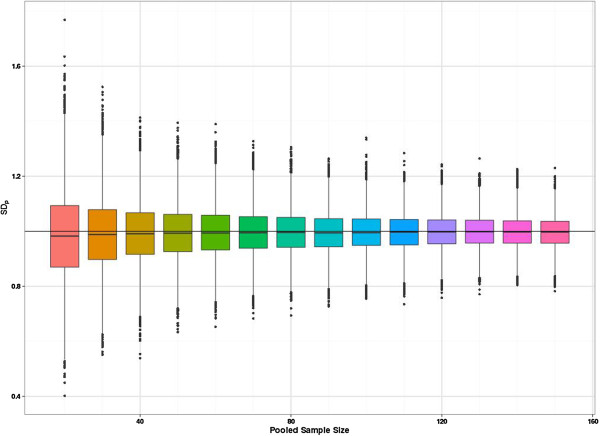
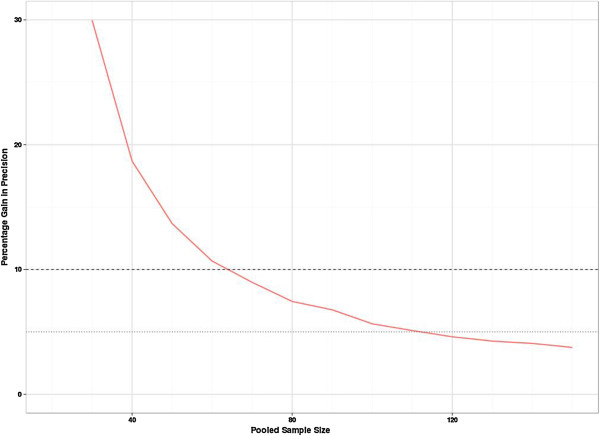
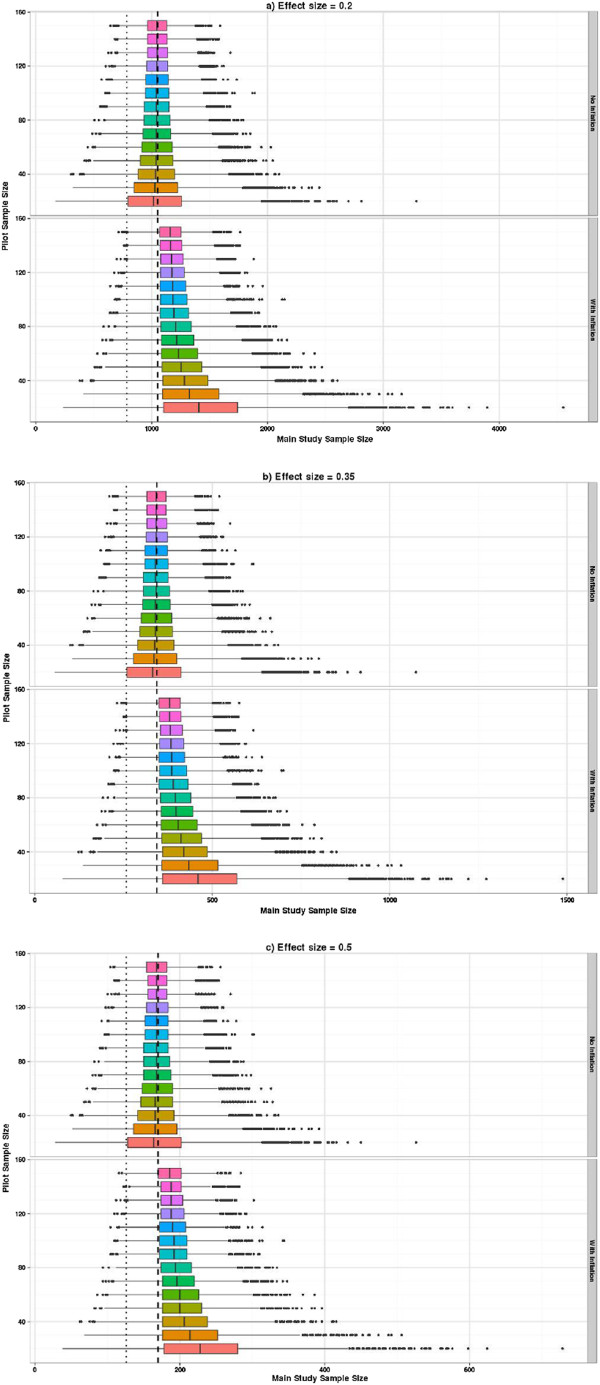
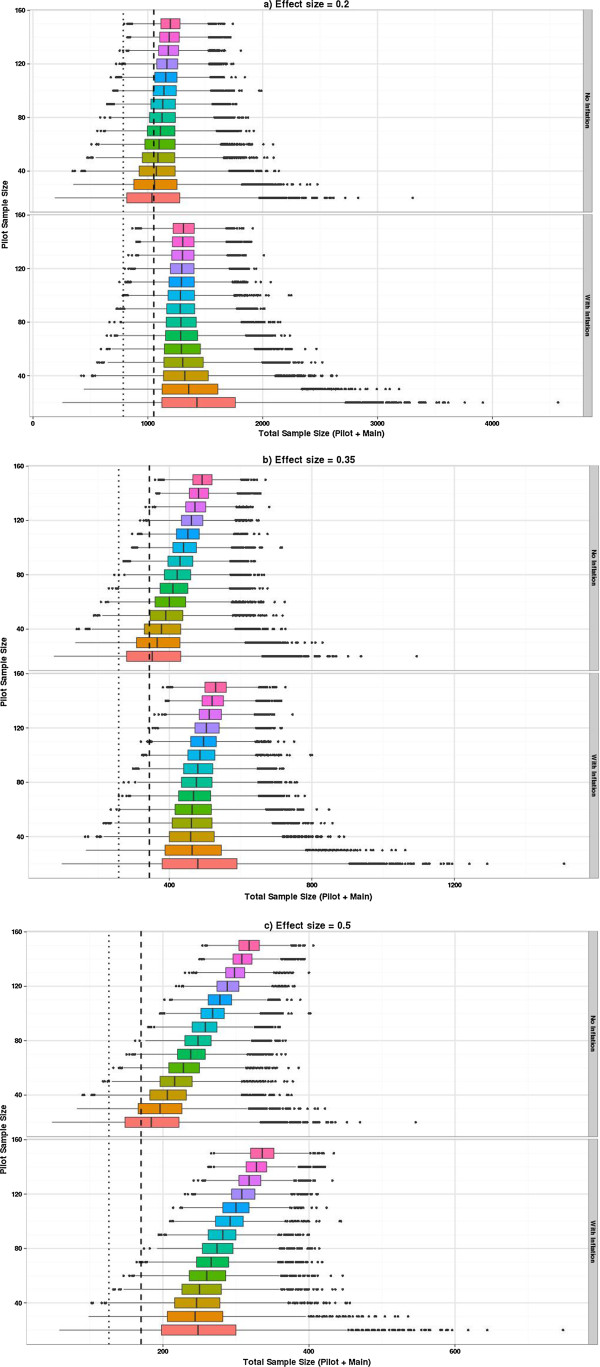
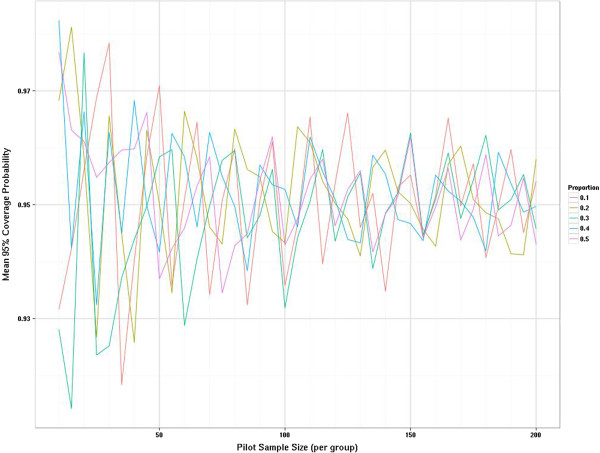
BACKGROUND: External pilot or feasibility studies can be used to estimate key unknown parameters to inform the design of the definitive randomised controlled trial (RCT). However, there is little consensus on how large pilot studies need to be, and some suggest inflating estimates to adjust for the lack of precision when planning the definitive RCT. METHODS: We use a simulation approach to illustrate the sampling distribution of the standard deviation for continuous outcomes and the event rate for binary outcomes. We present the impact of increasing the pilot sample size on the precision and bias of these estimates, and predicted power under three realistic scenarios. We also illustrate the consequences of using a confidence interval argument to inflate estimates so the required power is achieved with a pre-specified level of confidence. We limit our attention to external pilot and feasibility studies prior to a two-parallel-balanced-group superiority RCT. RESULTS: For normally distributed outcomes, the relative gain in precision of the pooled standard deviation (SDp) is less than 10% (for each five subjects added per group) once the total sample size is 70. For true proportions between 0.1 and 0.5, we find the gain in precision for each five subjects added to the pilot sample is less than 5% once the sample size is 60. Adjusting the required sample sizes for the imprecision in the pilot study estimates can result in excessively large definitive RCTs and also requires a pilot sample size of 60 to 90 for the true effect sizes considered here. CONCLUSIONS: We recommend that an external pilot study has at least 70 measured subjects (35 per group) when estimating the SDp for a continuous outcome. If the event rate in an intervention group needs to be estimated by the pilot then a total of 60 to 100 subjects is required. Hence if the primary outcome is binary a total of at least 120 subjects (60 in each group) may be required in the pilot trial. It is very much more efficient to use a larger pilot study, than to guard against the lack of precision by using inflated estimates.
Overview
The claims and statistics of this paper haven’t been checked yet.
Free: it reads the open-access text and checks the first 5 claims that cite a source we can check. Create a free account to check every claim.
Integrity signals
Registry
Cites
Statistics
Figures



Verification
Claims the paper makes
The claims and statistics of this paper haven’t been checked yet.
Free: it reads the open-access text and checks the first 5 claims that cite a source we can check. Create a free account to check every claim.
Claims other papers make about this one
Each is checked against this paper’s own text: does it say what the citing paper says it does?
The cited source doesn’t support the claim as written.
In the citing paper
“Another limitation is that the sample size was relatively small, although this was consistent with previous recommendations of 24-35 participants for pilot and feasibility studies to provide sufficient data and precision of means and variances.117,134,135”
From Acceptance and commitment therapy for older people with treatment-resistant generalised anxiety disorder: The FACTOID feasibility study (2021) · cites this paper as [117]
Checked by a reasoning model — may be wrong.
Experimental — accuracy not yet measuredThe cited source doesn’t support the claim as written.
In the citing paper
“A sample size of 40 was chosen following conventional recommendations for feasibility studies [26] and an estimated 12.5% loss to follow-up based on a preliminary study of ACT in older people with GAD [15].”
From Acceptance and commitment therapy for late-life treatment-resistant generalised anxiety disorder: a feasibility study. (2021) · cites this paper as [26]
Checked by a reasoning model — may be wrong.
Experimental — accuracy not yet measuredThe source backs part of the claim, not all of it — or backs it for a different population, condition or comparison.
In the citing paper
“A sample size of 35 is generally recommended for feasibility studies to provide sufficient data and precision of means and variances.117”
From Acceptance and commitment therapy for older people with treatment-resistant generalised anxiety disorder: The FACTOID feasibility study (2021) · cites this paper as [117]
Experimental — accuracy not yet measuredThe source backs part of the claim, not all of it — or backs it for a different population, condition or comparison.
In the citing paper
“This is sufficient to inform the sample size of the optimisation trial assuming adherence data are pooled across conditions.96”
From Refining and optimising a behavioural intervention to support endocrine therapy adherence (ROSETA) in UK women with breast cancer: Protocol for a pilot fractional factorial trial (2023) · cites this paper as [96]
Experimental — accuracy not yet measuredThe source backs part of the claim, not all of it — or backs it for a different population, condition or comparison.
In the citing paper
“previous guidelines suggesting that 60 to 100 participants per intervention arm are optimal for estimating binary outcomes in pilot RCTs [54]”
From Feasibility and Preliminary Efficacy of Web-Based and Mobile Interventions for Common Mental Health Problems in Working Adults: Multi-Arm Randomized Pilot Trial (2022) · cites this paper as [54]
Experimental — accuracy not yet measured
9 more claims about this paper
Create a free account to see every claim other papers make about this one.
Self-check
Percentages, sums and reported differences re-computed from the paper’s own numbers.
The self-check needs the paper’s full text.
Citations
Cites
R: A Language and Environment for Statistical Computing
R Core Team (2025) · doi:10.32614/r.manuals · Cited by 352,181
An Approximate Distribution of Estimates of Variance Components
Satterthwaite, F. E. (1946) · Biometrics Bulletin · doi:10.2307/3002019 · Cited by 4,373
THE GENERALIZATION OF ‘STUDENT'S’ PROBLEM WHEN SEVERAL DIFFERENT POPULATION VARLANCES ARE INVOLVED
WELCH, B. L. (1947) · Biometrika · doi:10.1093/biomet/34.1-2.28 · Cited by 4,135
A tutorial on pilot studies: the what, why and how
Thabane, L., Ma, J., Chu, R., Cheng, J., Ismaila, A., Rios, L. P., Robson, R., Thabane, M., Giangregorio, L., & Goldsmith, C. H. (2010) · BMC Medical Research Methodology · doi:10.1186/1471-2288-10-1 · Cited by 3,384
Approximate is Better than “Exact” for Interval Estimation of Binomial Proportions
Agresti, A., & Coull, B. A. (1998) · The American Statistician · doi:10.1080/00031305.1998.10480550 · Cited by 3,223
Sample size of 12 per group rule of thumb for a pilot study
Julious, S. A. (2005) · Pharmaceutical Statistics · doi:10.1002/pst.185 · Cited by 3,068
Kirkwood, B. R., & Sterne, J. A. C. (2014) · Bristol Research (University of Bristol) · Cited by 2,820
Sim, J., & Lewis, M. (2012) · Journal of Clinical Epidemiology · doi:10.1016/j.jclinepi.2011.07.011 · Cited by 1,036
On the use of a pilot sample for sample size determination
Browne, R. H. (1995) · Statistics in Medicine · doi:10.1002/sim.4780141709 · Cited by 1,007
McDonald, A. M., Knight, R. C., Campbell, M. K., Entwistle, V. A., Grant, A. M., Cook, J. A., Elbourne, D. R., Francis, D., Garcia, J., Roberts, I., et al. (2006) · Trials · doi:10.1186/1745-6215-7-9 · Cited by 946
Research works printed but not linked: 2
- StataCorp: Statistical Software: Release 12. 2011, TX: College Station
- Cohen J: Statistical Power Analysis for the Behavioural Sciences. 1988, Hillsdale, NJ: Lawrence Erlbaum, 2
Cited by
CONSORT 2010 statement: extension to randomised pilot and feasibility trials.
Eldridge, S. M., Chan, C. L., Campbell, M. J., Bond, C. M., Hopewell, S., Thabane, L., & Lancaster, G. A. (2016) · BMJ · doi:10.1136/bmj.i5239 · Cited by 3,404
CONSORT 2010 statement: extension to randomised pilot and feasibility trials
on behalf of the PAFS consensus group, Eldridge, S. M., Chan, C. L., Campbell, M. J., Bond, C. M., Hopewell, S., Thabane, L., & Lancaster, G. A. (2016) · Pilot and Feasibility Studies · doi:10.1186/s40814-016-0105-8 · Cited by 2,843
Lakens, D. (2022) · Collabra Psychology · doi:10.1525/collabra.33267 · Cited by 1,962
Whitehead, A. L., Julious, S. A., Cooper, C. L., & Campbell, M. J. (2016) · Statistical Methods in Medical Research · doi:10.1177/0962280215588241 · Cited by 1,936
Self-citationGuidance for conducting feasibility and pilot studies for implementation trials
Pearson, N., Naylor, P.-J., Ashe, M. C., Fernandez, M., Yoong, S. L., & Wolfenden, L. (2020) · Pilot and Feasibility Studies · doi:10.1186/s40814-020-00634-w · Cited by 475
Metadata
- Authors
- Teare, M. D., Dimairo, M., Shephard, N., Hayman, A., Whitehead, A., & Walters, S. J.
- Affiliations
- University of Sheffield (GB)
- Corresponding author
- Teare, M Dawn
- Venue
- Trials
- Published
- 2014-07-03
- Volume
- 15
- Issue
- 1
- Pages
- 264-264
- ISSN
- 1745-6215 (ISSN-L)
- PMC
- PMC4227298
- OpenAlex
- W2170036462
- Cited by
- 773
- References
- 31
- Citations by year
- 2026: 84 · 2025: 118 · 2024: 109 · 2023: 120 · 2022: 59 · 2021: 89 · 2020: 78 · 2019: 36 · 2018: 34 · 2017: 24 · 2016: 12 · 2015: 7 · 2014: 1
- FWCI
- 15.49
- Type
- journal article
- Language
- en
- Open access
- gold
- doi.org
- Licence
- cc-by
- Locations
- Trials (publishedVersion, cc-by)
- Europe PMC (PubMed Central) (publishedVersion, cc-by)
- PubMed Central (publishedVersion, cc-by)
- PubMed (publishedVersion)
- VU Research Portal (publishedVersion, other-oa)
- White Rose Research Online (University of Leeds, The University of Sheffield, University of York) (acceptedVersion)
- ePrints Soton (University of Southampton) (acceptedVersion)
- Data Archiving and Networked Services (DANS) (submittedVersion, other-oa)
- Newcastle University ePrints (Newcastle Univesity) (cc-by)
- Funders
- National Institute for Health and Care Research (DRF-2012-05-182)
- University of Sheffield
- Topics
- Physical Sciences › Mathematics › Statistics and Probability › Statistical Methods in Clinical Trials
- Social Sciences › Decision Sciences › Statistics, Probability and Uncertainty › Meta-analysis and systematic reviews
- Physical Sciences › Mathematics › Statistics and Probability › Statistical Methods in Epidemiology
- Keywords
- feasibility study, sample size determination, standard deviation estimation, event rate estimation, statistical power, continuous outcomes, binary outcomes
- MeSH terms
- Computer Simulation, Data Interpretation, Statistical, Feasibility Studies, Humans, Pilot Projects, Models, Statistical, Randomized Controlled Trials as Topic, Sample Size
About these checks
Registry, retraction, Cites and statistics results are computed, not judged, with one exception: a printed reference that no index lists is read once by a model before it counts as a citation error. Claims are extracted by a model and kept only when their quote appears verbatim in the text; each cited source is then checked, with a model’s help, for whether it says what the claim relies on. Those verdicts can be wrong — read the claim’s quote and the cited source before relying on one.
Statistics and arithmetic are recomputed, not judged.
Confidence bands are shown only for fields calibrated on our annotated test set. None is calibrated yet, so no band is shown.
What counts as a claim ›How we measure confidence ›How we check this ›
Are you an author, or do you see a problem with this page? Request a review
How to cite
Cite CoChat for the checks on this page, and the paper for its own findings.
- This page
- CoChat. (2026). Citation check: Sample size requirements to estimate key design parameters from external pilot randomised controlled trials: a simulation study. https://app.cochat.ai/papers/10.1186/1745-6215-15-264
- The paper
- Teare, M. D., Dimairo, M., Shephard, N., Hayman, A., Whitehead, A., & Walters, S. J. (2014). Sample size requirements to estimate key design parameters from external pilot randomised controlled trials: a simulation study. Trials. https://doi.org/10.1186/1745-6215-15-264
Data sources
Bibliographic data: Semantic Scholar, OpenAlex, Crossref.
Contains information from the Semantic Scholar Academic Graph Datasets, made available under the ODC Attribution License (ODC-BY 1.0).
Semantic Scholar’s data is described in: Kinney, R., et al. (2023). The Semantic Scholar Open Data Platform. arXiv:2301.10140.
