Cited by 108

The DOI matches its Crossref record; 6 of the 6 references it cites were found in a registry or an index.

Mitochondrial permeability transition pore induces mitochondria injury in Huntington disease

Quintanilla, Rodrigo A, Jin, Youngnam N, von Bernhardi, Rommy, Johnson, Gail VW·2013·Molecular Neurodegeneration

Overview

The claims and statistics of this paper haven’t been checked yet.

Run the check — free, no account needed. It reads the open-access text and checks the sources it cites.

A few free checks a day · papers already verified open instantly · results are public

Integrity signals

Registry

Crossref · 10.1186/1750-1326-8-45

Cites

6 of 6 references verified0 citation errors · 0 not checkable

Statistics

Figures

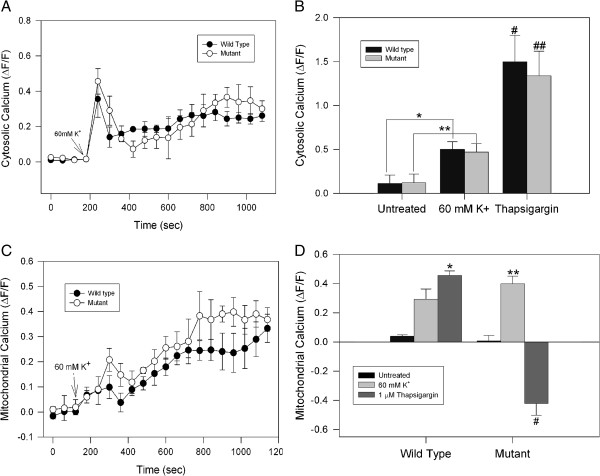
Figure 1 Effect of cell depolarization on calcium regulation in striatal cells. A, B striatal cells were loaded with Fluo3 AM and cytosolic calcium was measured using confocal microscopy. Fluo3 fluorescence changes were measured after cells were treated with 60 mM KCl for 30 min. Fluo3 intensity variations represent changes in cytosolic calcium levels and are expressed using the pseudo ratio ΔF/F0 (see Methods). B, quantitative analysis of 4 independent experiments of striatal cells treated with 60 mM KCl and 1 μM thapsigargin. No differences in cytosolic calcium peak were observed when wild type and mutant cells were compared. Data correspond to the mean ± S.E.M. of four independent experiments. * p < 0.05 compared with untreated wild type cells, ** p < 0.05 compared with untreated mutant cells, # p < 0.05 compared to with wild type cells treated with KCL, and ## p < 0.05 compared to mutant cells treated with KCL. C, D clonal striatal cells were loaded with Rhod2 AM/MitoGreen and treated with 60 mM KCl during 30 min for mitochondrial calcium determinations using confocal microscopy. KCl induced a mitochondrial calcium increase in both cell types, with no significant differences between wild type and mutant cells. Mitochondrial calcium levels were represented using pseudo ratio ΔF/F0. D, quantitative analysis of 4 independent experiments shows an increased mitochondrial calcium levels in both mutant and wild type cells exposed to KCl. Interestingly, mutant cells treated with 1 μM thapsigargin for 30 min showed a severe decrease in mitochondrial calcium uptake compared with wild type cells. Data correspond to the mean ± S.E.M. of four independent experiments. * p < 0.05 compared with wild type cells treated with KCl, ** p < 0.05 compared with mutant cells treated with KCl, and # p < 0.05 compared to mutant cells treated with KCL.
Figure 1 Effect of cell depolarization on calcium regulation in striatal cells. A, B striatal cells were loaded with Fluo3 AM and cytosolic calcium was measured using confocal microscopy. Fluo3 fluorescence changes were measured after cells were treated with 60 mM KCl for 30 min. Fluo3 intensity variations represent changes in cytosolic calcium levels and are expressed using the pseudo ratio ΔF/F0 (see Methods). B, quantitative analysis of 4 independent experiments of striatal cells treated with 60 mM KCl and 1 μM thapsigargin. No differences in cytosolic calcium peak were observed when wild type and mutant cells were compared. Data correspond to the mean ± S.E.M. of four independent experiments. * p < 0.05 compared with untreated wild type cells, ** p < 0.05 compared with untreated mutant cells, # p < 0.05 compared to with wild type cells treated with KCL, and ## p < 0.05 compared to mutant cells treated with KCL. C, D clonal striatal cells were loaded with Rhod2 AM/MitoGreen and treated with 60 mM KCl during 30 min for mitochondrial calcium determinations using confocal microscopy. KCl induced a mitochondrial calcium increase in both cell types, with no significant differences between wild type and mutant cells. Mitochondrial calcium levels were represented using pseudo ratio ΔF/F0. D, quantitative analysis of 4 independent experiments shows an increased mitochondrial calcium levels in both mutant and wild type cells exposed to KCl. Interestingly, mutant cells treated with 1 μM thapsigargin for 30 min showed a severe decrease in mitochondrial calcium uptake compared with wild type cells. Data correspond to the mean ± S.E.M. of four independent experiments. * p < 0.05 compared with wild type cells treated with KCl, ** p < 0.05 compared with mutant cells treated with KCl, and # p < 0.05 compared to mutant cells treated with KCL.CC BY · PubMed Central
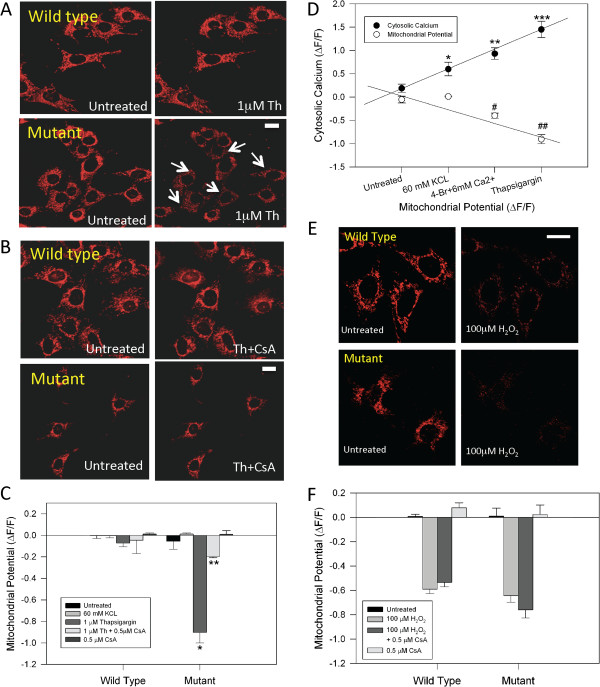
Figure 2 Treatment with Cyclosporine A prevents mitochondrial injury induced by thapsigargin in mutant HD cells. A, live confocal images of MitoRed, an indicator of mitochondrial potential, in striatal cells, untreated and treated with 1 μM thapsigargin (Th) for 30 min. Thapsigargin induces a significant decrease in the mitochondrial potential in mutant cells (see white arrows). Bar represents 10 μm. B, images show that CsA protects mutant huntingtin cells exposed to thapsigargin from mitochondrial impairment. Bar represents 10 μm. C, quantification of MitoRed intensities as relative units (ΔF/F0) in striatal cells treated for 30 min with experimental conditions as indicated. Data are the mean ± S.E.M. of 4 independent experiments. *, p < 0.05 compared with wild type cells treated with thapsigargin; ** p < 0.05 compared with mutant cells exposed to thapsigargin. D, correlation analysis of mitochondrial potential and cytosolic calcium observed in mutant cells treated with the indicated conditions for 30 min. Cytosolic calcium was estimated from the peak levels. Mitochondrial potential were obtained after 30 min of treatment for every condition. Data are expressed as the mean ± S.E.M. of 4 independent experiments. *, p < 0.05 compared to control; ** p < 0.05 compared to 60 mM KCL; ***, p < 0.05 compared to 4-BrA23187(1 nM) + 6 mM Ca2+. # compared to 60 mM KCL; ## compared to 4-BrA23187 + 6mM Ca2+. E, confocal images of mitochondrial potential in striatal cells, untreated and treated with 100 μM H2O2 for 1h. Bar represents 10 μm. F, striatal cells were incubated with 100 μM H2O2 for 1 h and mitochondrial potential was evaluated. MitoRed levels are show as relative units (ΔF/F0) at 1 h. Data is expressed as the mean ± S.E.M. of 3 independent experiments.
Figure 2 Treatment with Cyclosporine A prevents mitochondrial injury induced by thapsigargin in mutant HD cells. A, live confocal images of MitoRed, an indicator of mitochondrial potential, in striatal cells, untreated and treated with 1 μM thapsigargin (Th) for 30 min. Thapsigargin induces a significant decrease in the mitochondrial potential in mutant cells (see white arrows). Bar represents 10 μm. B, images show that CsA protects mutant huntingtin cells exposed to thapsigargin from mitochondrial impairment. Bar represents 10 μm. C, quantification of MitoRed intensities as relative units (ΔF/F0) in striatal cells treated for 30 min with experimental conditions as indicated. Data are the mean ± S.E.M. of 4 independent experiments. *, p < 0.05 compared with wild type cells treated with thapsigargin; ** p < 0.05 compared with mutant cells exposed to thapsigargin. D, correlation analysis of mitochondrial potential and cytosolic calcium observed in mutant cells treated with the indicated conditions for 30 min. Cytosolic calcium was estimated from the peak levels. Mitochondrial potential were obtained after 30 min of treatment for every condition. Data are expressed as the mean ± S.E.M. of 4 independent experiments. *, p < 0.05 compared to control; ** p < 0.05 compared to 60 mM KCL; ***, p < 0.05 compared to 4-BrA23187(1 nM) + 6 mM Ca2+. # compared to 60 mM KCL; ## compared to 4-BrA23187 + 6mM Ca2+. E, confocal images of mitochondrial potential in striatal cells, untreated and treated with 100 μM H2O2 for 1h. Bar represents 10 μm. F, striatal cells were incubated with 100 μM H2O2 for 1 h and mitochondrial potential was evaluated. MitoRed levels are show as relative units (ΔF/F0) at 1 h. Data is expressed as the mean ± S.E.M. of 3 independent experiments.CC BY · PubMed Central
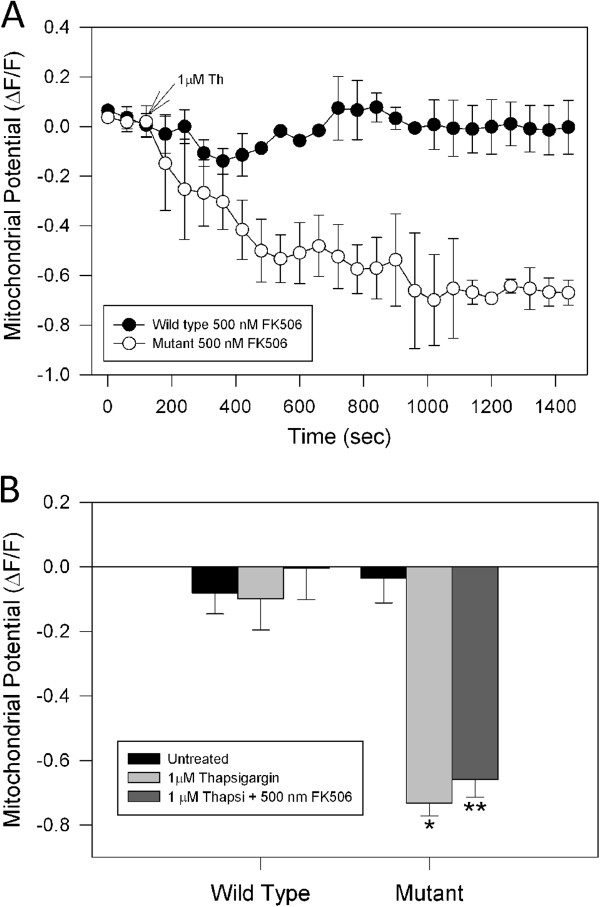
Figure 3 Effects of FK-506 on mitochondria impairment induced by thapsigargin in mutant huntingtin cells. A, wild type and mutant cells were incubated with 500 nM FK-506, an inhibitor of calcineurin activity, for 2 h prior to mitochondrial potential determinations using MitoRed. Striatal cells loaded with MitoRed were exposed to 1 μM thapsigargin (Th) for 30 min, and mitochondrial potential was evaluated using confocal microscopy. Treatment with thapsigargin reduced mitochondrial potential levels in mutant striatal cells pre-treated with FK-506, indicating that calcineurin activity was not playing a role in mitochondrial impairment induced by calcium stress in mutant huntingtin cells. B, quantitation of MitoRed intensities, which represents mitochondrial potential levels, as relative units at 30 min (ΔF/F0) in striatal cells treated with conditions indicated. Data are expressed as the mean ± S.E.M. of 4 independent experiments. *, p < 0.05 compared with wild type cells treated with thapsigargin; ** p < 0.05 compared with wild type cells treated with thapsigargin.
Figure 3 Effects of FK-506 on mitochondria impairment induced by thapsigargin in mutant huntingtin cells. A, wild type and mutant cells were incubated with 500 nM FK-506, an inhibitor of calcineurin activity, for 2 h prior to mitochondrial potential determinations using MitoRed. Striatal cells loaded with MitoRed were exposed to 1 μM thapsigargin (Th) for 30 min, and mitochondrial potential was evaluated using confocal microscopy. Treatment with thapsigargin reduced mitochondrial potential levels in mutant striatal cells pre-treated with FK-506, indicating that calcineurin activity was not playing a role in mitochondrial impairment induced by calcium stress in mutant huntingtin cells. B, quantitation of MitoRed intensities, which represents mitochondrial potential levels, as relative units at 30 min (ΔF/F0) in striatal cells treated with conditions indicated. Data are expressed as the mean ± S.E.M. of 4 independent experiments. *, p < 0.05 compared with wild type cells treated with thapsigargin; ** p < 0.05 compared with wild type cells treated with thapsigargin.CC BY · PubMed Central
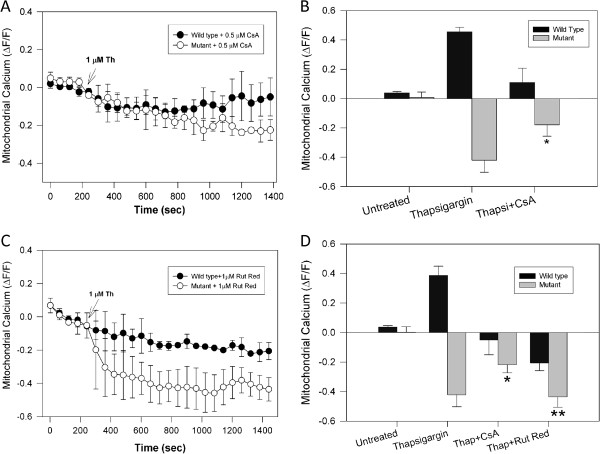
Figure 4 Treatment with Cyclosporine A improved mitochondrial calcium uptake in mutant huntingtin cells exposed to calcium overload. A, striatal cells were loaded with Rhod2 AM dye to determine mitochondrial calcium levels in cells exposed to 1 μM thapsigargin (Th) during 30 min. Thapsigargin treatment severely decreased mitochondrial calcium uptake. Striatal cells were incubated for 2 h with 0.5 μM Cyclosporine A (CsA) prior to determination of mitochondrial calcium levels in response to thapsigargin treatment. CsA prevented the mitochondrial calcium decrease induced by thapsigargin in the mutant cells. B, quantification of mitochondrial calcium levels from 4 independent experiments obtained from cells exposed to thapsigargin for 30 min. *, p < 0.05 compared with mutant cells treated with thapsigargin alone. C, wild type and mutant cells were pre-treated with 1 μM ruthenium red for 1 h, before addition of 1 μM thapsigargin. Ruthenium red did not prevent the mitochondrial calcium decrease induced by thapsigargin in mutant cells. D, quantification of mitochondrial calcium uptake at 30 min shows that thapsigargin only induced a significant increase in mitochondrial calcium only in wild type cells. Thapsigargin treatment of mutant cells resulted in a pronounced decrease in mitochondrial calcium uptake by mutant cells, and this event was partially blocked by CsA pre-treatment. Data are the mean ± S.E.M. of 3 separate experiments. *, p < 0.05 compared with mutant cells treated with thapsigargin; **, p < 0.05 compared with mutant cells treated with thapsigargin plus CsA. p < 0.05 for nonpaired Student’s t test.
Figure 4 Treatment with Cyclosporine A improved mitochondrial calcium uptake in mutant huntingtin cells exposed to calcium overload. A, striatal cells were loaded with Rhod2 AM dye to determine mitochondrial calcium levels in cells exposed to 1 μM thapsigargin (Th) during 30 min. Thapsigargin treatment severely decreased mitochondrial calcium uptake. Striatal cells were incubated for 2 h with 0.5 μM Cyclosporine A (CsA) prior to determination of mitochondrial calcium levels in response to thapsigargin treatment. CsA prevented the mitochondrial calcium decrease induced by thapsigargin in the mutant cells. B, quantification of mitochondrial calcium levels from 4 independent experiments obtained from cells exposed to thapsigargin for 30 min. *, p < 0.05 compared with mutant cells treated with thapsigargin alone. C, wild type and mutant cells were pre-treated with 1 μM ruthenium red for 1 h, before addition of 1 μM thapsigargin. Ruthenium red did not prevent the mitochondrial calcium decrease induced by thapsigargin in mutant cells. D, quantification of mitochondrial calcium uptake at 30 min shows that thapsigargin only induced a significant increase in mitochondrial calcium only in wild type cells. Thapsigargin treatment of mutant cells resulted in a pronounced decrease in mitochondrial calcium uptake by mutant cells, and this event was partially blocked by CsA pre-treatment. Data are the mean ± S.E.M. of 3 separate experiments. *, p < 0.05 compared with mutant cells treated with thapsigargin; **, p < 0.05 compared with mutant cells treated with thapsigargin plus CsA. p < 0.05 for nonpaired Student’s t test.CC BY · PubMed Central
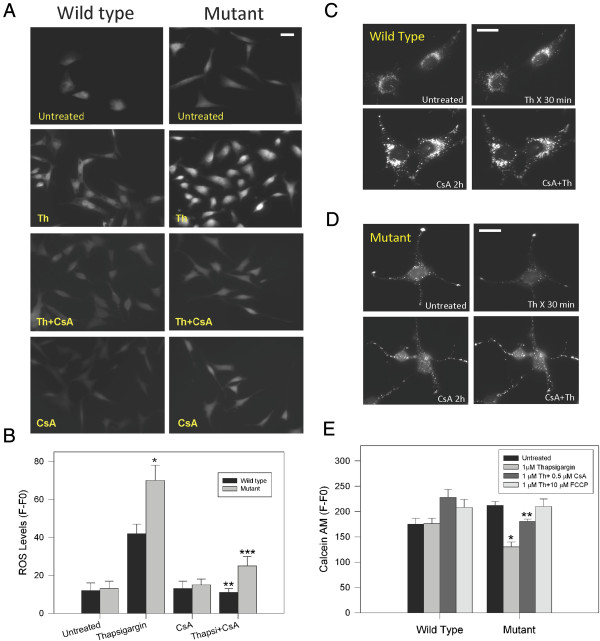
Figure 5 Cyclosporine A prevented Reactive Oxygen Species (ROS) production and mMTP opening induced by thapsigargin in mutant huntingtin cells. A, representative fluorescence images of 2,7-dichlorofluorescein indicating the levels of ROS striatal cells challenged with 1 μM thapsigargin (Th) for 1 h, CsA for 2 h and both. Increased levels of ROS in striatal cells treated with thapsigargin (A and B) were prevented by pretreatment with CsA. Bar =10 μm. B, Quantitative ROS levels. Data are the mean ± S.E.M. of 3 independent experiments. *, p < 0.05 compared with thapsigargin treated wild type cells; **, p < 0.05 compared with thapsigargin treated wild type cells. ***, p < 0.05 compared with mutant cells treated with thapsigargin. p < 0.05 by non-paired Student’s t test. C and D, representative fluorescence images of wild type (C) and mutant cells (D) cells loaded with calcein AM/Cobalt for 30 min indicating the state of the mPTP [35]. Cells were treated with 1 μM thapsigargin (Th) for 30 1 h and pre-treated with 0.5 μM CsA for 2 h. Treatment with thapsigargin decreased calcein fluorescence intensity in mutant cells indicating that calcium overload opens the mPTP (C). Treatment with CsA prevented the loss of calcein intensity in mutant cells, closing the mPTP. In C and D bar represents 10 μM. E, Calcein intensity levels in striatal cells treated with indicated conditions for 1 h. Quantitation in treated mutant cells revealed that thapsigargin induced mPTP opening. CsA prevented mPTP opening in mutant cells exposed to thapsigargin. Mitochondria depolarization induced by FCCP did not affect mPTP in mutant huntingtin cells. Data correspond to the mean ± S.E.M. of 4 independent experiments. * p < 0.05 compared with wild type cells treated with thapsigargin. ** p < 0.05 compared with mutant cells treated with thapsigargin.
Figure 5 Cyclosporine A prevented Reactive Oxygen Species (ROS) production and mMTP opening induced by thapsigargin in mutant huntingtin cells. A, representative fluorescence images of 2,7-dichlorofluorescein indicating the levels of ROS striatal cells challenged with 1 μM thapsigargin (Th) for 1 h, CsA for 2 h and both. Increased levels of ROS in striatal cells treated with thapsigargin (A and B) were prevented by pretreatment with CsA. Bar =10 μm. B, Quantitative ROS levels. Data are the mean ± S.E.M. of 3 independent experiments. *, p < 0.05 compared with thapsigargin treated wild type cells; **, p < 0.05 compared with thapsigargin treated wild type cells. ***, p < 0.05 compared with mutant cells treated with thapsigargin. p < 0.05 by non-paired Student’s t test. C and D, representative fluorescence images of wild type (C) and mutant cells (D) cells loaded with calcein AM/Cobalt for 30 min indicating the state of the mPTP [35]. Cells were treated with 1 μM thapsigargin (Th) for 30 1 h and pre-treated with 0.5 μM CsA for 2 h. Treatment with thapsigargin decreased calcein fluorescence intensity in mutant cells indicating that calcium overload opens the mPTP (C). Treatment with CsA prevented the loss of calcein intensity in mutant cells, closing the mPTP. In C and D bar represents 10 μM. E, Calcein intensity levels in striatal cells treated with indicated conditions for 1 h. Quantitation in treated mutant cells revealed that thapsigargin induced mPTP opening. CsA prevented mPTP opening in mutant cells exposed to thapsigargin. Mitochondria depolarization induced by FCCP did not affect mPTP in mutant huntingtin cells. Data correspond to the mean ± S.E.M. of 4 independent experiments. * p < 0.05 compared with wild type cells treated with thapsigargin. ** p < 0.05 compared with mutant cells treated with thapsigargin.CC BY · PubMed Central
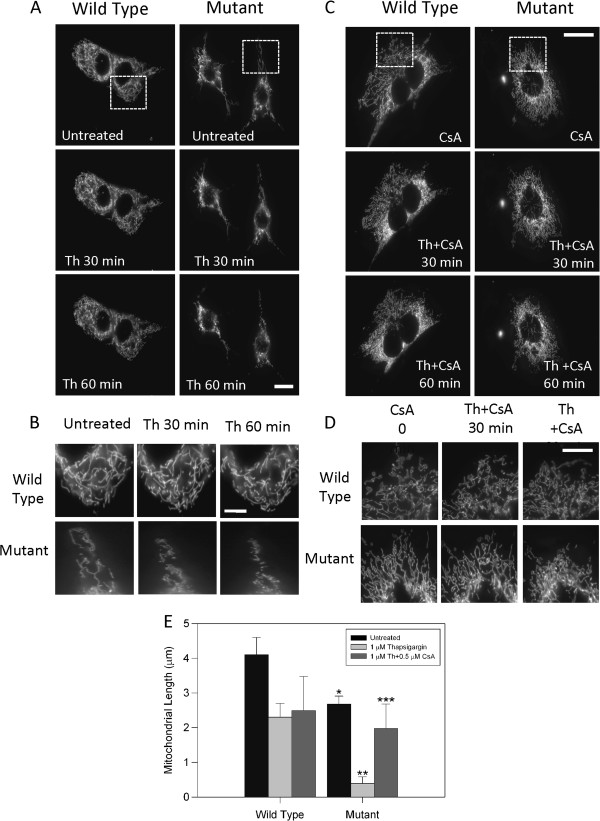
Figure 6 Mitochondrial fragmentation induced by calcium overload was prevented by inhibition of mPTP in mutant huntingtin cells. A, striatal cells transfected with Mito-GFP protein were treated with 1 μM thapsigargin (Th) during 60 min before live fluorescence images were taken. Images were acquired from full resolution images obtained with 63X objective in a Zeiss Axiovert LED fluorescence microscope. Thapsigargin treatment induced a significant fragmentation of mitochondria in mutant compared with wild type cells. Bar = 10 μm. B, magnification of boxed regions from A to emphasize differences of mitochondrial morphology in striatal cells. Bar = 5 μm. C, striatal cells transfected with Mito-GFP protein were treated with thapsigargin (Th) plus cyclosporine A (CsA) during 60 min and live fluorescence images were obtained. Images were acquired from full resolution images obtained with 63X objective in a Zeiss Axiovert LED fluorescence microscope. Thapsigargin treatment induced significant fragmentation of mitochondria in mutant compared with wild type cells. Mitochondria fragmentation produced by calcium stress was abolished by mPTP closure induced by 0.5 μM CsA treatment for 2 h. Bar = 10 μm. D, magnification of boxed regions from A to emphasize differences of mitochondrial morphology in striatal cells. Bar = 5 μm. E, quantitation of mitochondrial length of 4 independent experiments showed significant mitochondria fragmentation in mutant cells exposed to thapsigargin and this effect was prevented by co-treatment with CsA. Data correspond to the mean ± S.E.M. of 4 independent experiments. * p < 0.05 compared with wild type treated with thapsigargin. ** p < 0.05 compared with mutant cells treated with thapsigargin.
Figure 6 Mitochondrial fragmentation induced by calcium overload was prevented by inhibition of mPTP in mutant huntingtin cells. A, striatal cells transfected with Mito-GFP protein were treated with 1 μM thapsigargin (Th) during 60 min before live fluorescence images were taken. Images were acquired from full resolution images obtained with 63X objective in a Zeiss Axiovert LED fluorescence microscope. Thapsigargin treatment induced a significant fragmentation of mitochondria in mutant compared with wild type cells. Bar = 10 μm. B, magnification of boxed regions from A to emphasize differences of mitochondrial morphology in striatal cells. Bar = 5 μm. C, striatal cells transfected with Mito-GFP protein were treated with thapsigargin (Th) plus cyclosporine A (CsA) during 60 min and live fluorescence images were obtained. Images were acquired from full resolution images obtained with 63X objective in a Zeiss Axiovert LED fluorescence microscope. Thapsigargin treatment induced significant fragmentation of mitochondria in mutant compared with wild type cells. Mitochondria fragmentation produced by calcium stress was abolished by mPTP closure induced by 0.5 μM CsA treatment for 2 h. Bar = 10 μm. D, magnification of boxed regions from A to emphasize differences of mitochondrial morphology in striatal cells. Bar = 5 μm. E, quantitation of mitochondrial length of 4 independent experiments showed significant mitochondria fragmentation in mutant cells exposed to thapsigargin and this effect was prevented by co-treatment with CsA. Data correspond to the mean ± S.E.M. of 4 independent experiments. * p < 0.05 compared with wild type treated with thapsigargin. ** p < 0.05 compared with mutant cells treated with thapsigargin.CC BY · PubMed Central
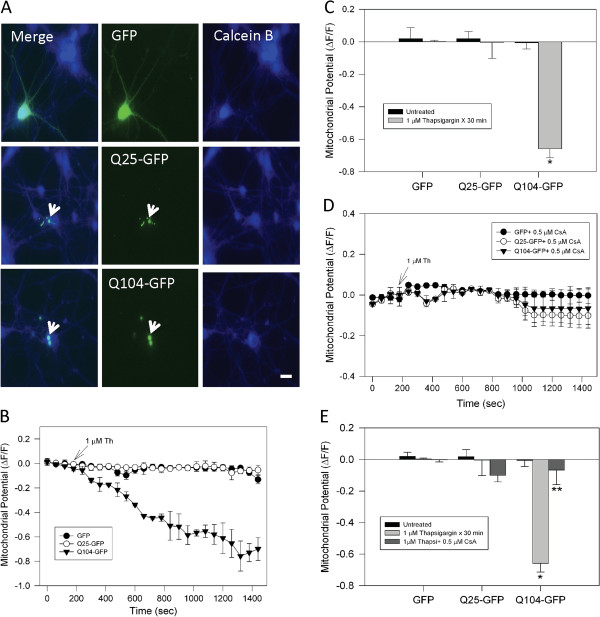
Figure 7 Mitochondrial impairment induced by thapsigargin was prevented by cyclosporine A in neurons that expressed mutant huntingtin. A, representative fluorescence images of cortical neurons loaded with calcein blue AM (Calcein B) and transfected with GFP alone, Q25-GFP (normal huntingtin), or Q104-GFP (mutant huntingtin). Normal and mutant huntingtin expression is indicated by GFP fluorescence intensity (white arrows) and calcein blue staining reveals neuronal morphology. Bar = 10 μm. B, transfected neurons were loaded with MitoRed for determination of mitochondrial potential. Representative trends show that the expression of Q104-GFP significantly reduced mitochondrial potential during treatment with 1 μM thapsigargin (Th). C, quantitation of mitochondrial potential levels showed significant mitochondrial damage in neurons that expressed Q104-GFP. Data correspond to the mean ± S.E.M. of 4 independent experiments. *, p < 0.05 compared with Q25-GFP neurons treated with thapsigargin. D, neurons transfected with GFP, Q25-GFP, or Q104-GFP were treated with 0.5 μM CsA for 2 h before mitochondria potential measurements. Representative trends show that the inhibition of mPTP by CsA prevented mitochondria injury induced by thapsigargin in Q104-GFP positive neurons. E, quantitation of mitochondria potential levels shows that CsA treatment significantly prevented mitochondrial impairment in neurons expressing Q104-GFP compared with the other conditions. Data correspond to the mean ± S.E.M. of 4 independent experiments. * p < 0.05 compared with Q25-GFP neurons treated with thapsigargin. ** p < 0.05 compared with Q104-GFP neurons treated with thapsigargin.
Figure 7 Mitochondrial impairment induced by thapsigargin was prevented by cyclosporine A in neurons that expressed mutant huntingtin. A, representative fluorescence images of cortical neurons loaded with calcein blue AM (Calcein B) and transfected with GFP alone, Q25-GFP (normal huntingtin), or Q104-GFP (mutant huntingtin). Normal and mutant huntingtin expression is indicated by GFP fluorescence intensity (white arrows) and calcein blue staining reveals neuronal morphology. Bar = 10 μm. B, transfected neurons were loaded with MitoRed for determination of mitochondrial potential. Representative trends show that the expression of Q104-GFP significantly reduced mitochondrial potential during treatment with 1 μM thapsigargin (Th). C, quantitation of mitochondrial potential levels showed significant mitochondrial damage in neurons that expressed Q104-GFP. Data correspond to the mean ± S.E.M. of 4 independent experiments. *, p < 0.05 compared with Q25-GFP neurons treated with thapsigargin. D, neurons transfected with GFP, Q25-GFP, or Q104-GFP were treated with 0.5 μM CsA for 2 h before mitochondria potential measurements. Representative trends show that the inhibition of mPTP by CsA prevented mitochondria injury induced by thapsigargin in Q104-GFP positive neurons. E, quantitation of mitochondria potential levels shows that CsA treatment significantly prevented mitochondrial impairment in neurons expressing Q104-GFP compared with the other conditions. Data correspond to the mean ± S.E.M. of 4 independent experiments. * p < 0.05 compared with Q25-GFP neurons treated with thapsigargin. ** p < 0.05 compared with Q104-GFP neurons treated with thapsigargin.CC BY · PubMed Central
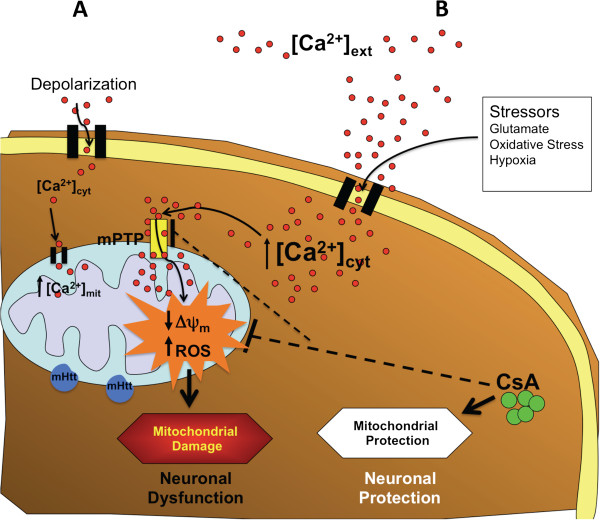
Figure 8 Role of mPTP in mitochondrial damage induced by mutant huntingtin. Representative scheme showing the interplay between calcium regulation, mitochondrial function and mPTP in mutant huntingtin cells. (A), in response to controlled cytosolic calcium increase striatal cells can efficiently regulate calcium homeostasis and mitochondrial function even with the presence of mutant huntingtin. However, pathological calcium increases activated mPTP inducing mitochondrial depolarization and oxidative stress conducing to neuronal dysfunction (B). These two signs of mitochondrial damage can be prevented by inhibition with CsA, an inhibitor of mPTP, which improve mitochondrial function and neuronal health.
Figure 8 Role of mPTP in mitochondrial damage induced by mutant huntingtin. Representative scheme showing the interplay between calcium regulation, mitochondrial function and mPTP in mutant huntingtin cells. (A), in response to controlled cytosolic calcium increase striatal cells can efficiently regulate calcium homeostasis and mitochondrial function even with the presence of mutant huntingtin. However, pathological calcium increases activated mPTP inducing mitochondrial depolarization and oxidative stress conducing to neuronal dysfunction (B). These two signs of mitochondrial damage can be prevented by inhibition with CsA, an inhibitor of mPTP, which improve mitochondrial function and neuronal health.CC BY · PubMed Central

Verification

Claims the paper makes

The claims and statistics of this paper haven’t been checked yet.

Run the check — free, no account needed. It reads the open-access text and checks the sources it cites.

A few free checks a day · papers already verified open instantly · results are public

Claims other papers make about this one

Each is checked against this paper’s own text: does it say what the citing paper says it does?

Self-check

Percentages, sums and reported differences re-computed from the paper’s own numbers.

The self-check needs the paper’s full text.

Citations

Cites

Show all 6 references

Research works printed but not linked: 43

  1. 10.1016/0092-8674(93)90585-E · DOI · Paper page
  2. 10.1016/S0166-2236(00)01721-5 · DOI
  3. 10.1016/j.cell.2006.09.015 · DOI · Paper page
  4. 10.1080/07853890410031948 · DOI
  5. 10.1177/1073858405280639 · DOI
  6. 10.1016/S0896-6273(03)00366-0 · DOI
  7. 10.1002/ana.410390317 · DOI · Paper page
  8. 10.1111/j.1749-6632.1999.tb07856.x · DOI
  9. 10.1093/hmg/ddh082 · DOI
  10. 10.1016/S0896-6273(00)80764-3 · DOI
  11. 10.1523/JNEUROSCI.3455-07.2007 · DOI
  12. 10.1523/JNEUROSCI.3004-06.2006 · DOI
  13. 10.1074/jbc.M504749200 · DOI
  14. 10.1074/jbc.M603845200 · DOI
  15. 10.1074/jbc.M804291200 · DOI
  16. 10.1016/j.nbd.2005.12.007 · DOI
  17. 10.1093/hmg/ddq306 · DOI
  18. 10.1371/journal.pone.0057932 · DOI
  19. 10.1002/emmm.201000102 · DOI
  20. 10.1093/hmg/9.19.2799 · DOI
  21. 10.1016/j.brainresbull.2009.07.010 · DOI
  22. 10.1111/j.1471-4159.2004.02516.x · DOI
  23. 10.1007/s10495-007-0723-y · DOI
  24. 10.1042/0264-6021:3410233 · DOI · Paper page
  25. 10.1016/j.cell.2012.05.014 · DOI · Paper page
  26. 10.1074/jbc.M112.407726 · DOI
  27. 10.1016/j.devcel.2011.08.008 · DOI
  28. 10.1002/jnr.22709 · DOI
  29. 10.1016/S0014-5793(97)01088-0 · DOI
  30. 10.1111/j.1742-4658.2005.04781.x · DOI
  31. 10.1523/JNEUROSCI.4468-06.2007 · DOI
  32. 10.1016/j.freeradbiomed.2011.09.030 · DOI
  33. 10.1016/S0006-3495(99)77239-5 · DOI
  34. 10.1016/S0962-8924(01)02246-2 · DOI · Paper page
  35. 10.1016/S0955-0674(03)00070-X · DOI
  36. 10.1196/annals.1427.030 · DOI
  37. 10.1093/hmg/ddq247 · DOI
  38. 10.1073/pnas.0702228104 · DOI
  39. 10.1016/j.nbd.2009.05.007 · DOI
  40. 10.1016/j.nbd.2008.11.015 · DOI
  41. 10.1371/journal.pone.0030406 · DOI
  42. 10.1111/j.1471-4159.2007.04491.x · DOI
  43. 10.1523/JNEUROSCI.0060-05.2005 · DOI

Cited by

Sorted by citations

Metadata

Authors
Quintanilla, R. A., Jin, Y. N., von Bernhardi, R., & Johnson, G. V.
Venue
Molecular Neurodegeneration
Published
2013
Volume
8
Issue
1
Pages
45
ISSN
1750-1326
Cited by
108
References
6
Language
en

About these checks

Registry, retraction, Cites and statistics results are computed, not judged, with one exception: a printed reference that no index lists is read once by a model before it counts as a citation error. Claims are extracted by a model and kept only when their quote appears verbatim in the text; each cited source is then checked, with a model’s help, for whether it says what the claim relies on. Those verdicts can be wrong — read the claim’s quote and the cited source before relying on one.

Statistics and arithmetic are recomputed, not judged.

Confidence bands are shown only for fields calibrated on our annotated test set. None is calibrated yet, so no band is shown.

What counts as a claim ›How we measure confidence ›How we check this ›

Are you an author, or do you see a problem with this page? Request a review