

Likelihood based observability analysis and confidence intervals for predictions of dynamic models
Open accessThe DOI matches its Crossref record; 22 of the 22 references it cites were found in a registry or an index; 5 of the 21 sources its claims cite were checked for support.
Abstract
BACKGROUND: Predicting a system's behavior based on a mathematical model is a primary task in Systems Biology. If the model parameters are estimated from experimental data, the parameter uncertainty has to be translated into confidence intervals for model predictions. For dynamic models of biochemical networks, the nonlinearity in combination with the large number of parameters hampers the calculation of prediction confidence intervals and renders classical approaches as hardly feasible. RESULTS: In this article reliable confidence intervals are calculated based on the prediction profile likelihood. Such prediction confidence intervals of the dynamic states can be utilized for a data-based observability analysis. The method is also applicable if there are non-identifiable parameters yielding to some insufficiently specified model predictions that can be interpreted as non-observability. Moreover, a validation profile likelihood is introduced that should be applied when noisy validation experiments are to be interpreted. CONCLUSIONS: The presented methodology allows the propagation of uncertainty from experimental to model predictions. Although presented in the context of ordinary differential equations, the concept is general and also applicable to other types of models. Matlab code which can be used as a template to implement the method is provided at http://www.fdmold.uni-freiburg.de/∼ckreutz/PPL.
Overview
CoChat Summary
TL;DR
The paper presents a likelihood-based prediction profile likelihood method for computing confidence intervals for predictions of nonlinear dynamic models without sampling high-dimensional parameter spaces. It applies the method to a small reaction model and a MAP kinase ODE model, and introduces validation profile likelihood and data-based observability analysis.
Key findings
- Prediction profile likelihood (PPL) yields prediction confidence intervals by constrained maximum likelihood, avoiding explicit high-dimensional parameter sampling; thresholding the PPL gives statistically accurate intervals.
- A validation profile likelihood (VPL) extends the approach to noisy validation experiments; validation confidence intervals are larger than prediction confidence intervals because they account for measurement error.
- Flat PPLs produce unbounded prediction confidence intervals and indicate non-observability. In the small model, measuring C only at t = 0,2,…,20 gave unbounded PCIs for A(t) and B(t) for t > 0, while B(0) was known to be zero.
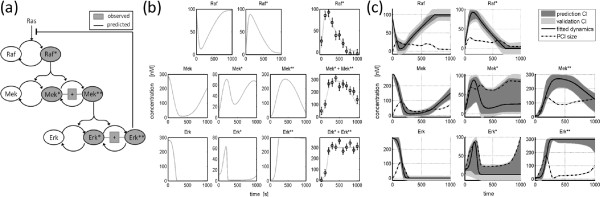
- In the MAP kinase model, 14 parameters were estimated from three times eleven data points; the largest absolute PCI was 176 nM for Erk at t = 181 seconds, Raf/Raf* PCIs were below 40 nM, and Mek* intervals nearly spanned 0–100 nM.
Methods
- For ODE state-space models with additive Gaussian noise, the PPL is defined as the maximum likelihood over parameters satisfying the constraint that the model response equals a fixed prediction value z; confidence intervals use a chi-square threshold. The VPL relaxes this constraint and penalizes deviation from a validation data point by its standard deviation.
- Two examples are used: a small consecutive reaction A→B→C with rates θ1 = 0.05, θ2 = 0.1, initial A(0) = θ3 = 1, B(0) = 0, C(0) = 0, C measured at t = 0,10,…,100 with σ = 0.1; and a MAP kinase ODE model with eight dynamic states, 14 estimated parameters, measurements at 0,100,…,1000 seconds, and σ = 10 nM.
- Analysis uses constrained optimization/profile likelihood calculations, thresholding, and Monte-Carlo coverage checks in Additional file 1; Matlab template code is provided.
Limitations
- Stated: prediction confidence regions are point-wise; multiple predictions from one data set are statistically dependent, and a common region for two dependent predictions would require a two-dimensional prediction profile likelihood, which is beyond the article’s scope.
- Stated: Bayesian MCMC could perform better if a comprehensive prior were available, but in cell biology prior knowledge is very restricted; prior information can be incorporated via maximum a-posteriori estimation.
- Evident from the text: the method relies on reliable numerical parameter optimization and, in the main derivation, assumes additive Gaussian noise with known variance; if assumptions are violated, the threshold must be generated empirically by Monte-Carlo simulations.
Model-written summary. Check it against the paper before relying on it.
Integrity signals
Registry
Cites
Statistics
Figures

Verification
Claims the paper makes
1 Valid · 5 Not valid · 13 Not checked · 62 Own results and interpretations
None of the sources cited for this claim have been checked yet.
In the paper
“For models with tens to hundreds of parameters this is numerically demanding or even infeasible because high dimensional spaces cannot be sampled densely.”
§ Likelihood based observability analysis and confidence intervals for predictions of dynamic models > Background
What the sources say
- Not checked yetcites [9] source
- Could not verifycites [10] sourceExperimental — accuracy not yet measured
Our copy of Hinkley (1979) is a theoretical paper defining predictive likelihood (Sections 2-5, pp. 2-9) with worked examples in one- and two-parameter exponential-family, uniform and Markov-sequence settings (pp. 3-8); no passage discusses computational cost, numerical infeasibility, or the impossibility of densely sampling high-dimensional parameter spaces. Searches on 'numerically demanding / high dimensional space / sampled densely' and on 'computation difficulty, integration over many parameters, large sample size' returned only the definitional and Lemma 1/Appendix passages (pp. 1-10), none of which addresses the claim's point. Absence here is not contradiction, but the claim's assertion is not made or implied anywhere in our copy. (LLM, conf=0.72)
plainstates a cause- Asserted: passes — The authors put it forward as true.
- Checkable: passes — It can be checked against evidence.
- Load-bearing: passes — The paper’s conclusions depend on it.
- Based: passes — The paper gives a reason why it holds.
A result the paper states — it cites no source for it, so there is none to check. The quote shows it is in the paper.
In the paper
“Prediction- as well as validation confidence intervals always cover the prediction for the maximum likelihood parameter estimates.”
§ Likelihood based observability analysis and confidence intervals for predictions of dynamic models > Results > Small illustration model
plain- Asserted: passes — The authors put it forward as true.
- Checkable: passes — It can be checked against evidence.
- Load-bearing: unclear — It is unclear whether the paper’s conclusions depend on it.
- Based: passes — The paper gives a reason why it holds.
A result the paper reports from its own data — it cites no other source for it, so there is none to check. The quote shows it is in the paper.
In the paper
“For the MAP kinase model, prediction confidence intervals and validation confidence intervals for all dynamic states have been determined on the basis of measurements of the phosphorylated proteins.”
§ Likelihood based observability analysis and confidence intervals for predictions of dynamic models > Conclusions
plainstates a cause- Asserted: passes — The authors put it forward as true.
- Checkable: passes — It can be checked against evidence.
- Load-bearing: passes — The paper’s conclusions depend on it.
- Based: passes — The paper gives a reason why it holds.
- Rests on an assumption not shown here.
A result the paper reports from its own data — it cites no other source for it, so there is none to check. The quote shows it is in the paper.
In the paper
“Similarly, the unphosphorylated states of Mek and Erk have narrow prediction confidence intervals.”
§ Likelihood based observability analysis and confidence intervals for predictions of dynamic models > Results > MAP kinase signaling model
plain- Asserted: passes — The authors put it forward as true.
- Checkable: passes — It can be checked against evidence.
- Load-bearing: unclear — It is unclear whether the paper’s conclusions depend on it.
- Based: passes — The paper gives a reason why it holds.
- Rests on 2 assumptions not shown here.
A result the paper reports from its own data — it cites no other source for it, so there is none to check. The quote shows it is in the paper.
In the paper
“Also an algorithm to improve the threshold is provided which yields slightly smaller confidence intervals with the correct coverage.”
§ Likelihood based observability analysis and confidence intervals for predictions of dynamic models > Results > Small illustration model
plainstates a cause- Asserted: passes — The authors put it forward as true.
- Checkable: passes — It can be checked against evidence.
- Load-bearing: unclear — It is unclear whether the paper’s conclusions depend on it.
- Based: passes — The paper gives a reason why it holds.
42 more claims
Create a free account to see all 81 claims and to verify the 16 references still open.
- It may state two separate claims as one. 15
- Probably not a substantial claim. 20
Claims other papers make about this one
Each is checked against this paper’s own text: does it say what the citing paper says it does?
The cited source says what the claim attributes to it.
In the citing paper
“Techniques for this exist in both a frequentist [13,36,91] as well as a Bayesian setting [87,90].”
From Parameter uncertainty in biochemical models described by ordinary differential equations (2013) · cites this paper as [13]
In the citing paper
“By repeating this procedure for different predictions, reliable confidence intervals can be obtained, considering only one-dimensional scans within prediction space.”
From Parameter uncertainty in biochemical models described by ordinary differential equations (2013) · cites this paper as [13]
Citations
Cites
Integrated Genomic and Proteomic Analyses of a Systematically Perturbed Metabolic Network
Ideker, T., Thorsson, V., Ranish, J. A., Christmas, R., Buhler, J., Eng, J. K., Bumgarner, R., Goodlett, D. R., Aebersold, R., & Hood, L. (2001) · Science · doi:10.1126/science.292.5518.929 · Cited by 2,050 · cited 1×
“The applications range from forecasting climate changes [28] via predicting events in a detector in high-energy physics [29] to modeling biological systems [30].”
BackgroundRaue, A., Kreutz, C., Maiwald, T., Bachmann, J., Schilling, M., Klingmüller, U., & Timmer, J. (2009) · Bioinformatics · doi:10.1093/bioinformatics/btp358 · Cited by 1,442
Self-citationPrediction error estimation: a comparison of resampling methods
Molinaro, A. M., Simon, R., & Pfeiffer, R. M. (2005) · Bioinformatics · doi:10.1093/bioinformatics/bti499 · Cited by 1,339 · cited 1×
“the Markov Chain Monte Carlo (MCMC) methods [11,12], and bootstrap based approaches [4,13] are numerically demanding and provide only rough approximations for ODE models.”
MethodMarkov chain Monte Carlo without likelihoods
Marjoram, P., Molitor, J., Plagnol, V., & Tavaré, S. (2003) · Proceedings of the National Academy of Sciences · doi:10.1073/pnas.0306899100 · Cited by 1,199 · cited 1×
“Discussion Existing approaches for prediction confidence intervals likeMCMC [26] or bootstrap procedures are based on forward evaluations of the model for many parameter values.”
MethodKholodenko, B. N. (2000) · European Journal of Biochemistry · doi:10.1046/j.1432-1327.2000.01197.x · Cited by 643 · cited 6×
“[Kholodenko2000] B. N. Kholodenko.”
MethodInfluentialA method for computing profile-likelihood-based confidence intervals
Venzon, D. J., & Moolgavkar, S. H. (1988) · Applied Statistics · doi:10.2307/2347496 · Cited by 565
The interplay of Bayesian and frequentist analysis
Bayarri, M. J., & Berger, J. O. (2004) · Statistical Science · doi:10.1214/088342304000000116 · Cited by 525 · cited 2×
“the parameter space to be sampled, is well-behaved [14].”
BackgroundSwameye, I., Müller, T. G., Timmer, J., Sandra, O., & Klingmüller, U. (2003) · Proceedings of the National Academy of Sciences · doi:10.1073/pnas.0237333100 · Cited by 316
Self-citationThe detector simulation program for the OPAL experiment at LEP
Allison, J., Banks, J., Barlow, R. J., Batley, J. R., Biebel, O., Brun, R., Buijs, A., Bullock, F. W., Chang, C. Y., Conboy, J. E., et al. (1992) · Nuclear Instruments and Methods in Physics Research Section A: Accelerators, Spectrometers, Detectors and Associated Equipment · doi:10.1016/0168-9002(92)90593-s · Cited by 262 · cited 1×
“The applications range from forecasting climate changes [28] via predicting events in a detector in high-energy physics [29] to modeling biological systems [30].”
BackgroundSystems biology: experimental design
Kreutz, C., & Timmer, J. (2009) · The FEBS Journal · doi:10.1111/j.1742-4658.2008.06843.x · Cited by 257 · cited 1×
“based on the Fisher information [27], the presented procedure is very valuable for ODE models which are typically highly nonlinear.”
MethodSelf-citation
Cited by
On structural and practical identifiability
Wieland, F.-G., Hauber, A. L., Rosenblatt, M., Tönsing, C., & Timmer, J. (2021) · Current Opinion in Systems Biology · doi:10.1016/j.coisb.2021.03.005 · Cited by 325
“Similarly, the prediction profile likelihood (Equation (8)) determines the prediction uncertainty of the model at a potential new measurement time point [59] thus promoting the identifiability of the whole model.”
BackgroundSelf-citationLessons Learned from Quantitative Dynamical Modeling in Systems Biology
Raue, A., Schilling, M., Bachmann, J., Matteson, A., Schelke, M., Kaschek, D., Hug, S., Kreutz, C., Harms, B. D., Theis, F. J., et al. (2013) · PLoS ONE · doi:10.1371/journal.pone.0074335 · Cited by 306
“non-observable [27], and subsequent analysis might not be reliable.”
BackgroundSelf-citationData2Dynamics: a modeling environment tailored to parameter estimation in dynamical systems
Raue, A., Steiert, B., Schelker, M., Kreutz, C., Maiwald, T., Hass, H., Vanlier, J., Tönsing, C., Adlung, L., Engesser, R., et al. (2015) · Bioinformatics · doi:10.1093/bioinformatics/btv405 · Cited by 227
“The software was awarded twice as best performer in the Dialogue for Reverse Engineering Assessments and Methods (DREAM, 2011 and 2012).”
MethodSelf-citationComparison of approaches for parameter identifiability analysis of biological systems
Raue, A., Karlsson, J., Saccomani, M. P., Jirstrand, M., & Timmer, J. (2014) · Bioinformatics · doi:10.1093/bioinformatics/btu006 · Cited by 180
“(2010) that the approach facilitates an iterative experimental design strategy and Kreutz et al. (2012) Table 1.”
MethodSelf-citationProfile likelihood in systems biology
Kreutz, C., Raue, A., Kaschek, D., & Timmer, J. (2013) · The FEBS Journal · doi:10.1111/febs.12276 · Cited by 176
“To account for the this effect prediction, the prediction confidence intervals have been generalized in [15,16] for the validation setting.”
BackgroundMethodInfluentialSelf-citation
Metadata
- Authors
- Kreutz, C., Raue, A., & Timmer, J.
- Affiliations
- University of Freiburg (DE)
- Corresponding author
- Kreutz, Clemens
- ORCID
- Kreutz, Clemens
- Venue
- BMC Systems Biology
- Published
- 2012
- Volume
- 6
- Issue
- 1
- Pages
- 120
- ISSN
- 1752-0509 (ISSN-L)
- PMC
- PMC3490710
- OpenAlex
- W2131230954
- Semantic Scholar
- 0f9cbe8c43921560b0e47607dbe3157b9c08b30b
- Cited by
- 134
- References
- 21
- Citations by year
- 2026: 4 · 2025: 19 · 2024: 8 · 2023: 8 · 2022: 12 · 2021: 7 · 2020: 10 · 2019: 13 · 2018: 6 · 2017: 9 · 2016: 8 · 2015: 8 · 2014: 9 · 2013: 9 · 2012: 4
- FWCI
- 3.85
- Type
- journal article
- Language
- en
- Open access
- gold
- doi.org
- Licence
- cc-by
- Locations
- BMC Systems Biology (publishedVersion, cc-by)
- PubMed Central (publishedVersion, cc-by)
- PubMed (publishedVersion)
- arXiv (Cornell University) (submittedVersion)
- DiVA (Linkoping University) (submittedVersion, other-oa)
- DOAJ (DOAJ: Directory of Open Access Journals) (submittedVersion)
- FreiDok plus (Universitätsbibliothek Freiburg) (submittedVersion)
- Site cant be reached (submittedVersion, cc-by)
- OPUS (Augsburg University) (submittedVersion, cc-by)
- arXiv (Cornell University)
- Funders
- Deutsches Krebsforschungszentrum
- Deutsche Forschungsgemeinschaft
- Topics
- Life Sciences › Biochemistry, Genetics and Molecular Biology › Molecular Biology › Gene Regulatory Network Analysis
- Physical Sciences › Engineering › Control and Systems Engineering › Control Systems and Identification
- Life Sciences › Biochemistry, Genetics and Molecular Biology › Molecular Biology › Microbial Metabolic Engineering and Bioproduction
- Keywords
- confidence intervals, observability analysis, parameter uncertainty, dynamic model, biochemical reaction networks, non-identifiable parameters, error propagation, ordinary differential equations, model validation
- MeSH terms
- Models, Biological, Likelihood Functions, Mitogen-Activated Protein Kinases, MAP Kinase Signaling System, Systems Biology
About these checks
Registry, retraction, Cites and statistics results are computed, not judged, with one exception: a printed reference that no index lists is read once by a model before it counts as a citation error. Claims are extracted by a model and kept only when their quote appears verbatim in the text; each cited source is then checked, with a model’s help, for whether it says what the claim relies on. Those verdicts can be wrong — read the claim’s quote and the cited source before relying on one.
The claim verdicts this report counts are experimental: their accuracy is not yet measured.
A language model drew the claims from the paper on 2026-10-05, under version 3 of the claim definition (model deepseek-v4.1-flash, prompt extract-v3).
A second model labelled each claim on 2026-10-05 (model jev-1.13-20260917, definition revision gold-guideline-v0.2).
Cited sources are checked with a language model’s help (qwen3.8-omni-flash).
Statistics and arithmetic are recomputed, not judged.
Confidence bands are shown only for fields calibrated on our annotated test set. None is calibrated yet, so no band is shown.
What counts as a claim ›How we measure confidence ›How we check this ›
Are you an author, or do you see a problem with this page? Request a review
How to cite
Cite CoChat for the checks on this page, and the paper for its own findings.
- This page
- CoChat. (2026). Citation check: Likelihood based observability analysis and confidence intervals for predictions of dynamic models. https://app.cochat.ai/papers/10.1186/1752-0509-6-120
- The paper
- Kreutz, C., Raue, A., & Timmer, J. (2012). Likelihood based observability analysis and confidence intervals for predictions of dynamic models. BMC Systems Biology. https://doi.org/10.1186/1752-0509-6-120
Data sources
Bibliographic data: Semantic Scholar, OpenAlex, Crossref.
Contains information from the Semantic Scholar Academic Graph Datasets, made available under the ODC Attribution License (ODC-BY 1.0).
Semantic Scholar’s data is described in: Kinney, R., et al. (2023). The Semantic Scholar Open Data Platform. arXiv:2301.10140.
