

The DOI matches its Crossref record; 32 of the 32 references it cites were found in a registry or an index.
Batch effect correction for genome-wide methylation data with Illumina Infinium platform
Open accessAbstract
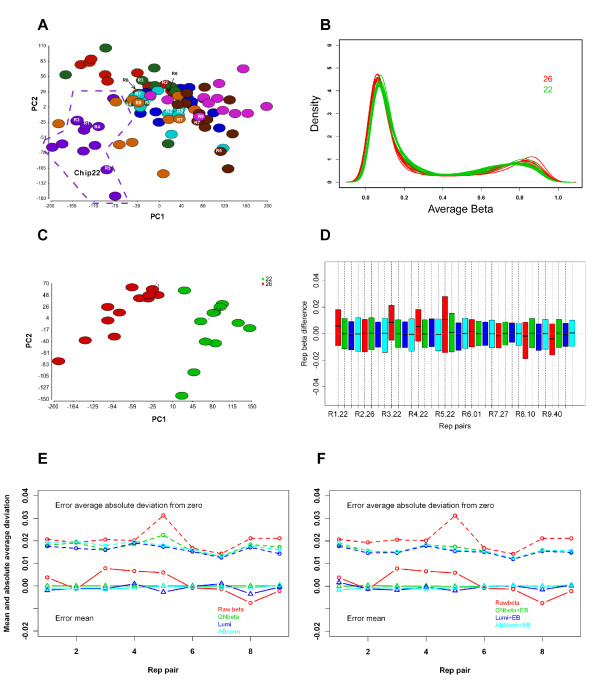
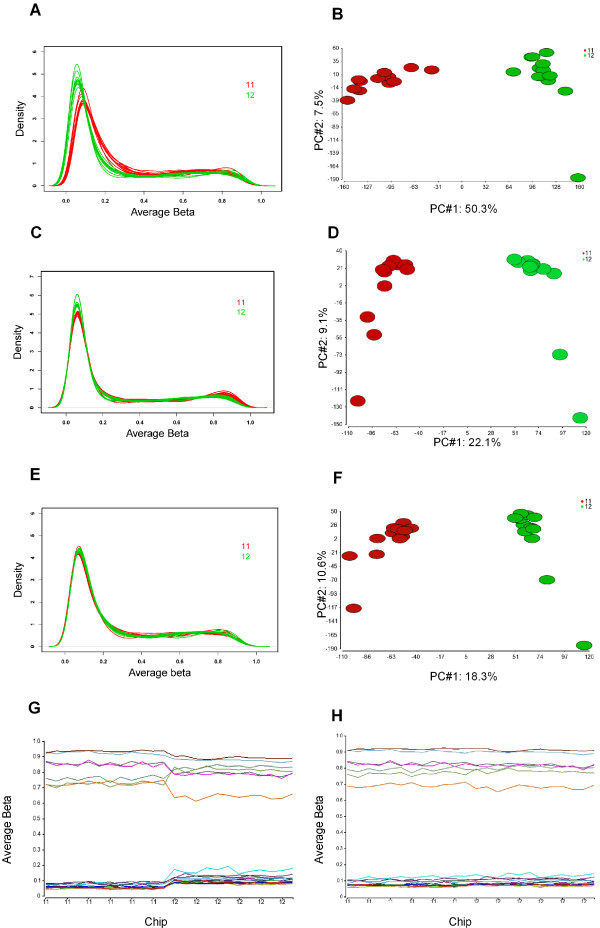
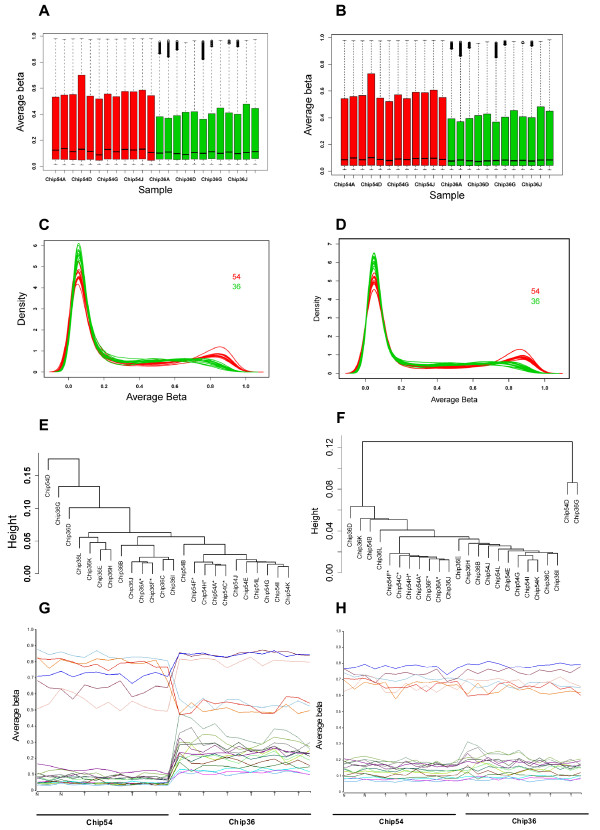
BACKGROUND: Genome-wide methylation profiling has led to more comprehensive insights into gene regulation mechanisms and potential therapeutic targets. Illumina Human Methylation BeadChip is one of the most commonly used genome-wide methylation platforms. Similar to other microarray experiments, methylation data is susceptible to various technical artifacts, particularly batch effects. To date, little attention has been given to issues related to normalization and batch effect correction for this kind of data. METHODS: We evaluated three common normalization approaches and investigated their performance in batch effect removal using three datasets with different degrees of batch effects generated from HumanMethylation27 platform: quantile normalization at average β value (QNβ); two step quantile normalization at probe signals implemented in "lumi" package of R (lumi); and quantile normalization of A and B signal separately (ABnorm). Subsequent Empirical Bayes (EB) batch adjustment was also evaluated. RESULTS: Each normalization could remove a portion of batch effects and their effectiveness differed depending on the severity of batch effects in a dataset. For the dataset with minor batch effects (Dataset 1), normalization alone appeared adequate and "lumi" showed the best performance. However, all methods left substantial batch effects intact in the datasets with obvious batch effects and further correction was necessary. Without any correction, 50 and 66 percent of CpGs were associated with batch effects in Dataset 2 and 3, respectively. After QNβ, lumi or ABnorm, the number of CpGs associated with batch effects were reduced to 24, 32, and 26 percent for Dataset 2; and 37, 46, and 35 percent for Dataset 3, respectively. Additional EB correction effectively removed such remaining non-biological effects. More importantly, the two-step procedure almost tripled the numbers of CpGs associated with the outcome of interest for the two datasets. CONCLUSION: Genome-wide methylation data from Infinium Methylation BeadChip can be susceptible to batch effects with profound impacts on downstream analyses and conclusions. Normalization can reduce part but not all batch effects. EB correction along with normalization is recommended for effective batch effect removal.
Overview
The claims and statistics of this paper haven’t been checked yet.
Run the check — free, no account needed. It reads the open-access text and checks the sources it cites.
Integrity signals
Registry
Cites
Statistics
Figures
Verification
Claims the paper makes
The claims and statistics of this paper haven’t been checked yet.
Run the check — free, no account needed. It reads the open-access text and checks the sources it cites.
Claims other papers make about this one
Each is checked against this paper’s own text: does it say what the citing paper says it does?
The cited source says what the claim attributes to it.
In the citing paper
“the disappearance of batch effects is a useful indicator [12], but not sufficient as a performance indicator because it does not indicate whether true differences can”
From A data-driven approach to preprocessing Illumina 450K methylation array data (2013) · cites this paper as [12]
Self-check
Percentages, sums and reported differences re-computed from the paper’s own numbers.
The self-check needs the paper’s full text.
Citations
Cites
Adjusting batch effects in microarray expression data using empirical Bayes methods
Johnson, W. E., Li, C., & Rabinovic, A. (2007) · Biostatistics · doi:10.1093/biostatistics/kxj037 · Cited by 8,658
Bolstad, B. M., Irizarry, R. A., Åstrand, M., & Speed, T. P. (2003) · Bioinformatics · doi:10.1093/bioinformatics/19.2.185 · Cited by 8,328
Tackling the widespread and critical impact of batch effects in high-throughput data
Leek, J. T., Scharpf, R. B., Bravo, H. C., Simcha, D., Langmead, B., Johnson, W. E., Geman, D., Baggerly, K., & Irizarry, R. A. (2010) · Nature Reviews Genetics · doi:10.1038/nrg2825 · Cited by 2,196
lumi : a pipeline for processing Illumina microarray
Du, P., Kibbe, W. A., & Lin, S. M. (2008) · Bioinformatics · doi:10.1093/bioinformatics/btn224 · Cited by 2,028
Singular value decomposition for genome-wide expression data processing and modeling
Alter, O., Brown, P. O., & Botstein, D. (2000) · Proceedings of the National Academy of Sciences · doi:10.1073/pnas.97.18.10101 · Cited by 1,989
Capturing Heterogeneity in Gene Expression Studies by Surrogate Variable Analysis
Leek, J. T., & Storey, J. D. (2007) · PLoS Genetics · doi:10.1371/journal.pgen.0030161 · Cited by 1,930
Principles and challenges of genome-wide DNA methylation analysis
Laird, P. W. (2010) · Nature Reviews Genetics · doi:10.1038/nrg2732 · Cited by 1,611
The power and the promise of DNA methylation markers
Laird, P. W. (2003) · Nature reviews. Cancer · doi:10.1038/nrc1045 · Cited by 1,573
Impaired hydroxylation of 5-methylcytosine in myeloid cancers with mutant TET2
Ko, M., Huang, Y., Jankowska, A. M., Pape, U. J., Tahiliani, M., Bandukwala, H. S., An, J., Lamperti, E. D., Koh, K. P., Ganetzky, R. D., et al. (2010) · Nature · doi:10.1038/nature09586 · Cited by 1,340
Age-dependent DNA methylation of genes that are suppressed in stem cells is a hallmark of cancer
Teschendorff, A. E., Menon, U., Gentry-Maharaj, A., Ramus, S. J., Weisenberger, D. J., Shen, H., Campan, M., Noushmehr, H., Bell, C. G., Maxwell, A. P., et al. (2010) · Genome Research · doi:10.1101/gr.103606.109 · Cited by 855
Cited by
Sorted by citations
A data-driven approach to preprocessing Illumina 450K methylation array data
Pidsley, R., Y Wong, C. C., Volta, M., Lunnon, K., Mill, J., & Schalkwyk, L. C. (2013) · BMC Genomics · doi:10.1186/1471-2164-14-293 · Cited by 1,143
“A pragmatic approach to the limitations of simple ratiobased methods to calculate DNA methylation values, common in the literature [12], has been to quantile normalize β scores.”
BackgroundMethodInfluentialAccounting for cellular heterogeneity is critical in epigenome-wide association studies
Jaffe, A. E., & Irizarry, R. A. (2014) · Genome Biology · doi:10.1186/gb-2014-15-2-r31 · Cited by 1,067
Touleimat, N., & Tost, J. (2012) · Epigenomics · doi:10.2217/epi.12.21 · Cited by 517
Longitudinal Multi-omics Reveals Subset-Specific Mechanisms Underlying Irritable Bowel Syndrome
Mars, R. A. T., Yang, Y., Ward, T., Houtti, M., Priya, S., Lekatz, H. R., Tang, X., Sun, Z., Kalari, K. R., Korem, T., et al. (2020) · Cell · doi:10.1016/j.cell.2020.08.007 · Cited by 456
“Potential batch effects were corrected by the Combat method (Johnson et al., 2007; Sun et al., 2011).”
Self-citationPrinciples and methods of integrative genomic analyses in cancer
Kristensen, V. N., Lingjærde, O. C., Russnes, H. G., Vollan, H. K. M., Frigessi, A., & Børresen‐Dale, A. (2014) · Nature reviews. Cancer · doi:10.1038/nrc3721 · Cited by 376
Day, K. R., Waite, L. L., Thalacker‐Mercer, A. E., West, A. B., Bamman, M. M., Brooks, J. D., Myers, R., & Absher, D. (2013) · Genome biology · doi:10.1186/gb-2013-14-9-r102 · Cited by 363
Batch effect removal methods for microarray gene expression data integration: a survey
Lazar, C., Meganck, S., Taminau, J., Steenhoff, D., Coletta, A., Molter, C., Weiss-Solis, D. Y., Duque, R., Bersini, H., & Nowe, A. (2013) · Briefings in Bioinformatics · doi:10.1093/bib/bbs037 · Cited by 333
Epigenome-wide differences in pathology-free regions of multiple sclerosis–affected brains
Huynh, J. L., Garg, P., Thin, T. H., Yoo, S., Dutta, R., Trapp, B. D., Haroutunian, V. H., Zhu, J., Donovan, M. J., Sharp, A. J., et al. (2013) · Nature Neuroscience · doi:10.1038/nn.3588 · Cited by 282
Koestler, D. C., Christensen, B. C., Karagas, M. R., Marsit, C. J., Langevin, S. M., Kelsey, K. T., Wiencke, J. K., & Houseman, E. A. (2013) · Epigenetics · doi:10.4161/epi.25430 · Cited by 251
A comprehensive overview of Infinium HumanMethylation450 data processing
Dedeurwaerder, S., Defrance, M., Bizet, M., Calonne, E., Bontempi, G., & Fuks, F. (2013) · Briefings in Bioinformatics · doi:10.1093/bib/bbt054 · Cited by 238
Marabita, F., Almgren, M., Lindholm, M. E., Ruhrmann, S., Fagerström‐Billai, F., Jagodic, M., Sundberg, C. J., Ekström, T. J., Teschendorff, A. E., Tegner, J. N., et al. (2013) · Epigenetics · doi:10.4161/epi.24008 · Cited by 222
Review of processing and analysis methods for DNA methylation array data
Wilhelm-Benartzi, C. S., Koestler, D. C., Karagas, M. R., Flanagan, J. M., Christensen, B. C., Kelsey, K. T., Marsit, C. J., Houseman, E. A., & Brown, R. E. (2013) · British Journal of Cancer · doi:10.1038/bjc.2013.496 · Cited by 210
A cross-package Bioconductor workflow for analysing methylation array data
Maksimovic, J., Phipson, B., & Oshlack, A. (2016) · F1000Research · doi:10.12688/f1000research.8839.3 · Cited by 224
Recent progress, methods and perspectives in forensic epigenetics
Vidaki, A., & Kayser, M. (2018) · Forensic Science International Genetics · doi:10.1016/j.fsigen.2018.08.008 · Cited by 189
Müller, C., Schillert, A., Röthemeier, C., Trégouët, D., Proust, C., Binder, H., Pfeiffer, N., Beutel, M. E., Lackner, K. J., Schnabel, R. B., et al. (2016) · PLoS ONE · doi:10.1371/journal.pone.0156594 · Cited by 155
Using high-density DNA methylation arrays to profile copy number alterations
Feber, A., Guilhamon, P., Lechner, M., Fenton, T. R., Wilson, G. A., Thirlwell, C., Morris, T. J., Flanagan, A. M., Teschendorff, A. E., Kelly, J. D., et al. (2014) · Genome biology · doi:10.1186/gb-2014-15-2-r30 · Cited by 150
Reese, S. E., Archer, K. J., Therneau, T. M., Atkinson, E. J., Vachon, C. M., de Andrade, M., Kocher, J., & Eckel‐Passow, J. E. (2013) · Bioinformatics · doi:10.1093/bioinformatics/btt480 · Cited by 148
Self-citationEpigenetic age signatures in the forensically relevant body fluid of semen: a preliminary study
Lee, H. Y., Jung, S.-E., Oh, Y. N., Choi, A., Yang, W. I., & Shin, K. (2015) · Forensic Science International Genetics · doi:10.1016/j.fsigen.2015.05.014 · Cited by 148
Global Methylation Profiling for Risk Prediction of Prostate Cancer
Mahapatra, S., Klee, E. W., Young, C. Y. F., Sun, Z., Jiménez, R. E., Klee, G. G., Tindall, D. J., & Donkena, K. V. (2012) · Clinical Cancer Research · doi:10.1158/1078-0432.ccr-11-2090 · Cited by 139
Self-citationParker, H. S., Leek, J. T., Favorov, A. V., Considine, M., Xia, X., Chavan, S., Chung, C. H., & Fertig, E. J. (2014) · Bioinformatics · doi:10.1093/bioinformatics/btu375 · Cited by 130
A cross-package Bioconductor workflow for analysing methylation array data
Maksimovic, J., Phipson, B., & Oshlack, A. (2016) · F1000Research · doi:10.12688/f1000research.8839.1 · Cited by 115
Epigenetics in eating disorders: a systematic review
Hübel, C., Marzi, S. J., Breen, G., & Bulik, C. M. (2019) · Molecular Psychiatry · doi:10.1038/s41380-018-0254-7 · Cited by 116
Sun, Z., Cunningham, J. M., Slager, S. L., & Kocher, J. (2015) · Epigenomics · doi:10.2217/epi.15.21 · Cited by 119
Self-citationVisualization of SNPs with t-SNE
Platzer, A. (2013) · PLoS ONE · doi:10.1371/journal.pone.0056883 · Cited by 111
Maksimovic, J., Gagnon-Bartsch, J. A., Speed, T. P., & Oshlack, A. (2015) · Nucleic Acids Research · doi:10.1093/nar/gkv526 · Cited by 90
Bose, M., Wu, C., Pankow, J. S., Demerath, E. W., Bressler, J., Fornage, M., Grove, M. L., Mosley, T. H., Hicks, C., North, K., et al. (2014) · BMC Bioinformatics · doi:10.1186/1471-2105-15-312 · Cited by 86
Matosin, N., Cruceanu, C., & Binder, E. B. (2017) · Chronic Stress · doi:10.1177/2470547017710764 · Cited by 92
Pan, H., Chen, L., Dogra, S. K., Teh, A. L., Tan, J. H., Lim, I. Y., Lim, Y. C., Jin, S., Lee, Y. K., Ng, P. Y., et al. (2012) · Epigenetics · doi:10.4161/epi.22102 · Cited by 79
Harper, K. N., Peters, B. A., & Gamble, M. V. (2013) · Cancer Epidemiology Biomarkers & Prevention · doi:10.1158/1055-9965.epi-13-0114 · Cited by 77
An overview of DNA methylation-derived trait score methods and applications
Nabais, M. F., Gadd, D. A., Hannon, E. J., Mill, J. S., McRae, A. F., & Wray, N. R. (2023) · Genome biology · doi:10.1186/s13059-023-02855-7 · Cited by 75
Beach, S. R. H., Lei, M., Brody, G. H., Dogan, M. V., & Philibert, R. A. (2015) · Frontiers in Psychology · doi:10.3389/fpsyg.2015.00676 · Cited by 72
Habano, W., Kawamura, K., Iizuka, N., Terashima, J., Sugai, T., & Ozawa, S. (2015) · Clinical Epigenetics · doi:10.1186/s13148-015-0136-7 · Cited by 66
Buhule, O. D., Minster, R. L., Hawley, N. L., Medvedovic, M., Sun, G., Viali, S., Deka, R., McGarvey, S. T., & Weeks, D. E. (2014) · Frontiers in Genetics · doi:10.3389/fgene.2014.00354 · Cited by 54
Identification of DNA methylation biomarkers from Infinium arrays
Wessely, F., & Emes, R. D. (2012) · Frontiers in Genetics · doi:10.3389/fgene.2012.00161 · Cited by 52
Curtis, S. W., Cobb, D. O., Kilaru, V., Terrell, M. L., Kennedy, E. M., Marder, M. E., Barr, D. B., Marsit, C. J., Marcus, M., Conneely, K. N., et al. (2019) · Epigenetics · doi:10.1080/15592294.2019.1565590 · Cited by 51
Everson, T. M., & Marsit, C. J. (2018) · Current Environmental Health Reports · doi:10.1007/s40572-018-0204-1 · Cited by 43
Zheleznyakova, G. Y., Voisin, S. A. C., Kiselev, A., Almén, M. S., Xavier, M. J., Maretina, M. A., Tishchenko, L. I., Fredriksson, R., Баранов, В. С., & Schiöth, H. B. (2013) · European Journal of Human Genetics · doi:10.1038/ejhg.2012.293 · Cited by 41
Positional Effects Revealed in Illumina Methylation Array and The Impact on Analysis
Jiao, C., Zhang, C., Dai, R., Xia, Y., Wang, K., Giase, G. M., Chen, C., & Liu, C. (2018) · Epigenomics · doi:10.2217/epi-2017-0105 · Cited by 39
Suvakov, S., Ghamrawi, R., Cubro, H., Tu, H., White, W. M., Tobah, Y. S. B., Milic, N. M., Grande, J. P., Cunningham, J. M., Chebib, F. T., et al. (2021) · EBioMedicine · doi:10.1016/j.ebiom.2021.103536 · Cited by 38
Self-citationKawai, T., Yamada, T., Abe, K., Okamura, K., Kamura, H., Akaishi, R., Minakami, H., Nakabayashi, K., & Hata, K. (2015) · Scientific Reports · doi:10.1038/srep14224 · Cited by 37
Odintsova, V. V., Willemsen, G. A. H. M., Dolan, C. V., Hottenga, J., Martin, N. G., Slagboom, P. E., Ordoñana, J. R., & Boomsma, D. I. (2018) · Twin Research and Human Genetics · doi:10.1017/thg.2018.23 · Cited by 34
White, W., Brost, B. C., Sun, Z., Rose, C. H., Craici, I. M., Wagner, S. J., Turner, S. T., & Garovic, V. D. (2013) · Hypertension in Pregnancy · doi:10.3109/10641955.2013.796970 · Cited by 35
Self-citationBEclear: Batch Effect Detection and Adjustment in DNA Methylation Data
Akulenko, R., Merl, M., & Helms, V. (2016) · PLoS ONE · doi:10.1371/journal.pone.0159921 · Cited by 34
Alsaleh, H., & Haddrill, P. R. (2019) · Forensic Science International · doi:10.1016/j.forsciint.2019.109944 · Cited by 37
A pooling-based approach to mapping genetic variants associated with DNA methylationPreprint
Kaplow, I. M., MacIsaac, J. L., Mah, S. M., McEwen, L. M., Kobor, M. S., & Fraser, H. B. (2015) · Genome Research · doi:10.1101/gr.183749.114 · Cited by 38
Intraindividual Variation and Short-term Temporal Trend in DNA Methylation of Human Blood
Shvetsov, Y. B., Song, M., Cai, Q., Tiirikainen, M., Xiang, Y., Shu, X., & Yu, H. (2014) · Cancer Epidemiology Biomarkers & Prevention · doi:10.1158/1055-9965.epi-14-0853 · Cited by 31
Medina, D. A., Li, T., Pamela Thomson, M., Artacho, A., Pérez‐Brocal, V., & Moyá, A. (2019) · Frontiers in Microbiology · doi:10.3389/fmicb.2019.02346 · Cited by 33
Model-based clustering with data correction for removing artifacts in gene expression data
Young, W. C., Raftery, A. E., & Yeung, K. Y. (2017) · The Annals of Applied Statistics · doi:10.1214/17-aoas1051 · Cited by 32
Comparison of pre-processing methods for Infinium HumanMethylation450 BeadChip array
Shiah, Y.-J., Fraser, M. E., Bristow, R. G., & Boutros, P. C. (2017) · Bioinformatics · doi:10.1093/bioinformatics/btx372 · Cited by 30
The methylation of SDC2 and TFPI2 defined three methylator phenotypes of colorectal cancer
Lei, R., Zhao, Y., Huang, K., Wang, Q., Wan, K., Li, T., Yang, H., & Lv, X. (2022) · BMC Gastroenterology · doi:10.1186/s12876-022-02175-3 · Cited by 29
Measuring epigenetics as the mediator of gene/environment interactions in DOHaD
Ong, M., Lin, X., & Holbrook, J. D. (2014) · Journal of Developmental Origins of Health and Disease · doi:10.1017/s2040174414000506 · Cited by 30
TRH site-specific methylation in oral and oropharyngeal squamous cell carcinoma
Puttipanyalears, C., Arayataweegool, A., Chalertpet, K., Rattanachayoto, P., Mahattanasakul, P., Tangjaturonsasme, N., Kerekhanjanarong, V., Mutirangura, A., & Kitkumthorn, N. (2018) · BMC Cancer · doi:10.1186/s12885-018-4706-x · Cited by 27
Papiez, A., Marczyk, M., Polanska, J., & Polanski, A. (2019) · Bioinformatics · doi:10.1093/bioinformatics/bty900 · Cited by 26
Wang, Y., Zhang, J., Xiao, X., Liu, H., Wang, F., Li, S., Wen, Y., Wei, Y., Su, J., Zhang, Y., et al. (2016) · Scientific Reports · doi:10.1038/srep22722 · Cited by 27
Shiwa, Y., Hachiya, T., Furukawa, R., Ohmomo, H., Ono, K., Kudo, H., Hata, J., Hozawa, A., Iwasaki, M., Matsuda, K., et al. (2016) · PLoS ONE · doi:10.1371/journal.pone.0147519 · Cited by 25
16S rRNA Gene Sequencing Reveals Specific Gut Microbes Common to Medicinal Insects
Geng, J., Sui, Z., Dou, W., Miao, Y., Wang, T., Wei, X., Chen, S., Zhang, Z., Xiao, J., & Huang, D. (2022) · Frontiers in Microbiology · doi:10.3389/fmicb.2022.892767 · Cited by 26
Aref‐Eshghi, E., Abadi, A., Farhadieh, M., Hooshmand, A., Ghasemi, F., Youssefian, L., Vahidnezhad, H., Kerrins, T. M., Zhao, X., Akbarzadeh, M., et al. (2025) · Clinical Epigenetics · doi:10.1186/s13148-025-01967-0 · Cited by 26
Methylation of the genes ROD1, NLRC5, and HKR1 is associated with aging in Hainan centenarians
Zeng, Q., Chen, X., Ning, C., Zhu, Q. L., Yao, Y., Zhao, Y., & Luan, F. (2018) · BMC Medical Genomics · doi:10.1186/s12920-018-0334-1 · Cited by 24
Curtis, S. W., Cobb, D. O., Kilaru, V., Terrell, M. L., Marder, M. E., Barr, D. B., Marsit, C. J., Marcus, M., Conneely, K. N., & Smith, A. K. (2019) · Aging · doi:10.18632/aging.102134 · Cited by 23
White, W., Brost, B. C., Sun, Z., Rose, C. H., Craici, I. M., Wagner, S. J., Turner, S. T., & Garovic, V. D. (2012) · Epigenetics · doi:10.4161/epi.20388 · Cited by 23
Self-citationBeach, S. R. H., Lei, M., Ong, M. L., Brody, G. H., Dogan, M. V., & Philibert, R. A. (2017) · American Journal of Medical Genetics Part B Neuropsychiatric Genetics · doi:10.1002/ajmg.b.32544 · Cited by 21
White, W., Sun, Z., Borowski, K. S., Brost, B. C., Davies, N. P., Rose, C. H., & Garovic, V. D. (2016) · Hypertension in Pregnancy · doi:10.3109/10641955.2016.1162315 · Cited by 19
Self-citationLi, Y., Tu, M., Feng, Y., Wang, W., & Messing, J. W. (2019) · Biotechnology for Biofuels · doi:10.1186/s13068-019-1612-7 · Cited by 19
Cazaly, E., Thomson, R. J., Marthick, J. R., Holloway, A. F., Charlesworth, J., & Dickinson, J. L. (2016) · Clinical Epigenetics · doi:10.1186/s13148-016-0241-2 · Cited by 18
Behrens, T., Bonberg, N., Casjens, S., Pesch, B., & Brüning, T. (2013) · Biochimica et Biophysica Acta (BBA) - Proteins and Proteomics · doi:10.1016/j.bbapap.2013.07.018 · Cited by 18
Curtis, S. W., Cobb, D. O., Kilaru, V., Terrell, M. L., Marder, M. E., Barr, D. B., Marsit, C. J., Marcus, M., Conneely, K. N., & Smith, A. K. (2019) · Epigenetics · doi:10.1080/15592294.2019.1629232 · Cited by 17
Analysis of methylation microarray for tissue specific detection
Muangsub, T., Samsuwan, J., Tongyoo, P., Kitkumthorn, N., & Mutirangura, A. (2014) · Gene · doi:10.1016/j.gene.2014.09.060 · Cited by 17
Wang, D., Zhang, Y., Huang, Y., Li, P., Wang, M., Wu, R., Cheng, L., Zhang, W., Zhang, Y., Li, B., et al. (2012) · Gene · doi:10.1016/j.gene.2012.06.075 · Cited by 15
Beach, S. R. H., Brody, G. H., Barton, A. W., & Philibert, R. A. (2016) · Development and Psychopathology · doi:10.1017/s0954579416000882 · Cited by 14
O’Mahony, F. C., Nanda, J., Laird, A., Mullen, P., Caldwell, H., Overton, I. M., Eöry, L., O’Donnell, M., Faratian, D., Powles, T. B., et al. (2013) · Journal of Visualized Experiments · doi:10.3791/50221 · Cited by 11
Liu, J., Shen, H., Hu, J., Shen, X., Zhang, Q., Yang, Y., Yang, M., Wang, W., Li, Y., Zhang, Q., et al. (2024) · Molecular Oncology · doi:10.1002/1878-0261.13745 · Cited by 12
Statistical strategies for microRNAseq batch effect reduction.
Guo, Y. P., Zhao, S., Su, P.-F., Li, C.-I., Ye, F., Flynn, C. R., & Shyr, Y. (2014) · PubMed · doi:10.3978/j.issn.2218-676x.2014.06.05 · Cited by 10
Beach, S. R. H., Lei, M., Brody, G. H., Miller, G. E., Chen, E., Mandara, J., & Philibert, R. A. (2016) · Development and Psychopathology · doi:10.1017/s0954579416000961 · Cited by 11
A novel CpG island methylation panel predicts survival in lung adenocarcinomas
Yan, P., Yang, X., Wang, J., Wang, S., & Ren, H. (2019) · Oncology Letters · doi:10.3892/ol.2019.10431 · Cited by 9
Giordano, A., Pignolet, B., Mascia, E., Clarelli, F., Sorosina, M., Misra, K., Bucciarelli, F., Ferrè, L., Moiola, L., Liblau, R., et al. (2024) · Annals of Neurology · doi:10.1002/ana.26959 · Cited by 9
Xia, Q., Thompson, J. A., & Koestler, D. C. (2021) · Statistical Applications in Genetics and Molecular Biology · doi:10.1515/sagmb-2021-0020 · Cited by 8
Evaluation of different computational methods for DNA methylation-based biological age
Lena, P. D., Sala, C., & Nardini, C. (2022) · Briefings in Bioinformatics · doi:10.1093/bib/bbac274 · Cited by 10
Molecular Techniques for DNA Methylation Studies
Tost, J., & Gut, I. G. (2016) · Elsevier eBooks · doi:10.1016/b978-0-12-802971-8.00007-9 · Cited by 9
Scars of childhood socioeconomic stress: A systematic review
Wood, N. M., Trebilco, T., & Cohen‐Woods, S. (2020) · Neuroscience & Biobehavioral Reviews · doi:10.1016/j.neubiorev.2020.08.001 · Cited by 7
Wang, Y., Zhao, Y., & Pan, Q. (2021) · Briefings in Bioinformatics · doi:10.1093/bib/bbab406 · Cited by 7
Valavanis, I. K., Sifakis, E. G., Georgiadis, P., Kyrtopoulos, S. Α., & Chatziioannou, A. A. (2014) · IEEE Journal of Biomedical and Health Informatics · doi:10.1109/jbhi.2014.2298351 · Cited by 7
Zhang, Y., & Zhang, J. (2015) · Molecular BioSystems · doi:10.1039/c5mb00141b · Cited by 7
Oliveira, D. V. N. P., Biskup, E., O’Rourke, C. J., Hentze, J. L., Andersen, J. B., Høgdall, C. K., & Høgdall, E. V. S. (2024) · Molecular Diagnosis & Therapy · doi:10.1007/s40291-024-00740-y · Cited by 6
Zhang, Y., Zhang, J., & Shang, J. (2013) · Epigenomics · doi:10.2217/epi.13.58 · Cited by 6
Pancreatic cancer differential methylation atlas in blood, peri-carcinomatous and diseased tissue
Wang, H., Yin, F., Yuan, F., Men, Y., Deng, M., Liu, Y., & Li, Q. (2020) · Translational Cancer Research · doi:10.21037/tcr.2019.11.26 · Cited by 4
Bibikova, M. V. (2015) · Elsevier eBooks · doi:10.1016/b978-0-12-800140-0.00002-9 · Cited by 6
RareNet: a deep learning model for rare cancer diagnosis
Shao, D., Addagudi, S., Cowles, J., Jain, A., D'Souza, L., Gore, S., & Azad, R. K. (2025) · Scientific Reports · doi:10.1038/s41598-025-08829-y · Cited by 5
Mitchell, N. E., Wilson, M. L., Bray, M. S., Crossman, D. K., & Tollefsbol, T. O. (2013) · Epigenomics · doi:10.2217/epi.13.6 · Cited by 4
Nakabayashi, K. (2019) · Springer eBooks · doi:10.1007/978-3-319-55530-0_89 · Cited by 3
Nandy, D., Yang, X., Jin, X., Griffin, L. R., Kechris, K. J., & Xing, F. (2022) · F1000Research · doi:10.12688/f1000research.117334.1 · Cited by 2
Introduction to Data Types in Epigenomics
Marabita, F., Tegner, J. N., & Gómez-Cabrero, D. (2015) · Translational bioinformatics · doi:10.1007/978-94-017-9927-0_1 · Cited by 2
Statistical Methods for Methylation Data
Horgan, G. W., & Chua, S.-P. (2015) · Methods in molecular biology · doi:10.1007/7651_2015_316 · Cited by 2
Identifying the Correlation between Alzheimer and type 2 Diabetes
Francese, R., Frasca, M., Risi, M., & Tortora, G. (2022) · International Conference on Information Visualisation (IV) · doi:10.1109/iv56949.2022.00073 · Cited by 2
Detecting and Correcting Batch Effects in High-Throughput Genomic Experiments
Reese, S. E. (2013) · VCU Scholars Compass (Virginia Commonwealth University) · doi:10.25772/a7n4-6136 · Cited by 2
Analysis of DNA methylation epidemiological data through a generic composite statistical framework
Valavanis, I. K., Sifakis, E. G., Georgiadis, P., Kyrtopoulos, S. Α., & Chatziioannou, A. A. (2012) · IEEE International Conference on Bioinformatics and Bioengineering (BIBE) · doi:10.1109/bibe.2012.6399775 · Cited by 1
Functional Analysis of Autism Candidate Genes Based on Comparative Genomics Analysis
Gong, L., Sun, S., Zhang, C., Gao, Z., Pan, C., Zhang, Z., Huang, D., & Yang, G. (2018) · Lecture notes in computer science · doi:10.1007/978-3-319-95930-6_55 · Cited by 1
Clinical Epigenetics and Epigenomics
Qiu, C., Yu, F., Deng, H., & Shen, H. (2016) · Translational bioinformatics · doi:10.1007/978-94-017-7543-4_10 · Cited by 1
Deep learning identifies erroneous microarray-based, gene-level conclusions in literature
Qin, Y., Yi, D., Chen, X., & Guan, Y. (2021) · NAR Genomics and Bioinformatics · doi:10.1093/nargab/lqab089 · Cited by 1
Discovery of problematic probes in illumina DNA methylation microarrays
Chen, Y. A. (2015) · TSpace (University of Toronto)
Metadata
- Authors
- Sun, Z., Chai, H. S., Wu, Y., White, W. M., Donkena, K. V., Klein, C. J., Garovic, V. D., Therneau, T. M., & Kocher, J.-P. A.
- Affiliations
- Mayo Clinic (US)
- Corresponding author
- Kocher, Jean-Pierre A
- ORCID
- Venue
- BMC Medical Genomics
- Published
- 2011-12
- Volume
- 4
- Issue
- 1
- Pages
- 84-84
- ISSN
- 1755-8794 (ISSN-L)
- PMC
- PMC3265417
- OpenAlex
- W2108947463
- Cited by
- 108
- References
- 32
- Citations by year
- 2026: 1 · 2025: 2 · 2024: 4 · 2023: 1 · 2022: 6 · 2021: 4 · 2020: 3 · 2019: 9 · 2018: 9 · 2017: 6 · 2016: 13 · 2015: 13 · 2014: 11 · 2013: 17 · 2012: 9
- FWCI
- 4.81
- Type
- journal article
- Language
- en
- Open access
- gold
- doi.org
- Licence
- Locations
- BMC Medical Genomics (publishedVersion, cc-by)
- PubMed Central (publishedVersion, cc-by)
- PubMed (publishedVersion)
- DOAJ (DOAJ: Directory of Open Access Journals) (submittedVersion, cc-by-sa)
- Funders
- Mayo Clinic
- Mayo Foundation for Medical Education and Research
- Center for Individualized Medicine, Mayo Clinic
- Topics
- Life Sciences › Biochemistry, Genetics and Molecular Biology › Molecular Biology › Epigenetics and DNA Methylation
- Life Sciences › Biochemistry, Genetics and Molecular Biology › Molecular Biology › Gene expression and cancer classification
- Life Sciences › Biochemistry, Genetics and Molecular Biology › Molecular Biology › Genomics and Phylogenetic Studies
- Keywords
- batch effect correction, DNA methylation, genome-wide methylation profiling, quantile normalization, data normalization, CpG methylation
- MeSH terms
- Adult, Humans, Male, Reproducibility of Results, Genome, Human, CpG Islands, DNA Methylation, Oligonucleotide Array Sequence Analysis, Databases, Genetic
About these checks
Registry, retraction, Cites and statistics results are computed, not judged, with one exception: a printed reference that no index lists is read once by a model before it counts as a citation error. Claims are extracted by a model and kept only when their quote appears verbatim in the text; each cited source is then checked, with a model’s help, for whether it says what the claim relies on. Those verdicts can be wrong — read the claim’s quote and the cited source before relying on one.
Statistics and arithmetic are recomputed, not judged.
Confidence bands are shown only for fields calibrated on our annotated test set. None is calibrated yet, so no band is shown.
What counts as a claim ›How we measure confidence ›How we check this ›
Are you an author, or do you see a problem with this page? Request a review
