

The DOI matches its Crossref record; 36 of the 36 references it cites were found in a registry or an index.
Autophagy activation and enhanced mitophagy characterize the Purkinje cells of pcd mice prior to neuronal death
Open accessAbstract
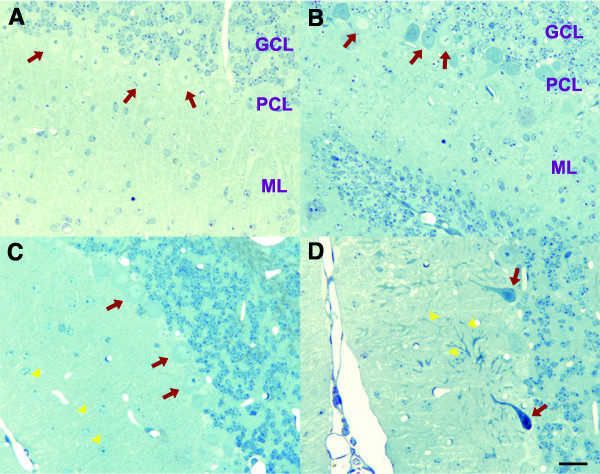
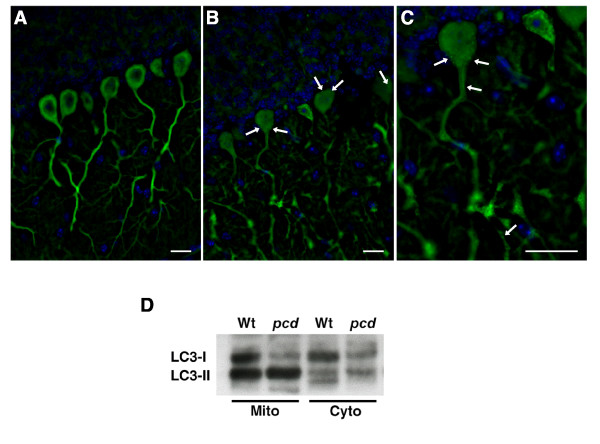
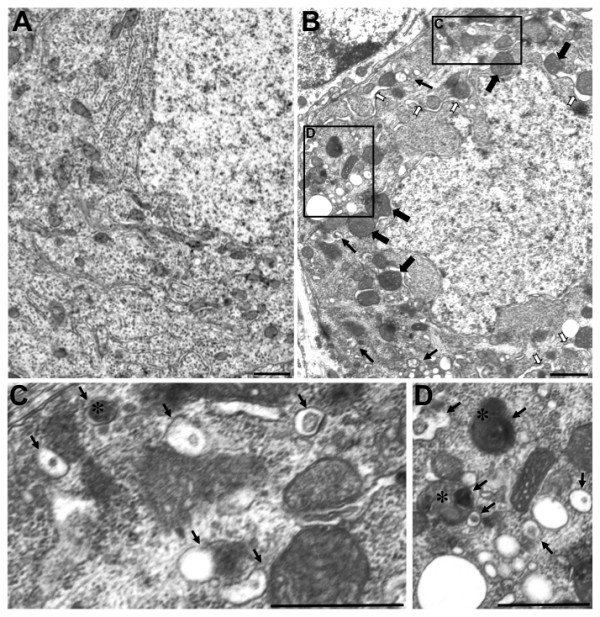
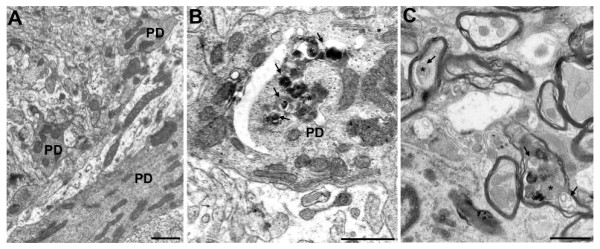
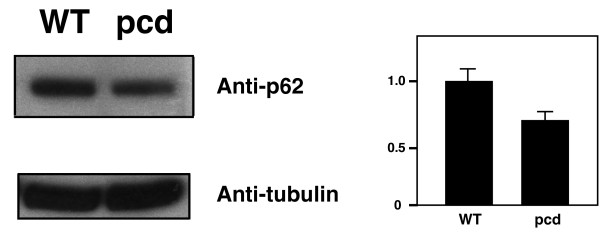
Purkinje cells are a class of specialized neurons in the cerebellum, and are among the most metabolically active of all neurons, as they receive immense synaptic stimulation, and provide the only efferent output from the cerebellum. Degeneration of Purkinje cells is a common feature of inherited ataxias in humans and mice. To understand Purkinje neuron degeneration, investigators have turned to naturally occurring Purkinje cell degeneration phenotypes in mice to identify key regulatory proteins and cellular pathways. The Purkinje cell degeneration (pcd) mouse is a recessive mutant characterized by complete and dramatic post-natal, cell autonomous Purkinje neuron degeneration and death. As the basis of Purkinje cell death in pcd is unresolved, and contradictory data has emerged for the role of autophagy in Purkinje cell degeneration, we studied the mechanism of Purkinje cell death in pcd mice. BAX null status did not suppress Purkinje neuron death in pcd mice, indicating that classic apoptosis is not responsible for Purkinje cell loss. Interestingly, LC3 Western blot analysis and GFP-LC3 immunostaining of degenerating pcd cerebellum revealed activation of the autophagy pathway. Ultrastructural studies confirmed increased autophagy pathway activity in Purkinje cells, and yielded evidence for mitophagy, in agreement with LC3 immunoblotting of cerebellar fractions. As p62 levels were decreased in pcd cerebellum, our findings suggest that pcd Purkinje cell neurons can execute effective autophagy. However, our results support a role for dysregulated autophagy activation in pcd, and suggest that increased or aberrant mitophagy contributes to the Purkinje cell degeneration in pcd mice.
Overview
The claims and statistics of this paper haven’t been checked yet.
Run the check — free, no account needed. It reads the open-access text and checks the sources it cites.
Integrity signals
Registry
Cites
Statistics
Figures
Verification
Claims the paper makes
The claims and statistics of this paper haven’t been checked yet.
Run the check — free, no account needed. It reads the open-access text and checks the sources it cites.
Claims other papers make about this one
Each is checked against this paper’s own text: does it say what the citing paper says it does?
The cited source says what the claim attributes to it.
In the citing paper
“Purkinje cell degeneration models such as pcd mice display motor abnormalities that were similar to those observed in B6.Clec16aGT/GT and Clec16aCURT/CURT mice3031 and staining with the Purkinje cell marker calbindin confirmed loss of these cells in B6.Clec16aGT/GT mice (Fig. 2d) at 8 weeks of age that was dramatically increased by 47 weeks of age (Supplementary Fig. 2e).”
From Clec16a is Critical for Autolysosome Function and Purkinje Cell Survival (2016) · cites this paper as [30]
Self-check
Percentages, sums and reported differences re-computed from the paper’s own numbers.
The self-check needs the paper’s full text.
Citations
Cites
Autophagy in the Pathogenesis of Disease
Levine, B., & Kroemer, G. (2008) · Cell · doi:10.1016/j.cell.2007.12.018 · Cited by 7,069
LC3, a mammalian homologue of yeast Apg8p, is localized in autophagosome membranes after processing.
Kabeya, Y., Mizushima, N., Ueno, T., Yamamoto, A., Kirisako, T., Noda, T., Kominami, E., Ohsumi, Y., & Yoshimori, T. (2000) · The EMBO Journal · doi:10.1093/emboj/19.21.5720 · Cited by 6,605
Suppression of basal autophagy in neural cells causes neurodegenerative disease in mice
Hara, T., Nakamura, K., Matsui, M., Yamamoto, A., Nakahara, Y., Suzuki-Migishima, R., Yokoyama, M., Mishima, K., Saito, I., Okano, H., et al. (2006) · Nature · doi:10.1038/nature04724 · Cited by 3,882
Loss of autophagy in the central nervous system causes neurodegeneration in mice
Komatsu, M., Waguri, S., Chiba, T., Murata, S., Iwata, J.-I., Tanida, I., Ueno, T., Koike, M., Uchiyama, Y., Kominami, E., et al. (2006) · Nature · doi:10.1038/nature04723 · Cited by 3,500
Autophagy in Health and Disease: A Double-Edged Sword
Shintani, T., & Klionsky, D. J. (2004) · Science · doi:10.1126/science.1099993 · Cited by 2,559
Mizushima, N., Yamamoto, A., Matsui, M., Yoshimori, T., & Ohsumi, Y. (2004) · Molecular Biology of the Cell · doi:10.1091/mbc.e03-09-0704 · Cited by 2,105
Extensive Involvement of Autophagy in Alzheimer Disease: An Immuno-Electron Microscopy Study
Nixon, R. A., Wegiel, J., Kumar, A., Yu, W. H., Peterhoff, C., Cataldo, A., & Cuervo, A. M. (2005) · Journal of Neuropathology & Experimental Neurology · doi:10.1093/jnen/64.2.113 · Cited by 1,588
Selective degradation of mitochondria by mitophagy
Kim, I., Rodriguez-Enriquez, S., & Lemasters, J. J. (2007) · Archives of Biochemistry and Biophysics · doi:10.1016/j.abb.2007.03.034 · Cited by 1,558
Regulation of an ATG7 - beclin 1 Program of Autophagic Cell Death by Caspase-8
Yu, L., Alva, A. S., Su, H. C., Dutt, P., Freundt, E. C., Welsh, S. J., Baehrecke, E. H., & Lenardo, M. J. (2004) · Science · doi:10.1126/science.1096645 · Cited by 1,249
Autophagy: dual roles in life and death?
Baehrecke, E. H. (2005) · Nature Reviews Molecular Cell Biology · doi:10.1038/nrm1666 · Cited by 986
Cited by
Sorted by citations
Items 101–112 of 112
Differential Simple Spike Activity in Alert Mice
Zhou, H. (2014) · EUR Research Repository (Erasmus University Rotterdam)
Nahm, S., Yoo, J. E., & Abbott, L. C. (2010) · Laboratory Animal Research · doi:10.5625/lar.2010.26.3.301
Structural modeling and functional characterization of mammalian cytosolic carboxypeptidases 2 and 3
Tort, O. (2014) · TDX (Tesis Doctorals en Xarxa)
Akita, K. (2021) · Springer eBooks · doi:10.1007/978-3-030-23810-0_69
Akita, K. (2020) · Springer eBooks · doi:10.1007/978-3-319-97911-3_69-2
Akita, K. (2012) · Springer eBooks · doi:10.1007/978-94-007-1333-8_69
Pérez-Revuelta, L. (2023) · Gredos (University of Salamanca) · doi:10.14201/gredos.153257
Miterko, L. N., Peacoe, L. E., Duraine, L., Zuo, Z., & Sillitoe, R. V. (2025) · Brain Research Bulletin · doi:10.1016/j.brainresbull.2025.111704
Duloxetine ameliorates cerebral ischemic injury by inhibiting autophagy
Viotti, A., Molinaro, C., Perego, J., Fossaghi, A., Parravicini, C., Lauranzano, E., Borreca, A., Piccoli, M., Anastasia, L., Manenti, S., et al. (2026) · Autophagy · doi:10.1080/15548627.2026.2641616
Mort développementale des cellules de Purkinje
Rakotomamonjy, J. (2011) · theses.fr (ABES) · doi:10.70675/88d4b677za92bz4d15z8b1bz6fd01474f902
Target and small molecule discovery for therapeutic innovation in cardiovascular area
Liu, D. (2019) · theses.fr (ABES) · doi:10.70675/da9fa152zdcc0z498dz9194z563d22d0b77c
Metadata
- Authors
- Chakrabarti, L., Eng, J., Ivanov, N., Garden, G. A., & La Spada, A. R.
- Affiliations
- University of Washington (US)
- Venue
- Molecular Brain
- Published
- 2009-07-29
- Volume
- 2
- Issue
- 1
- Pages
- 24-24
- ISSN
- 1756-6606 (ISSN-L)
- PMC
- PMC2729476
- OpenAlex
- W2028695079
- Cited by
- 112
- References
- 36
- Citations by year
- 2026: 2 · 2025: 4 · 2024: 7 · 2023: 5 · 2022: 1 · 2021: 4 · 2020: 8 · 2019: 5 · 2018: 7 · 2017: 1 · 2016: 15 · 2015: 5 · 2014: 13 · 2013: 13 · 2012: 10
- FWCI
- 4.95
- Type
- journal article
- Language
- en
- Open access
- gold
- doi.org
- Licence
- cc-by
- Locations
- Molecular Brain (publishedVersion, cc-by)
- PubMed Central (publishedVersion, cc-by)
- PubMed (publishedVersion)
- DOAJ (DOAJ: Directory of Open Access Journals) (submittedVersion, cc-by-sa)
- Funders
- National Institutes of Health (EY-01730, HD02274)
- Intellectual and Developmental Disabilities Research Center
- National Eye Institute (EY 18106, EY-01730, R01EY014997, R21EY018106, P30EY001730, EY 14997)
- National Institute of Neurological Disorders and Stroke (R01NS052535)
- Eunice Kennedy Shriver National Institute of Child Health and Human Development (P30HD02274, P30HD002274)
- Topics
- Life Sciences › Biochemistry, Genetics and Molecular Biology › Cell Biology › Autophagy in Disease and Therapy
- Life Sciences › Neuroscience › Cellular and Molecular Neuroscience › Genetic Neurodegenerative Diseases
- Life Sciences › Biochemistry, Genetics and Molecular Biology › Molecular Biology › Cell death mechanisms and regulation
- Keywords
- Purkinje cells, Purkinje cell degeneration, autophagy, mitophagy, neuronal cell death, Bax, apoptosis, LC3, p62, cerebellum, hereditary ataxia, neurodegeneration
- MeSH terms
- Animals, Ataxia, Autophagy, Dendrites, Endoplasmic Reticulum, Mice, Neurologic Mutants, Mitochondria, Nerve Degeneration, Phagosomes, Phenotype, Purkinje Cells, bcl-2-Associated X Protein, Mice
About these checks
Registry, retraction, Cites and statistics results are computed, not judged, with one exception: a printed reference that no index lists is read once by a model before it counts as a citation error. Claims are extracted by a model and kept only when their quote appears verbatim in the text; each cited source is then checked, with a model’s help, for whether it says what the claim relies on. Those verdicts can be wrong — read the claim’s quote and the cited source before relying on one.
Statistics and arithmetic are recomputed, not judged.
Confidence bands are shown only for fields calibrated on our annotated test set. None is calibrated yet, so no band is shown.
What counts as a claim ›How we measure confidence ›How we check this ›
Are you an author, or do you see a problem with this page? Request a review
