

The DOI matches its Crossref record; 34 of the 34 references it cites were found in a registry or an index.
Improving IQ measurement in intellectual disabilities using true deviation from population norms
Open accessAbstract
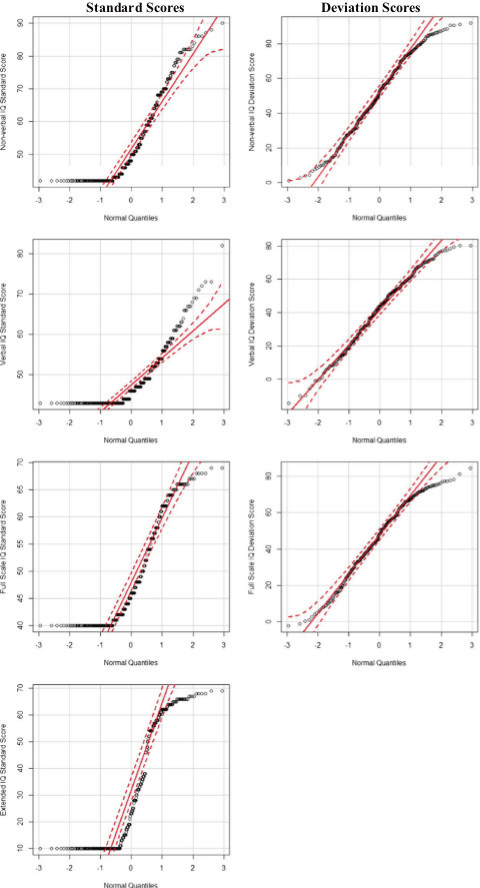
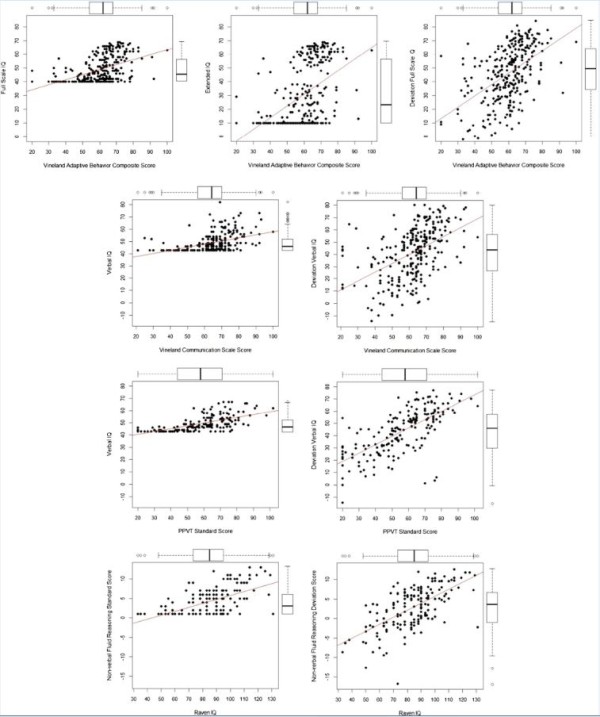
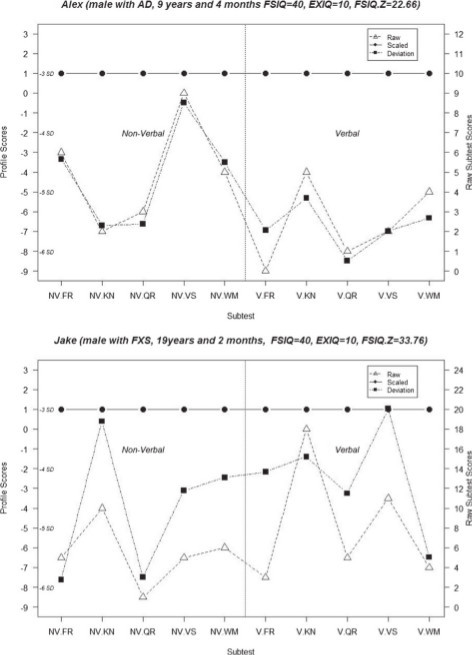
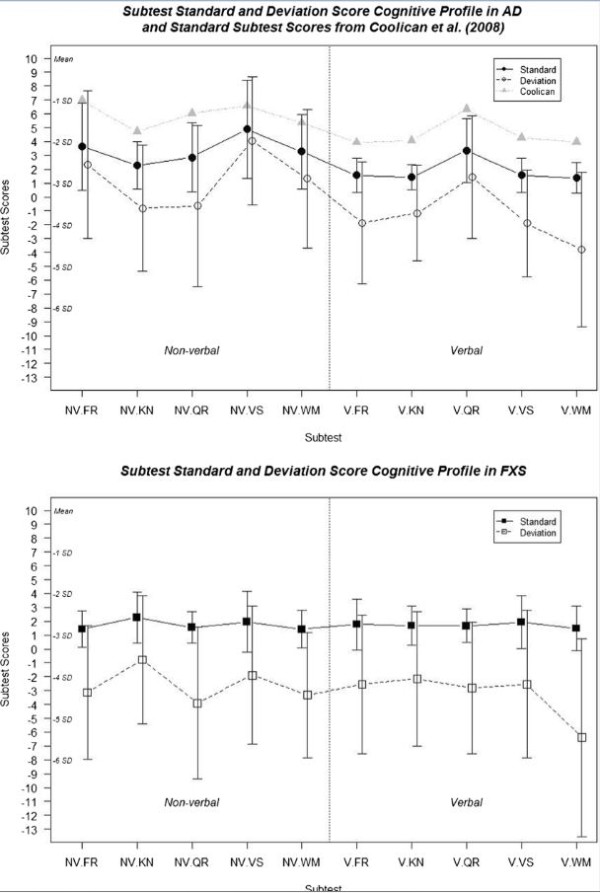
BACKGROUND: Intellectual disability (ID) is characterized by global cognitive deficits, yet the very IQ tests used to assess ID have limited range and precision in this population, especially for more impaired individuals. METHODS: We describe the development and validation of a method of raw z-score transformation (based on general population norms) that ameliorates floor effects and improves the precision of IQ measurement in ID using the Stanford Binet 5 (SB5) in fragile X syndrome (FXS; n = 106), the leading inherited cause of ID, and in individuals with idiopathic autism spectrum disorder (ASD; n = 205). We compared the distributional characteristics and Q-Q plots from the standardized scores with the deviation z-scores. Additionally, we examined the relationship between both scoring methods and multiple criterion measures. RESULTS: We found evidence that substantial and meaningful variation in cognitive ability on standardized IQ tests among individuals with ID is lost when converting raw scores to standardized scaled, index and IQ scores. Use of the deviation z- score method rectifies this problem, and accounts for significant additional variance in criterion validation measures, above and beyond the usual IQ scores. Additionally, individual and group-level cognitive strengths and weaknesses are recovered using deviation scores. CONCLUSION: Traditional methods for generating IQ scores in lower functioning individuals with ID are inaccurate and inadequate, leading to erroneously flat profiles. However assessment of cognitive abilities is substantially improved by measuring true deviation in performance from standardization sample norms. This work has important implications for standardized test development, clinical assessment, and research for which IQ is an important measure of interest in individuals with neurodevelopmental disorders and other forms of cognitive impairment.
Overview
The claims and statistics of this paper haven’t been checked yet.
Run the check — free, no account needed. It reads the open-access text and checks the sources it cites.
Integrity signals
Registry
Cites
Statistics
Figures
Verification
Claims the paper makes
The claims and statistics of this paper haven’t been checked yet.
Run the check — free, no account needed. It reads the open-access text and checks the sources it cites.
Claims other papers make about this one
Each is checked against this paper’s own text: does it say what the citing paper says it does?
The cited source says what the claim attributes to it.
In the citing paper
“However, a particular challenge for measuring change in ID is the potential for floor effects (Hessl et al., 2009; Sansone et al., 2014), which may lead to a mischaracterization of a potentially meaningful change over time in individuals with ID (Bishop et al., 2015; Thurm et al., 2020).”
From NIH Toolbox Cognition Battery Feasibility in Individuals With Williams Syndrome (2022) · cites this paper as Sansone et al., 2014
In the citing paper
“re-scoring of the Wechsler Intelligence Scale for Children (WISC)92 and Stanford–Binet10 for populations with intellectual disability has been completed, yielding much more sensitive estimates of true ability below the traditional test floor.”
From Drug development for neurodevelopmental disorders: lessons learned from fragile X syndrome (2018) · cites this paper as [10]
Self-check
Percentages, sums and reported differences re-computed from the paper’s own numbers.
The self-check needs the paper’s full text.
Citations
Cites
R: A Language and Environment for Statistical Computing
R Core Team (2000) · doi:10.32614/r.manuals · Cited by 355,893
Diagnostic and Statistical Manual of Mental Disorders
American Psychiatric Association (2013) · doi:10.1176/appi.books.9780890425596 · Cited by 116,369
Diagnostic and Statistical Manual of Mental Disorders
Williams, J. B. W., & First, M. B. (2013) · Oxford University Press eBooks · doi:10.1093/acrefore/9780199975839.013.104 · Cited by 109,845
Lord, C., Rutter, M., & Le Couteur, A. (1994) · Journal of Autism and Developmental Disorders · doi:10.1007/bf02172145 · Cited by 9,065
(1998) · Cited by 4,172
Peabody Picture Vocabulary Test
Campbell, J. M., & Dommestrup, A. K. (2010) · The Corsini Encyclopedia of Psychology · doi:10.1002/9780470479216.corpsy0649 · Cited by 3,787
Mullen Scales of Early Learning
Bradley‐Johnson, S. (1997) · Psychology in the Schools · doi:10.1002/(sici)1520-6807(199710)34:4 · Cited by 2,329
Epidemiological Surveys of Autism and Other Pervasive Developmental Disorders: An Update
Fombonne, E. (2003) · Journal of Autism and Developmental Disorders · doi:10.1023/a:1025054610557 · Cited by 1,505
Abnormal dendritic spines in fragile X knockout mice: Maturation and pruning deficits
Comery, T. A., Harris, J. B., Willems, P. J., Oostra, B. A., Irwin, S. A., Weiler, I. J., & Greenough, W. T. (1997) · Proceedings of the National Academy of Sciences · doi:10.1073/pnas.94.10.5401 · Cited by 1,046
Devys, D., Lutz, Y., Rouyer, N., Bellocq, J., & Mandel, J. (1993) · Nature Genetics · doi:10.1038/ng0893-335 · Cited by 781
Research works printed but not linked: 2
- Roid G: Stanford-Binet Intelligence Scales - Examiner’s Manual. 2003, Itasca, IL: Riverside Publishing, 5
- Sparrow S, Balla D, Cicchetti D: Vineland Adaptive Behavior Scales-Interview Edition. 1984, Circle Pines, MN: American Guidance Service
Cited by
Sorted by citations
Hagerman, R. J., Berry-Kravis, E., Hazlett, H. C., Bailey, D. B., Moine, H., Kooy, R. F., Tassone, F., Gantois, I., Sonenberg, N., Mandel, J. L., et al. (2017) · Nature Reviews Disease Primers · doi:10.1038/nrdp.2017.65 · Cited by 838
Self-citationThe molecular biology of FMRP: new insights into fragile X syndrome
Richter, J. D., & Zhao, X. (2021) · Nature Reviews Neuroscience · doi:10.1038/s41583-021-00432-0 · Cited by 390
Drug development for neurodevelopmental disorders: lessons learned from fragile X syndrome
Berry-Kravis, E. M., Lindemann, L., Jønch, A. E., Apostol, G., Bear, M. F., Carpenter, R. L., Crawley, J. N., Curie, A., Des Portes, V., Hossain, F., et al. (2018) · Nature Reviews Drug Discovery · doi:10.1038/nrd.2017.221 · Cited by 336
Self-citationGenetic Testing in Neurodevelopmental Disorders
Savatt, J. M., & Myers, S. M. (2021) · Frontiers in Pediatrics · doi:10.3389/fped.2021.526779 · Cited by 237
Ethridge, L. E., White, S. P., Mosconi, M. W., Wang, J., Pedapati, E. V., Erickson, C. A., Byerly, M., & Sweeney, J. A. (2017) · Molecular Autism · doi:10.1186/s13229-017-0140-1 · Cited by 164
Updated report on tools to measure outcomes of clinical trials in fragile X syndrome
Budimirovic, D. B., Berry‐Kravis, E., Erickson, C. A., Hall, S. S., Hessl, D. R., Reiss, A. L., King, M. K., Abbeduto, L., & Kaufmann, W. E. (2017) · Journal of Neurodevelopmental Disorders · doi:10.1186/s11689-017-9193-x · Cited by 159
Self-citationHessl, D., Sansone, S. M., Berry-Kravis, E., Riley, K., Widaman, K. F., Abbeduto, L., Schneider, A., Coleman, J., Oaklander, D., Rhodes, K. C., et al. (2016) · Journal of Neurodevelopmental Disorders · doi:10.1186/s11689-016-9167-4 · Cited by 126
“We also applied this transformation for the Stanford-Binet 5 IQ scores as previously described [38].”
BackgroundMethodInfluentialSelf-citationBerry-Kravis, E. M., Harnett, M. D., Reines, S. A., Reese, M. A., Ethridge, L. E., Outterson, A. H., Michalak, C., Furman, J., & Gurney, M. E. (2021) · Nature Medicine · doi:10.1038/s41591-021-01321-w · Cited by 131
Self-citationAuditory EEG Biomarkers in Fragile X Syndrome: Clinical Relevance
Ethridge, L. E., Stefano, L. A. D., Schmitt, L., Woodruff, N., Brown, K. L., Tran, M., Wang, J., Pedapati, E. V., Erickson, C. A., & Sweeney, J. A. (2019) · Frontiers in Integrative Neuroscience · doi:10.3389/fnint.2019.00060 · Cited by 114
Budimirovic, D. B., Schlageter, A. M., Filipovic-Sadic, S., Protic, D. D., Bram, E. E., Mahone, E. M., Nicholson, K., Culp, K., Javanmardi, K., Kemppainen, J., et al. (2020) · Brain Sciences · doi:10.3390/brainsci10100694 · Cited by 79
Self-citationFarmer, C., Golden, C., & Thurm, A. E. (2015) · Child Neuropsychology · doi:10.1080/09297049.2015.1020775 · Cited by 77
Validation of the NIH Toolbox Cognitive Battery in intellectual disability
Shields, R. H., Kaat, A. J., McKenzie, F. J., Drayton, A., Sansone, S. M., Coleman, J., Michalak, C., Riley, K., Berry-Kravis, E., Gershon, R. C., et al. (2020) · Neurology · doi:10.1212/wnl.0000000000009131 · Cited by 73
Self-citationAssociation between IQ and FMR1 protein (FMRP) across the spectrum of CGG repeat expansions
Kim, K., Hessl, D. R., Randol, J. L., Espinal, G. M., Schneider, A., Protic, D. D., Aydin, E. Y., Hagerman, R. J., & Hagerman, P. J. (2019) · PLoS ONE · doi:10.1371/journal.pone.0226811 · Cited by 76
Self-citationCharacterising repetitive behaviours in young boys with fragile X syndrome
Oakes, A., Thurman, A. J., McDuffie, A. S., Bullard, L., Hagerman, R. J., & Abbeduto, L. (2015) · Journal of Intellectual Disability Research · doi:10.1111/jir.12234 · Cited by 77
Executive Function in Fragile X Syndrome: A Systematic Review
Schmitt, L., Shaffer, R. C., Hessl, D. R., & Erickson, C. A. (2019) · Brain Sciences · doi:10.3390/brainsci9010015 · Cited by 68
Self-citationAutism Spectrum Disorder and IQ – A Complex Interplay
Wolff, N., Stroth, S., Kamp‐Becker, I., Roepke, S., & Roessner, V. (2022) · Frontiers in Psychiatry · doi:10.3389/fpsyt.2022.856084 · Cited by 78
Assessing general cognitive and adaptive abilities in adults with Down syndrome: a systematic review
Hamburg, S., Lowe, B., Startin, C. M., Padilla, C., Coppus, A. M. W., Silverman, W. P., Fortea, J., Zaman, S. H., Head, E., Handen, B. L., et al. (2019) · Journal of Neurodevelopmental Disorders · doi:10.1186/s11689-019-9279-8 · Cited by 58
Developmental Outcomes Among Young Children With Congenital Zika Syndrome in Brazil
Wheeler, A., Toth, D., Ridenour, T. A., Nóbrega, L., Firmino, R. C. B., da Silva, C. M., Carvalho, P., Marques, D., Okoniewski, K. C., Ventura, L. O., et al. (2020) · JAMA Network Open · doi:10.1001/jamanetworkopen.2020.4096 · Cited by 57
Pedapati, E. V., Schmitt, L., Ethridge, L. E., Miyakoshi, M., Sweeney, J. A., Liu, R., Smith, E. G., Shaffer, R. C., Dominick, K. C., Gilbert, D. L., et al. (2022) · Communications Biology · doi:10.1038/s42003-022-03395-9 · Cited by 51
Palmer, E. E., Howell, K., & Scheffer, I. E. (2021) · Neurotherapeutics · doi:10.1007/s13311-021-01133-3 · Cited by 53
Sex differences in resting EEG power in Fragile X Syndrome
Smith, E. G., Pedapati, E. V., Liu, R., Schmitt, L., Dominick, K. C., Shaffer, R. C., Sweeney, J. A., & Erickson, C. A. (2021) · Journal of Psychiatric Research · doi:10.1016/j.jpsychires.2021.03.057 · Cited by 52
Abbeduto, L., Berry‐Kravis, E., Sterling, A. M., Sherman, S. L., Edgin, J. O., McDuffie, A. S., Hoffmann, A., Hamilton, D., Nelson, M. N., Aschkenasy, J. R., et al. (2020) · Journal of Neurodevelopmental Disorders · doi:10.1186/s11689-020-09313-6 · Cited by 57
Self-citationRaspa, M., Bann, C., Gwaltney, A. Y., Benke, T. A., Fu, C., Glaze, D. G., Haas, R., Heydemann, P. T., Jones, M. D., Kaufmann, W. E., et al. (2020) · American Journal on Intellectual and Developmental Disabilities · doi:10.1352/1944-7558-125.6.493 · Cited by 44
Vacca, R. A., Augello, A., Gallo, L., Caggianese, G., Malizia, V., Grutta, S. L., Murero, M., Valenti, D., Tullo, A., Balech, B., et al. (2023) · Neuroscience & Biobehavioral Reviews · doi:10.1016/j.neubiorev.2023.105156 · Cited by 49
Response to Placebo in Fragile X Syndrome Clinical Trials: An Initial Analysis
Luu, S., Province, H. S., Berry‐Kravis, E., Hagerman, R. J., Hessl, D. R., Vaidya, D. M., Lozano, R., Rosselot, H., Erickson, C. A., Kaufmann, W. E., et al. (2020) · Brain Sciences · doi:10.3390/brainsci10090629 · Cited by 41
Self-citationThe Down Syndrome Cognition Project, Channell, M. M., Mattie, L. J., Hamilton, D. R., Capone, G. T., Mahone, E. M., Sherman, S. L., Rosser, T. C., Reeves, R. H., & Kalb, L. G. (2021) · Journal of Neurodevelopmental Disorders · doi:10.1186/s11689-021-09365-2 · Cited by 41
Standardized Assessment Accommodations for Individuals with Intellectual Disability
Thompson, T., Coleman, J., Riley, K., Snider, L. A., Howard, L. J., Sansone, S. M., & Hessl, D. R. (2018) · Contemporary School Psychology · doi:10.1007/s40688-018-0171-4 · Cited by 48
Self-citationMeng, L. M., Kaufmann, W. E., Frye, R. E., Ong, K. S., Kaminski, J. W., Velinov, M. T., & Berry‐Kravis, E. (2021) · American Journal of Medical Genetics Part A · doi:10.1002/ajmg.a.62594 · Cited by 37
Self-citationCharacteristics Associated with Autism Spectrum Disorder Risk in Individuals with Down Syndrome
The Down Syndrome Cognition Project, Channell, M. M., Hahn, L. J., Rosser, T. C., Hamilton, D., Frank‐Crawford, M. A., Capone, G. T., & Sherman, S. L. (2019) · Journal of Autism and Developmental Disorders · doi:10.1007/s10803-019-04074-1 · Cited by 36
DiStefano, C., Sadhwani, A., & Wheeler, A. (2020) · American Journal on Intellectual and Developmental Disabilities · doi:10.1352/1944-7558-125.6.434 · Cited by 35
Clinical Development of Targeted Fragile X Syndrome Treatments: An Industry Perspective
Lee, A. W., Ventola, P. E., Budimirovic, D. B., Berry‐Kravis, E., & Visootsak, J. (2018) · Brain Sciences · doi:10.3390/brainsci8120214 · Cited by 34
Self-citationThurman, A. J., Edgin, J. O., Sherman, S. L., Sterling, A. M., McDuffie, A. S., Berry‐Kravis, E., Hamilton, D., & Abbeduto, L. (2021) · Journal of Neurodevelopmental Disorders · doi:10.1186/s11689-021-09361-6 · Cited by 33
Self-citationFarmer, C., Thurm, A. E., Troy, J. D., & Kaat, A. J. (2023) · Journal of Neurodevelopmental Disorders · doi:10.1186/s11689-022-09474-6 · Cited by 32
(2017) · The American Pharmacists Association eBooks · doi:10.21019/9781582122885.nationalclinicalguidelines · Cited by 32
Outcome Measures for Core Symptoms of Intellectual Disability: State of the Field
Thurm, A. E., Kelleher, B., & Wheeler, A. (2020) · American Journal on Intellectual and Developmental Disabilities · doi:10.1352/1944-7558-125.6.418 · Cited by 32
A neurophysiological model of speech production deficits in fragile X syndrome
Schmitt, L., Wang, J., Pedapati, E. V., Thurman, A. J., Abbeduto, L., Erickson, C. A., & Sweeney, J. A. (2019) · Brain Communications · doi:10.1093/braincomms/fcz042 · Cited by 31
Boggs, A. E., Schmitt, L., McLane, R. D., Adayev, T., LaFauci, G., Horn, P. S., Dominick, K. C., Groß, C., & Erickson, C. A. (2022) · Scientific Reports · doi:10.1038/s41598-022-09633-8 · Cited by 31
Shaffer, R. C., Schmitt, L., Thurman, A. J., Abbeduto, L., Hong, M. P., Pedapati, E. V., Dominick, K. C., Sweeney, J. A., & Erickson, C. A. (2020) · Brain Sciences · doi:10.3390/brainsci10020066 · Cited by 30
Quintin, E., Jo, B., Hall, S. S., Bruno, J. L., Chromik, L. C., Raman, M. M., Lightbody, A. A., Martin, A., & Reiss, A. L. (2015) · Development and Psychopathology · doi:10.1017/s0954579415001200 · Cited by 30
Comparison of Measures of Ability in Adolescents with Intellectual Disability
Mungkhetklang, C., Crewther, S. G., Bavin, E. L., Goharpey, N., & Parsons, C. (2016) · Frontiers in Psychology · doi:10.3389/fpsyg.2016.00683 · Cited by 28
A normative chart for cognitive development in a genetically selected population
Fiksinski, A., Bearden, C. E., Bassett, A. S., Kahn, R. S., Zinkstok, J., Hooper, S. R., Tempelaar, W. M., McDonald‐McGinn, D. M., Swillen, A., Emanuel, B. S., et al. (2021) · Neuropsychopharmacology · doi:10.1038/s41386-021-00988-6 · Cited by 27
Schworer, E., Hoffman, E., & Esbensen, A. (2021) · Brain Sciences · doi:10.3390/brainsci11070836 · Cited by 24
Development of Neural Response to Novel Sounds in Fragile X Syndrome: Potential Biomarkers
Ethridge, L. E., Thaliath, A. P., Kraff, J., Nijhawan, K., & Berry‐Kravis, E. (2020) · American Journal on Intellectual and Developmental Disabilities · doi:10.1352/1944-7558-125.6.449 · Cited by 24
Self-citationSymptoms of Autism Spectrum Disorder in Individuals with Down Syndrome
Nunnally, A. D., Nguyen, V. H., Anglo, C., Sterling, A. M., Edgin, J. O., Sherman, S. L., Berry‐Kravis, E., Soriano, L. D. H., Abbeduto, L., & Thurman, A. J. (2021) · Brain Sciences · doi:10.3390/brainsci11101278 · Cited by 24
Self-citationDelineating Repetitive Behavior Profiles across the Lifespan in Fragile X Syndrome
Reisinger, D. L., Shaffer, R. C., Tartaglia, N. R., Berry‐Kravis, E., & Erickson, C. A. (2020) · Brain Sciences · doi:10.3390/brainsci10040239 · Cited by 23
Self-citationRahmatullah, N., Schmitt, L., Stefano, L. A. D., Post, S., Robledo, J., Chaudhari, G., Pedapati, E. V., Erickson, C. A., Portera‐Cailliau, C., & Goel, A. (2023) · Journal of Neuroscience · doi:10.1523/jneurosci.0571-23.2023 · Cited by 20
Gaboxadol in Fragile X Syndrome: A 12-Week Randomized, Double-Blind, Parallel-Group, Phase 2a Study
Budimirovic, D. B., Dominick, K. C., Gabis, L. V., Adams, M., Adera, M., Huang, L., Ventola, P. E., Tartaglia, N. R., & Berry‐Kravis, E. (2021) · Frontiers in Pharmacology · doi:10.3389/fphar.2021.757825 · Cited by 21
Self-citationAltered frontal connectivity as a mechanism for executive function deficits in fragile X syndrome
Schmitt, L., Li, J., Liu, R., Horn, P. S., Sweeney, J. A., Erickson, C. A., & Pedapati, E. V. (2022) · Molecular Autism · doi:10.1186/s13229-022-00527-0 · Cited by 21
Cognitive profiles in individuals with Down syndrome
Pulina, F., Vianello, R., & Lanfranchi, S. (2019) · International review of research in developmental disabilities · doi:10.1016/bs.irrdd.2019.06.002 · Cited by 21
Norris, J. E., DeStefano, L. A., Schmitt, L., Pedapati, E. V., Erickson, C. A., Sweeney, J. A., & Ethridge, L. E. (2022) · ACS Chemical Neuroscience · doi:10.1021/acschemneuro.2c00404 · Cited by 19
Arpone, M., Baker, E. K., Bretherton, L., Bui, M., Li, X., Whitaker, S., Dissanayake, C., Cohen, J., Hickerton, C. L., Rogers, C., et al. (2018) · Scientific Reports · doi:10.1038/s41598-018-21990-x · Cited by 19
Berry‐Kravis, E. (2022) · Journal of Child Neurology · doi:10.1177/08830738221089740 · Cited by 19
Self-citationDakopolos, A., Condy, E. E., Smith, E. G., Harvey, D. J., Kaat, A. J., Coleman, J., Riley, K., Berry‐Kravis, E., & Hessl, D. R. (2024) · Journal of Neurodevelopmental Disorders · doi:10.1186/s11689-024-09542-z · Cited by 31
Self-citationSchworer, E. K., Ahmed, A. T., Hogenkamp, L., Moore, S., & Esbensen, A. J. (2022) · Research in Developmental Disabilities · doi:10.1016/j.ridd.2022.104236 · Cited by 17
Shields, R. H., Kaat, A. J., Sansone, S., Michalak, C., Coleman, J., Thompson, T., McKenzie, F. J., Dakopolos, A., Riley, K., Berry‐Kravis, E., et al. (2022) · Neurology · doi:10.1212/wnl.0000000000201528 · Cited by 17
Self-citationSchworer, E. K., Soltani, A., Altaye, M., Fidler, D. J., & Esbensen, A. J. (2023) · Research in Developmental Disabilities · doi:10.1016/j.ridd.2022.104416 · Cited by 17
Schmitt, L., Arzuaga, A. L., Dapore, A. E., Duncan, J., Patel, M., Larson, J. R., Erickson, C. A., Sweeney, J. A., & Ragozzino, M. E. (2023) · Frontiers in Behavioral Neuroscience · doi:10.3389/fnbeh.2022.1074682 · Cited by 18
Hoffmann, A., Wang, A. H., Berger, N. I., Cordeiro, L., Shaffer, R. C., Tartaglia, N. R., Erickson, C. A., & Berry‐Kravis, E. (2020) · Brain Sciences · doi:10.3390/brainsci10040212 · Cited by 17
Self-citationMccormack, L. A., Wylie, A. C., Moultrie, R., Furberg, R., Wheeler, A., Treiman, K., Bailey, D. B., & Raspa, M. (2019) · PLoS ONE · doi:10.1371/journal.pone.0223801 · Cited by 16
Soriano, L. D. H., Villarreal, J. C., Sterling, A. M., Edgin, J. O., Berry‐Kravis, E., Hamilton, D. R., Thurman, A. J., & Abbeduto, L. (2022) · Scientific Reports · doi:10.1038/s41598-022-24478-x · Cited by 15
Self-citationNear‐point Findings in Children with Autism Spectrum Disorder and in Typical Peers
Coulter, R. A., Bade, A., Jenewein, E. C., Tea, Y. C., & Mitchell, G. L. (2021) · Optometry and Vision Science · doi:10.1097/opx.0000000000001679 · Cited by 13
Schworer, E. K., Voth, K., Hoffman, E. K., & Esbensen, A. J. (2021) · Research in Developmental Disabilities · doi:10.1016/j.ridd.2021.104147 · Cited by 13
Farmer, C., Kaat, A. J., Berry‐Kravis, E., & Thurm, A. E. (2022) · International review of research in developmental disabilities · doi:10.1016/bs.irrdd.2022.05.001 · Cited by 12
Self-citationStraub, D., Schmitt, L., Boggs, A. E., Horn, P. S., Dominick, K. C., Groß, C., & Erickson, C. A. (2023) · Scientific Reports · doi:10.1038/s41598-023-29786-4 · Cited by 13
A near normal distribution of IQ in Fragile X Syndrome
Schmitt, L., Nelson, M. N., Shaffer, R. C., & Erickson, C. A. (2024) · Scientific Reports · doi:10.1038/s41598-024-73626-y · Cited by 12
Cordeiro, L., Braden, M. L., Coan, E., Welnick, N., Tanda, T., & Tartaglia, N. R. (2020) · Brain Sciences · doi:10.3390/brainsci10040248 · Cited by 16
Cordeiro, L., Villagomez, A. N., Swain, D. M., Deklotz, S., & Tartaglia, N. R. (2020) · Brain Sciences · doi:10.3390/brainsci10060351 · Cited by 12
Decisional Capacity for Informed Consent in Males and Females with Fragile X Syndrome
Wheeler, A., Wylie, A. C., Raspa, M., Villagomez, A. N., Miller, K. M., Edwards, A., DeRamus, M., Appelbaum, P. S., & Bailey, D. B. (2019) · Journal of Autism and Developmental Disorders · doi:10.1007/s10803-019-03930-4 · Cited by 11
Soltani, A., Schworer, E., Amin, R., Hoffman, E. K., & Esbensen, A. (2023) · Journal of Developmental and Behavioral Pediatrics · doi:10.1097/dbp.0000000000001189 · Cited by 7
Psychometric evaluation of a working memory assessment measure in young children with Down syndrome
Pinks, M. E., Deusen, K. V., Prince, M. A., Esbensen, A. J., Thurman, A. J., Patel, L., Abbeduto, L., Walsh, M. M., Daunhauer, L. A., Feigles, R. T., et al. (2023) · Research in Developmental Disabilities · doi:10.1016/j.ridd.2023.104564 · Cited by 10
Vocabulary comprehension in adults with fragile X syndrome (FXS)
Hoffmann, A., Krause, S. E., Wuu, J., Leurgans, S. L., Guter, S. J., Block, S. S., Salt, J., Cook, E. H., Maino, D. M., & Berry‐Kravis, E. (2019) · Journal of Neurodevelopmental Disorders · doi:10.1186/s11689-019-9285-x · Cited by 10
Self-citationExecutive functioning and verbal fluency performance in youth with Down syndrome
Soltani, A., Schworer, E. K., & Esbensen, A. J. (2022) · Research in Developmental Disabilities · doi:10.1016/j.ridd.2022.104358 · Cited by 9
Startin, C. M., Hamburg, S., & Strydom, A. (2019) · Frontiers in Psychology · doi:10.3389/fpsyg.2018.02730 · Cited by 9
Prerequisite skills in cognitive testing: Innovations in theory and recommendations for practice
Kaat, A. J., Bishop, S. L., Condy, E. E., Sullivan, N. R., Soorya, L. V., & Thurm, A. E. (2021) · Cognitive Development · doi:10.1016/j.cogdev.2021.101038 · Cited by 11
Esbensen, A. J., Schworer, E. K., Fidler, D. J., & Thurman, A. J. (2022) · International review of research in developmental disabilities · doi:10.1016/bs.irrdd.2022.05.005 · Cited by 9
Profiles of Caregiver-Reported Executive Function in Children with Down Syndrome
Deusen, K. V., Prince, M. A., Esbensen, A. J., Edgin, J. O., Schworer, E. K., Thurman, A. J., Patel, L., Daunhauer, L. A., & Fidler, D. J. (2022) · Brain Sciences · doi:10.3390/brainsci12101333 · Cited by 11
Pedapati, E. V., Ethridge, L. E., Liu, Y., Liu, R., Sweeney, J. A., DeStefano, L. A., Miyakoshi, M., Razak, K. A., Schmitt, L., Moore, D. R., et al. (2025) · PLoS ONE · doi:10.1371/journal.pone.0306157 · Cited by 8
Abbeduto, L., Soriano, L. D. H., Berry‐Kravis, E., Sterling, A. M., Edgin, J. O., Abdelnur, N., Drayton, A., Hoffmann, A., Hamilton, D., Harvey, D. J., et al. (2023) · Scientific Reports · doi:10.1038/s41598-023-36087-3 · Cited by 8
Self-citationAbbeduto, L., Klusek, J., Taylor, J. L., Abdelnur, N., Sparapani, N., & Thurman, A. J. (2021) · Brain Sciences · doi:10.3390/brainsci11091179 · Cited by 8
Neuropsychological and ASD phenotypes in rare genetic syndromes: A critical review of the literature
Bush, L., & Scott, M. (2021) · The Clinical Neuropsychologist · doi:10.1080/13854046.2021.1980111 · Cited by 9
Schworer, E. K., Altaye, M., Fidler, D. J., Beebe, D. W., Wiley, S., Hoffman, E. K., & Esbensen, A. J. (2023) · International Journal of Environmental Research and Public Health · doi:10.3390/ijerph20065202 · Cited by 8
EEG Microstates as Markers for Cognitive Impairments in Fragile X Syndrome
Takarae, Y., Zanesco, A. P., Erickson, C. A., & Pedapati, E. V. (2023) · Brain Topography · doi:10.1007/s10548-023-01009-z · Cited by 8
Inclusion of Individuals With Neurodevelopmental Disorders in Norm-Referenced Language Assessments
Loveall, S. J., Channell, M. M., Mattie, L. J., & Barkhimer, A. E. (2022) · Frontiers in Psychology · doi:10.3389/fpsyg.2022.929433 · Cited by 7
Schworer, E. K., Belizaire, S., Hoffman, E. K., & Esbensen, A. J. (2021) · Brain Sciences · doi:10.3390/brainsci12010009 · Cited by 7
Soltani, A., Schworer, E. K., & Esbensen, A. J. (2022) · American Journal on Intellectual and Developmental Disabilities · doi:10.1352/1944-7558-128.1.82 · Cited by 7
Psychometric properties of inhibitory control measures among youth with Down syndrome
Soltani, A., Schworer, E. K., Altaye, M., Fidler, D. J., Beebe, D. W., Wiley, S., Hoffman, E. K., Voth, K., & Esbensen, A. J. (2023) · Journal of Intellectual Disability Research · doi:10.1111/jir.13043 · Cited by 8
Protic, D. D., Breeze, E., Mendoza‐Morales, G., Zafarullah, M., Abbeduto, L., Hagerman, R. J., Coffey, C. S., Cudkowicz, M., Durbin-Johnson, B. P., Ashwood, P., et al. (2024) · SAGE Open Medicine · doi:10.1177/20503121241282401 · Cited by 7
Self-citationHoffmann, A., Thurman, A. J., Sterling, A. M., Kover, S. T., Finestack, L. H., Berry‐Kravis, E., Edgin, J. O., Drayton, A., Fombonne, E. J., & Abbeduto, L. (2022) · Brain Sciences · doi:10.3390/brainsci12050575 · Cited by 7
Self-citationNIH Toolbox Cognition Battery Feasibility in Individuals With Williams Syndrome
Condy, E. E., Becker, L., Farmer, C., Kaat, A. J., Chlebowski, C., Kozel, B. A., & Thurm, A. (2022) · American Journal on Intellectual and Developmental Disabilities · doi:10.1352/1944-7558-127.6.473 · Cited by 6
Hyper-extralemniscal model of Fragile X syndrome
Miyakoshi, M., Kim, H., Stefano, L. A. D., Schmitt, L., Norris, J. E., Ethridge, L. E., Erickson, C. A., & Pedapati, E. V. (2025) · Cerebral Cortex · doi:10.1093/cercor/bhaf141 · Cited by 6
Shishido, Y., Mahone, E. M., & Jacobson, L. A. (2020) · Journal of the International Neuropsychological Society · doi:10.1017/s1355617720000636 · Cited by 6
Examining the validity of the use of ratio IQs in psychological assessments
Ostrolenk, A., & Courchesne, V. (2023) · Acta Psychologica · doi:10.1016/j.actpsy.2023.104054 · Cited by 5
Farmer, C., Thurm, A., Das, T., Bebin, E. M., Bernstein, J. A., Berry‐Kravis, E., Buxbaum, J. D., Eng, C., Frazier, T. W., Hardan, A. Y., et al. (2025) · American Journal on Intellectual and Developmental Disabilities · doi:10.1352/1944-7558-130.5.344 · Cited by 5
Self-citationA cross-comparison of cognitive ability across 8 genomic disorders
Mortillo, M., & Mullé, J. G. (2021) · Current Opinion in Genetics & Development · doi:10.1016/j.gde.2021.04.001 · Cited by 7
Associations Among Sex, Cognitive Ability, and Autism Symptoms in Individuals with Down Syndrome
Soriano, L. D. H., Sterling, A. M., Edgin, J. O., Hamilton, D. R., Berry‐Kravis, E., Nunnally, A. D., Thurman, A. J., & Abbeduto, L. (2022) · Journal of Autism and Developmental Disorders · doi:10.1007/s10803-022-05779-6 · Cited by 5
Self-citationElmaghraby, R., Liu, Y., Ramesh, P., Westerkamp, G. C., Nelson, M. A., Larsh, T. R., Smith, E. G., Gilbert, D. L., Wu, S. W., Erickson, C. A., et al. (2025) · Molecular Autism · doi:10.1186/s13229-025-00682-0 · Cited by 4
P < .05 is in the Eye of the Beholder: A Response to Beaujean and Farmer (2020)
Yi, Z., Schreiber, J. B., Paliliunas, D., Barron, B. F., & Dixon, M. R. (2021) · Journal of Behavioral Education · doi:10.1007/s10864-021-09435-4
Figueroa, M., & Darbra, S. (2024) · Journal of Applied Research in Intellectual Disabilities · doi:10.1111/jar.13330 · Cited by 4
Cognitive trajectories in rare neurogenetic diseases: minding the gaps and filling the potholes
Berry‐Kravis, E. (2016) · Developmental Medicine & Child Neurology · doi:10.1111/dmcn.13018 · Cited by 4
Self-citationSchworer, E. K., & Esbensen, A. J. (2023) · International Journal of Developmental Disabilities · doi:10.1080/20473869.2023.2230409 · Cited by 3
Metadata
- Authors
- Sansone, S. M., Schneider, A., Bickel, E., Berry-Kravis, E., Prescott, C., & Hessl, D.
- Affiliations
- University of California Davis Medical Center (US)
- Rush University Medical Center (US)
- Corresponding author
- Hessl, David
- Venue
- Journal of Neurodevelopmental Disorders
- Published
- 2014-07-08
- Volume
- 6
- Issue
- 1
- Pages
- 16-16
- ISSN
- 1866-1947 (ISSN-L)
- 1866-1955
- PMC
- PMC4613563
- OpenAlex
- W2122684341
- Cited by
- 148
- References
- 34
- Citations by year
- 2026: 5 · 2025: 15 · 2024: 14 · 2023: 19 · 2022: 26 · 2021: 24 · 2020: 17 · 2019: 13 · 2018: 3 · 2017: 6 · 2016: 3 · 2015: 3
- FWCI
- 3.98
- Type
- journal article
- Language
- en
- Open access
- gold
- doi.org
- Licence
- cc-by
- Locations
- Journal of Neurodevelopmental Disorders (publishedVersion, cc-by)
- Europe PMC (PubMed Central) (publishedVersion, cc-by)
- PubMed Central (publishedVersion, cc-by)
- PubMed (publishedVersion)
- eScholarship (California Digital Library) (submittedVersion)
- eScholarship (California Digital Library) (submittedVersion, cc-by)
- Funders
- Autism Speaks
- National Fragile X Foundation
- University of California, Davis
- National Institute of Mental Health (U24MH081810)
- University of California Davis School of Medicine
- Topics
- Health Sciences › Medicine › Public Health, Environmental and Occupational Health › Down syndrome and intellectual disability research
- Life Sciences › Biochemistry, Genetics and Molecular Biology › Genetics › Genetics and Neurodevelopmental Disorders
- Social Sciences › Psychology › Experimental and Cognitive Psychology › Cognitive Abilities and Testing
- Keywords
- intellectual disability, IQ assessment, floor effect, fragile X syndrome, autism spectrum disorder, neurodevelopmental disorders
About these checks
Registry, retraction, Cites and statistics results are computed, not judged, with one exception: a printed reference that no index lists is read once by a model before it counts as a citation error. Claims are extracted by a model and kept only when their quote appears verbatim in the text; each cited source is then checked, with a model’s help, for whether it says what the claim relies on. Those verdicts can be wrong — read the claim’s quote and the cited source before relying on one.
Statistics and arithmetic are recomputed, not judged.
Confidence bands are shown only for fields calibrated on our annotated test set. None is calibrated yet, so no band is shown.
What counts as a claim ›How we measure confidence ›How we check this ›
Are you an author, or do you see a problem with this page? Request a review
