

The DOI matches its Crossref record; 57 of the 58 references it cites were found in a registry or an index, and 1 are not checked yet.
Primary and secondary transcriptional effects in the developing human Down syndrome brain and heart
Open accessAbstract
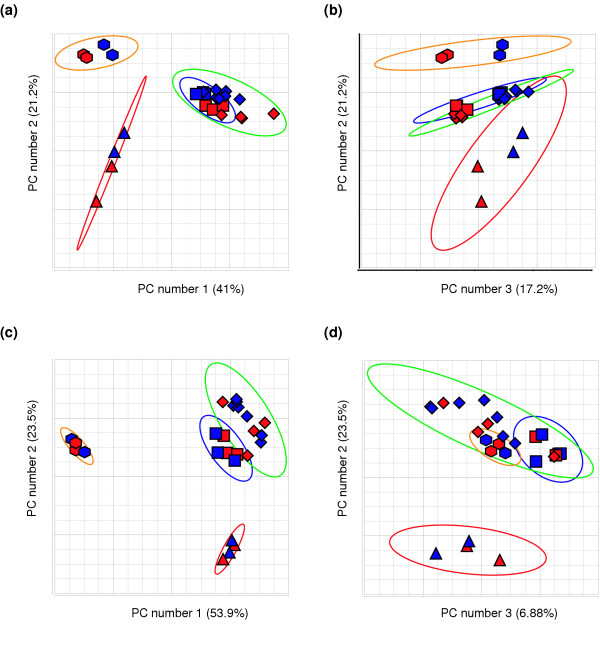
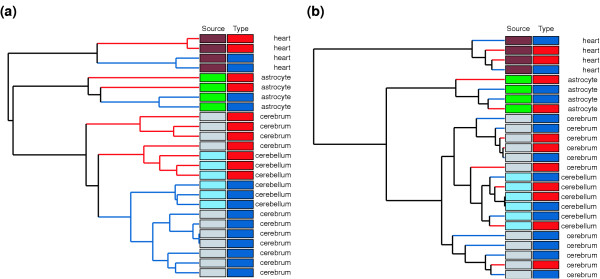
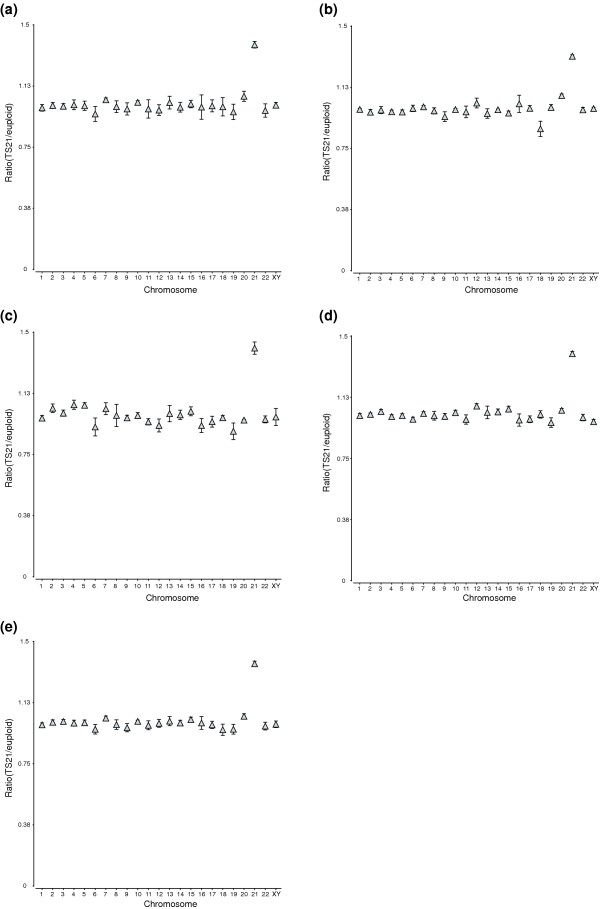
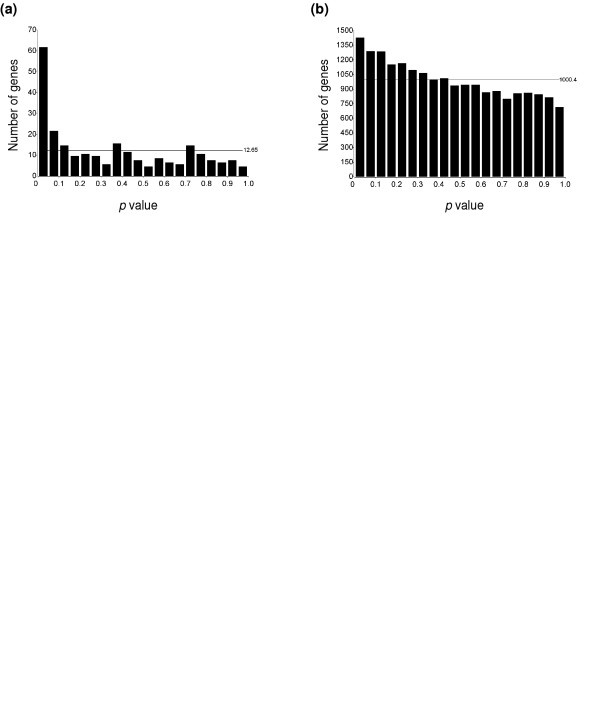
Background: Down syndrome, caused by trisomic chromosome 21, is the leading genetic cause of mental retardation. Recent studies demonstrated that dosage-dependent increases in chromosome 21 gene expression occur in trisomy 21. However, it is unclear whether the entire transcriptome is disrupted, or whether there is a more restricted increase in the expression of those genes assigned to chromosome 21. Also, the statistical significance of differentially expressed genes in human Down syndrome tissues has not been reported. Results: We measured levels of transcripts in human fetal cerebellum and heart tissues using DNA microarrays and demonstrated a dosage-dependent increase in transcription across different tissue/cell types as a result of trisomy 21. Moreover, by having a larger sample size, combining the data from four different tissue and cell types, and using an ANOVA approach, we identified individual genes with significantly altered expression in trisomy 21, some of which showed this dysregulation in a tissue-specific manner. We validated our microarray data by over 5,600 quantitative real-time PCRs on 28 genes assigned to chromosome 21 and other chromosomes. Gene expression values from chromosome 21, but not from other chromosomes, accurately classified trisomy 21 from euploid samples. Our data also indicated functional groups that might be perturbed in trisomy 21. Conclusions: In Down syndrome, there is a primary transcriptional effect of disruption of chromosome 21 gene expression, without a pervasive secondary effect on the remaining transcriptome. The identification of dysregulated genes and pathways suggests molecular changes that may underlie the Down syndrome phenotypes.
Overview
The claims and statistics of this paper haven’t been checked yet.
Run the check — free, no account needed. It reads the open-access text and checks the sources it cites.
Integrity signals
Registry
Cites
Statistics
Figures
Verification
Claims the paper makes
The claims and statistics of this paper haven’t been checked yet.
Run the check — free, no account needed. It reads the open-access text and checks the sources it cites.
Claims other papers make about this one
Each is checked against this paper’s own text: does it say what the citing paper says it does?
The source backs part of the claim, not all of it — or backs it for a different population, condition or comparison.
In the citing paper
“Quantification of both mRNA and protein levels in brains of individuals with DS from fetal to adult stages have shown that not all trisomic genes are dysregulated or expressed at 1.5-fold (Lockstone et al., 2007; Mao et al., 2005; Mao et al., 2003).”
From Sex-specific developmental alterations in DYRK1A expression in the brain of a Down syndrome mouse model (2024) · cites this paper as Mao et al., 2005
Experimental — accuracy not yet measured
Self-check
Percentages, sums and reported differences re-computed from the paper’s own numbers.
The self-check needs the paper’s full text.
Citations
Cites
Controlling the False Discovery Rate: A Practical and Powerful Approach to Multiple Testing
Benjamini, Y., & Hochberg, Y. (1995) · Journal of the Royal Statistical Society Series B: Statistical Methodology · doi:10.1111/j.2517-6161.1995.tb02031.x · Cited by 109,482
Gene Ontology: tool for the unification of biology
Ashburner, M., Ball, C. A., Blake, J. A., Botstein, D., Butler, H., Cherry, J. M., Davis, A. P., Dolinski, K., Dwight, S. S., Eppig, J. T., et al. (2000) · Nature Genetics · doi:10.1038/75556 · Cited by 43,206
The Metabolic and Molecular Bases of Inherited Disease
Scriver, R. C. (1995) · Medical Entomology and Zoology · Cited by 12,101
The metabolic and molecular bases of inherited disease
Chen, Y.-T. (2001) · Medical Entomology and Zoology · Cited by 6,928
The Gene Ontology (GO) database and informatics resource
Gene Ontology Consortium (2003) · Nucleic Acids Research · doi:10.1093/nar/gkh036 · Cited by 4,596
A User's Guide to Principal Components
Leigh, S. D., & Jackson, J. E. (1993) · Technometrics · doi:10.2307/1269292 · Cited by 3,346
Diagnosis of multiple cancer types by shrunken centroids of gene expression
Tibshirani, R. J., Hastie, T. J., Narasimhan, B., & Chu, G. (2002) · Proceedings of the National Academy of Sciences · doi:10.1073/pnas.082099299 · Cited by 2,931
A Use's Guide to Principal Components
Jackson, J. E. (1991) · Wiley series in probability and statistics · doi:10.1002/0471725331 · Cited by 2,523
Boyle, E. I., Weng, S., Gollub, J., Jin, H., Botstein, D., Cherry, J. M., & Sherlock, G. (2004) · Bioinformatics · doi:10.1093/bioinformatics/bth456 · Cited by 2,067
Nearest neighbor (NN) norms: NN pattern classification techniques
Dasarathy, B. V. (1991) · Medical Entomology and Zoology · Cited by 1,654
Research works printed but not linked: 1
- Lejeune J, Gautier M, Turpin R: Etudes des chromosomes somatique de neuf enfants mongoliens. Comptes Rendus Academie des Sciences Paris. 1959, 248: 1721-1722.
Cited by
Sorted by citations
Evolution of the neocortex: a perspective from developmental biology
Rakic, P. (2009) · Nature reviews. Neuroscience · doi:10.1038/nrn2719 · Cited by 1,565
Aït Yahya-Graison, E., Aubert, J., Dauphinot, L., Rivals, I., Prieur, M., Golfier, G., Rossier, J., Personnaz, L., Créau, N., Bléhaut, H., et al. (2007) · The American Journal of Human Genetics · doi:10.1086/520000 · Cited by 338
Transcriptional consequences of aneuploidy
Sheltzer, J. M., Torres, E. M., Dunham, M. J., & Amon, A. (2012) · Proceedings of the National Academy of Sciences · doi:10.1073/pnas.1209227109 · Cited by 297
Ohnologs in the human genome are dosage balanced and frequently associated with disease
Makino, T., & McLysaght, A. (2010) · Proceedings of the National Academy of Sciences · doi:10.1073/pnas.0914697107 · Cited by 284
Gene expression profiling in the adult Down syndrome brain
Lockstone, H. E., Harris, L. W., Swatton, J. E., Wayland, M. T., Holland, A. J., & Bahn, S. (2007) · Genomics · doi:10.1016/j.ygeno.2007.08.005 · Cited by 240
Metadata
- Authors
- Mao, R., Wang, X., Spitznagel, E. L., Frelin, L. P., Ting, J. C., Ding, H., Kim, J.-W., Ruczinski, I., Downey, T. J., & Pevsner, J.
- Affiliations
- Johns Hopkins University (US)
- Partek (United States) (US)
- Washington University in St. Louis (US)
- Kennedy Krieger Institute (US)
- Corresponding author
- Pevsner, Jonathan
- ORCID
- Venue
- Genome Biology
- Published
- 2005-12-16
- Volume
- 6
- Issue
- 13
- Pages
- R107-R107
- ISSN
- 1465-6906 (ISSN-L)
- 1474-760X
- PMC
- PMC1414106
- OpenAlex
- W2159929448
- Cited by
- 166
- References
- 58
- Citations by year
- 2025: 5 · 2024: 2 · 2023: 4 · 2022: 7 · 2021: 10 · 2020: 5 · 2019: 8 · 2018: 7 · 2017: 9 · 2016: 4 · 2015: 2 · 2014: 8 · 2013: 11 · 2012: 15
- FWCI
- 12.23
- Type
- journal article
- Language
- en
- Open access
- gold
- doi.org
- Locations
- Genome biology (publishedVersion, cc-by)
- PubMed Central (publishedVersion)
- PubMed (publishedVersion)
- Funders
- Johns Hopkins University
- National Institutes of Health
- Johns Hopkins Bloomberg School of Public Health
- National Cancer Institute (CA074841, R29CA074841, R01CA074841)
- Eunice Kennedy Shriver National Institute of Child Health and Human Development (R01HD046598)
- Topics
- Health Sciences › Medicine › Public Health, Environmental and Occupational Health › Down syndrome and intellectual disability research
- Life Sciences › Biochemistry, Genetics and Molecular Biology › Genetics › Genomic variations and chromosomal abnormalities
- Life Sciences › Biochemistry, Genetics and Molecular Biology › Genetics › Genetic and Clinical Aspects of Sex Determination and Chromosomal Abnormalities
- Keywords
- Down syndrome, gene expression dysregulation, transcriptome, fetal cerebellum, fetal heart, tissue-specific gene expression, intellectual disability, differentially expressed genes
- MeSH terms
- Astrocytes, Cell Line, Chromosomes, Human, Pair 21, Down Syndrome, Fetus, Heart, Humans, Myocardium, RNA, Messenger, Telencephalon, Transcription, Genetic, Reproducibility of Results, Cluster Analysis, Gene Expression Regulation, Developmental, Principal Component Analysis, Microarray Analysis
About these checks
Registry, retraction, Cites and statistics results are computed, not judged, with one exception: a printed reference that no index lists is read once by a model before it counts as a citation error. Claims are extracted by a model and kept only when their quote appears verbatim in the text; each cited source is then checked, with a model’s help, for whether it says what the claim relies on. Those verdicts can be wrong — read the claim’s quote and the cited source before relying on one.
Statistics and arithmetic are recomputed, not judged.
Confidence bands are shown only for fields calibrated on our annotated test set. None is calibrated yet, so no band is shown.
What counts as a claim ›How we measure confidence ›How we check this ›
Are you an author, or do you see a problem with this page? Request a review
