

The DOI matches its Crossref record; 86 of the 86 references it cites were found in a registry or an index.
Variations in the transcriptome of Alzheimer's disease reveal molecular networks involved in cardiovascular diseases
Open accessAbstract
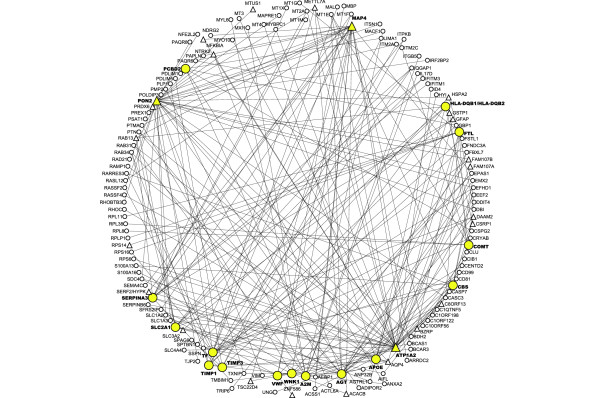
Background: Because of its polygenic nature, Alzheimer's disease is believed to be caused not by defects in single genes, but rather by variations in a large number of genes and their complex interactions. A systems biology approach, such as the generation of a network of co-expressed genes and the identification of functional modules and cis-regulatory elements, to extract insights and knowledge from microarray data will lead to a better understanding of complex diseases such as Alzheimer's disease. In this study, we perform a series of analyses using co-expression networks, cis-regulatory elements, and functions of co-expressed gene modules to analyze single-cell gene expression data from normal and Alzheimer's disease-affected subjects. Results: We identified six co-expressed gene modules, each of which represented a biological process perturbed in Alzheimer's disease. Alzheimer's disease-related genes, such as APOE, A2M, PON2 and MAP4, and cardiovascular disease-associated genes, including COMT, CBS and WNK1, all congregated in a single module. Some of the disease-related genes were hub genes while many of them were directly connected to one or more hub genes. Further investigation of this disease-associated module revealed cis-regulatory elements that match to the binding sites of transcription factors involved in Alzheimer's disease and cardiovascular disease. Conclusion: Our results show the extensive links between Alzheimer's disease and cardiovascular disease at the co-expression and co-regulation levels, providing further evidence for the hypothesis that cardiovascular disease and Alzheimer's disease are linked. Our results support the notion that diseases in which the same set of biochemical pathways are affected may tend to co-occur with each other.
Overview
The claims and statistics of this paper haven’t been checked yet.
Run the check — free, no account needed. It reads the open-access text and checks the sources it cites.
Integrity signals
Registry
Cites
Statistics
Figures
Verification
Claims the paper makes
The claims and statistics of this paper haven’t been checked yet.
Run the check — free, no account needed. It reads the open-access text and checks the sources it cites.
Claims other papers make about this one
Each is checked against this paper’s own text: does it say what the citing paper says it does?
In the citing paper
“Another study used similar methods to identify overlap in transcriptional networks between vascular disease (a major risk factor for dementia) and Alzheimer disease, identifying potential molecular mechanisms that might underlie their co-occurrence151.”
From Systems biology and gene networks in neurodevelopmental and neurodegenerative disorders (2015) · cites this paper as [151]
Self-check
Percentages, sums and reported differences re-computed from the paper’s own numbers.
The self-check needs the paper’s full text.
Citations
Cites
Neuropathological stageing of Alzheimer-related changes.
Braak, H., & Braak, E. (1991) · Acta Neuropathologica · doi:10.1007/bf00308809 · Cited by 16,123
Finding and evaluating community structure in networks
Newman, M. E. J., & Girvan, M. (2004) · Physical Review E · doi:10.1103/physreve.69.026113 · Cited by 13,931
In silico prediction of protein-protein interactions in human macrophages
Souiai, O., Guerfali, F. Z., Miled, S. B., Brun, C., & Benkahla, A. (2014) · BMC Research Notes · doi:10.1186/1756-0500-7-157 · Cited by 10,785
Significance analysis of microarrays applied to the ionizing radiation response
Tusher, V. G., Tibshirani, R., & Chu, G. (2001) · Proceedings of the National Academy of Sciences · doi:10.1073/pnas.091062498 · Cited by 10,568
DAVID: Database for Annotation, Visualization, and Integrated Discovery
Dennis, G., Sherman, B. T., Hosack, D. A., Yang, J., Gao, W., Lane, H. C., & Lempicki, R. A. (2003) · Genome Biology · doi:10.1186/gb-2003-4-5-p3 · Cited by 9,327
da Luz, A. C. D. D. S., Dias, G. P., Bevilaqua, M. C. D. N., Cocks, G. D., Gardino, P. F., Thuret, S., & Nardi, A. E. (2013) · Neuropsychobiology · doi:10.1159/000353269 · Cited by 4,015
Quandt, K., Frech, K., Karas, H., Wingender, E., & Werner, T. (1995) · Nucleic Acids Research · doi:10.1093/nar/23.23.4878 · Cited by 2,587
Huang, D. W., Sherman, B. T., Tan, Q., Collins, J., Alvord, W. G., Roayaei, J., Stephens, R. D., Baseler, M., Lane, H. C., & Lempicki, R. A. (2007) · Genome biology · doi:10.1186/gb-2007-8-9-r183 · Cited by 2,482
What is principal component analysis?
Ringnér, M. (2008) · Nature Biotechnology · doi:10.1038/nbt0308-303 · Cited by 2,407
DAVID: Database for Annotation, Visualization, and Integrated Discovery
Dennis, G., Sherman, B. T., Hosack, D. A., Yang, J., Gao, W., Lane, H. C., & Lempicki, R. A. (2003) · Genome biology · doi:10.1186/gb-2003-4-9-r60 · Cited by 2,383
Cited by
Sorted by citations
Network medicine: a network-based approach to human disease
Barabási, A.-L., Gulbahce, N., & Loscalzo, J. (2011) · Nature Reviews Genetics · doi:10.1038/nrg2918 · Cited by 5,034
Uncovering disease-disease relationships through the incomplete interactome
Menche, J., Sharma, A., Kitsak, M., Ghiassian, S. D., Vidal, M., Loscalzo, J., & Barabási, A.-L. (2015) · Science · doi:10.1126/science.1257601 · Cited by 1,546
Structure and dynamics of molecular networks: A novel paradigm of drug discovery
Csermely, P., Korcsmáros, T., Kiss, H., London, G., & Nussinov, R. (2013) · Pharmacology & Therapeutics · doi:10.1016/j.pharmthera.2013.01.016 · Cited by 911
Systems biology and gene networks in neurodevelopmental and neurodegenerative disorders
Parikshak, N. N., Gandal, M. J., & Geschwind, D. H. (2015) · Nature Reviews Genetics · doi:10.1038/nrg3934 · Cited by 430
Gaiteri, C., Ding, Y., French, B., Tseng, G. C., & Sibille, E. (2014) · Genes, Brain and Behavior · doi:10.1111/gbb.12106 · Cited by 289
Metadata
- Authors
- Ray, M., Ruan, J., & Zhang, W.
- Affiliations
- Washington University in St. Louis (US)
- The University of Texas at San Antonio (US)
- Corresponding author
- Zhang, Weixiong
- Venue
- Genome Biology
- Published
- 2008-10-08
- Volume
- 9
- Issue
- 10
- Pages
- R148-R148
- ISSN
- 1465-6906 (ISSN-L)
- 1474-760X
- PMC
- PMC2760875
- OpenAlex
- W2125698969
- Cited by
- 119
- References
- 86
- Citations by year
- 2026: 1 · 2025: 4 · 2024: 7 · 2023: 6 · 2022: 3 · 2021: 3 · 2020: 10 · 2019: 1 · 2018: 3 · 2017: 6 · 2016: 12 · 2015: 11 · 2014: 13 · 2013: 13 · 2012: 11
- FWCI
- 2.06
- Type
- journal article
- Language
- en
- Open access
- gold
- doi.org
- Locations
- Genome biology (publishedVersion, cc-by)
- PubMed Central (publishedVersion, cc-by)
- PubMed (publishedVersion)
- Digital Commons@Becker (Washington University School of Medicine) (submittedVersion, other-oa)
- Funders
- National Science Foundation (0535257, 0743797)
- Alzheimer's Association
- University of Texas at San Antonio
- University of California, Los Angeles
- National Heart, Lung, and Blood Institute (R01HL091028)
- Topics
- Life Sciences › Biochemistry, Genetics and Molecular Biology › Molecular Biology › Bioinformatics and Genomic Networks
- Life Sciences › Neuroscience › Cellular and Molecular Neuroscience › Alzheimer's disease research and treatments
- Health Sciences › Medicine › Psychiatry and Mental health › Dementia and Cognitive Impairment Research
- Keywords
- Alzheimer's disease, cardiovascular disease, transcriptome, co-expression network, gene modules, cis-regulatory elements, transcription factor binding sites, hub genes, apolipoprotein E, catechol-O-methyltransferase, WNK1, disease co-occurrence, single-cell gene expression
- MeSH terms
- Aged, 80 and over, Alzheimer Disease, Cardiovascular Diseases, Humans, Genetic Variation, Brain-Derived Neurotrophic Factor, Gene Expression Profiling, Systems Biology, Gene Regulatory Networks
About these checks
Registry, retraction, Cites and statistics results are computed, not judged, with one exception: a printed reference that no index lists is read once by a model before it counts as a citation error. Claims are extracted by a model and kept only when their quote appears verbatim in the text; each cited source is then checked, with a model’s help, for whether it says what the claim relies on. Those verdicts can be wrong — read the claim’s quote and the cited source before relying on one.
Statistics and arithmetic are recomputed, not judged.
Confidence bands are shown only for fields calibrated on our annotated test set. None is calibrated yet, so no band is shown.
What counts as a claim ›How we measure confidence ›How we check this ›
Are you an author, or do you see a problem with this page? Request a review
