

The DOI matches its Crossref record; 9 of the 9 references it cites were found in a registry or an index.
Functional protein divergence in the evolution of Homo sapiens
Abstract
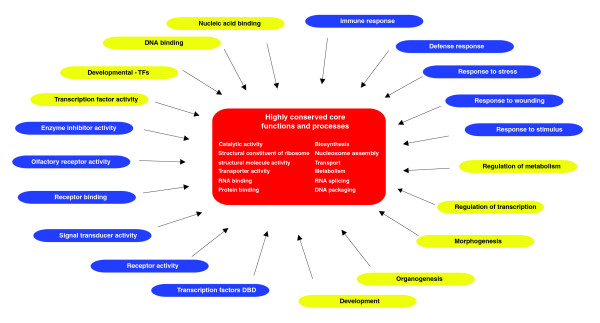
Background: Protein-coding regions in a genome evolve by sequence divergence and gene gain and loss, altering the gene content of the organism. However, it is not well understood how this has given rise to the enormous diversity of metazoa present today. Results: To obtain a global view of human genomic evolution, we quantify the divergence of proteins by functional category at different evolutionary distances from human. Conclusion: This analysis highlights some general systems-level characteristics of human evolution: regulatory processes, such as signal transducers, transcription factors and receptors, have a high degree of plasticity, while core processes, such as metabolism, transport and protein synthesis, are largely conserved. Additionally, this study reveals a dynamic picture of selective forces at short, medium and long evolutionary timescales. Certain functional categories, such as 'development' and 'organogenesis', exhibit temporal patterns of sequence divergence in eukaryotes relative to human. This framework for a grammar of human evolution supports previously postulated theories of robustness and evolvability.
Overview
The claims and statistics of this paper haven’t been checked yet.
Run the check — free, no account needed. It reads the open-access text and checks the sources it cites.
Integrity signals
Registry
Cites
Statistics
Figures
Verification
Claims the paper makes
The claims and statistics of this paper haven’t been checked yet.
Run the check — free, no account needed. It reads the open-access text and checks the sources it cites.
Claims other papers make about this one
Each is checked against this paper’s own text: does it say what the citing paper says it does?
The source backs part of the claim, not all of it — or backs it for a different population, condition or comparison.
In the citing paper
“Homo sapiens evolved from a diverse range of random gene mutations over a period of hundreds of millions of years, 9”
From Three Tiers to biological escape velocity: The quest to outwit aging (2022) · cites this paper as [9]
Experimental — accuracy not yet measured
Self-check
Percentages, sums and reported differences re-computed from the paper’s own numbers.
The self-check needs the paper’s full text.
Citations
Cites
International Chicken Genome Sequencing Consortium (2004) · Nature · doi:10.1038/nature03154 · Cited by 2,750
Initial sequence of the chimpanzee genome and comparison with the human genome
The Chimpanzee Sequencing and Analysis Consortium (2005) · Nature · doi:10.1038/nature04072 · Cited by 2,459
Kitano, H. (2004) · Nature Reviews Genetics · doi:10.1038/nrg1471 · Cited by 2,278
The evolutionary significance of cis-regulatory mutations
Wray, G. A. (2007) · Nature Reviews Genetics · doi:10.1038/nrg2063 · Cited by 1,521
The Widespread Impact of Mammalian MicroRNAs on mRNA Repression and Evolution
Farh, K. K.-H., Grimson, A., Jan, C., Lewis, B. P., Johnston, W. K., Lim, L. P., Burge, C. B., & Bartel, D. P. (2005) · Science · doi:10.1126/science.1121158 · Cited by 1,484
Gene Regulatory Networks and the Evolution of Animal Body Plans
Davidson, E. H., & Erwin, D. H. (2006) · Science · doi:10.1126/science.1113832 · Cited by 1,207 · cited 1×
“Thus, within the 'development' category, there are proteins, including some transcription factors, that form part of the core of the developmental network, conserved from invertebrates to human, while at the same time, other parts of the network have undergone profound change or innovation [33].”
BackgroundStark, A., Brennecke, J., Bushati, N., Russell, R. B., & Cohen, S. M. (2005) · Cell · doi:10.1016/j.cell.2005.11.023 · Cited by 1,080
Evolution at Two Levels: On Genes and Form
Carroll, S. B. (2005) · PLoS Biology · doi:10.1371/journal.pbio.0030245 · Cited by 882
Protein Family Expansions and Biological Complexity
Vogel, C., & Chothia, C. (2006) · PLoS Computational Biology · doi:10.1371/journal.pcbi.0020048 · Cited by 227
Research works printed but not linked: 45
- Dickerson RE: The structures of cytochrome c and the rates of molecular evolution. J Mol Evol. 1971, 1: 26-45. 10.1007/BF01659392. · DOI · Paper page
- Dayhoff M, Schwartz R, Orcutt B: A model of evolutionary change in proteins. Atlas of Protein Sequence and Structure. Edited by: Dayhoff M. 1978, Silver Springs, MD: National Biomedical Research Foundation, 5: 345-352.
- Albà MM, Castresana J: Inverse relationship between evolutionary rate and age of mammalian genes. Mol Biol Evol. 2005, 22: 598-606. 10.1093/molbev/msi045. · DOI
- Luz H, Vingron M: Family specific rates of protein evolution. Bioinformatics. 2006, 22: 1166-1171. 10.1093/bioinformatics/btl073. · DOI
- Pál C, Papp B, Lercher MJ: An integrated view of protein evolution. Nat Rev Genet. 2006, 7: 337-348. 10.1038/nrg1838. · DOI
- Bustamante CD, Fledel-Alon A, Williamson S, Nielsen R, Hubisz MT, Glanowski S, Tanenbaum DM, White TJ, Sninsky JJ, Hernandez RD, Civello D, Adams MD, Cargill M, Clark AG: Natural selection on protein-coding genes in the human genome. Nature. 2005, 437: 1153-1157. 10.1038/nature04240. · DOI
- Castillo-Davis CI, Kondrashov FA, Hartl DL, Kulathinal RJ: The functional genomic distribution of protein divergence in two animal phyla: coevolution, genomic conflict, and constraint. Genome Res. 2004, 14: 802-811. 10.1101/gr.2195604. · DOI
- Clark AG, Glanowski S, Nielsen R, Thomas PD, Kejariwal A, Todd MA, Tanenbaum DM, Civello D, Lu F, Murphy B, Ferriera S, Wang G, Zheng X, White TJ, Sninsky JJ, Adams MD, Cargill M: Inferring nonneutral evolution from human-chimp-mouse orthologous gene trios. Science. 2003, 302: 1960-1963. 10.1126/science.1088821. · DOI
- The International HapMap Consortium: A haplotype map of the human genome. Nature. 2005, 437: 1299-1320. 10.1038/nature04226. · DOI · Paper page
- Voight BF, Kudaravalli S, Wen X, Pritchard JK: A map of recent positive selection in the human genome. PLoS Biol. 2006, 4: e72-10.1371/journal.pbio.0040072. · DOI
- Arbiza L, Dopazo J, Dopazo H: Positive selection, relaxation, and acceleration in the evolution of the human and chimp genome. PLoS Comput Biol. 2006, 2: e38-10.1371/journal.pcbi.0020038. · DOI
- Chervitz SA, Aravind L, Sherlock G, Ball CA, Koonin EV, Dwight SS, Harris MA, Dolinski K, Mohr S, Smith T, Weng S, Cherry JM, Botstein D: Comparison of the complete protein sets of worm and yeast: orthology and divergence. Science. 1998, 282: 2022-2028. 10.1126/science.282.5396.2022. · DOI
- Madan Babu M, Teichmann SA, Aravind L: Evolutionary dynamics of prokaryotic transcriptional regulatory networks. J Mol Biol. 2006, 358: 614-633. 10.1016/j.jmb.2006.02.019. · DOI
- Coulson RM, Ouzounis CA: The phylogenetic diversity of eukaryotic transcription. Nucleic Acids Res. 2003, 31: 653-660. 10.1093/nar/gkg156. · DOI
- Peregrin-Alvarez JM, Tsoka S, Ouzounis CA: The phylogenetic extent of metabolic enzymes and pathways. Genome Res. 2003, 13: 422-427. 10.1101/gr.246903. · DOI
- van Nimwegen E: Scaling laws in the functional content of genomes. Trends Genet. 2003, 19: 479-484. 10.1016/S0168-9525(03)00203-8. · DOI
- Ranea JA, Buchan DW, Thornton JM, Orengo CA: Evolution of protein superfamilies and bacterial genome size. J Mol Biol. 2004, 336: 871-887. 10.1016/j.jmb.2003.12.044. · DOI
- Nielsen R, Bustamante C, Clark AG, Glanowski S, Sackton TB, Hubisz MJ, Fledel-Alon A, Tanenbaum DM, Civello D, White TJ, J Sninsky J, Adams MD, Cargill M: A scan for positively selected genes in the genomes of humans and chimpanzees. PLoS Biol. 2005, 3: e170-10.1371/journal.pbio.0030170. · DOI
- Jiang G, Zhang BB: Glucagon and regulation of glucose metabolism. Am J Physiol Endocrinol Metab. 2003, 284: E671-E678. · DOI · Paper page
- Gilad Y, Oshlack A, Smyth GK, Speed TP, White KP: Expression profiling in primates reveals a rapid evolution of human transcription factors. Nature. 2006, 440: 242-245. 10.1038/nature04559. · DOI
- Brogiolo W, Stocker H, Ikeya T, Rintelen F, Fernandez R, Hafen E: An evolutionarily conserved function of the Drosophila insulin receptor and insulin-like peptides in growth control. Curr Biol. 2001, 11: 213-221. 10.1016/S0960-9822(01)00068-9. · DOI · Paper page
- Pierce SB, Costa M, Wisotzkey R, Devadhar S, Homburger SA, Buchman AR, Ferguson KC, Heller J, Platt DM, Pasquinelli AA, Liu LX, Doberstein SK, Ruvkun G: Regulation of DAF-2 receptor signaling by human insulin and ins-1, a member of the unusually large and diverse C. elegans insulin gene family. Genes Dev. 2001, 15: 672-686. 10.1101/gad.867301. · DOI
- Duret L, Guex N, Peitsch MC, Bairoch A: New insulin-like proteins with atypical disulfide bond pattern characterized in Caenorhabditis elegans by comparative sequence analysis and homology modeling. Genome Res. 1998, 8: 348-353. · DOI
- Leevers SJ: Growth control: invertebrate insulin surprises!. Curr Biol. 2001, 11: R209-R212. 10.1016/S0960-9822(01)00107-5. · DOI
- Tatusov RL, Fedorova ND, Jackson JD, Jacobs AR, Kiryutin B, Koonin EV, Krylov DM, Mazumder R, Mekhedov SL, Nikolskaya AN, Rao BS, Smirnov S, Sverdlov AV, Vasudevan S, Wolf YI, Yin JJ, Natale DA: The COG database: an updated version includes eukaryotes. BMC Bioinformatics. 2003, 4: 41-10.1186/1471-2105-4-41. · DOI
- Klein J, Nikolaidis N: The descent of the antibody-based immune system by gradual evolution. Proc Natl Acad Sci USA. 2005, 102: 169-174. 10.1073/pnas.0408480102. · DOI
- Alder MN, Rogozin IB, Iyer LM, Glazko GV, Cooper MD, Pancer Z: Diversity and function of adaptive immune receptors in a jawless vertebrate. Science. 2005, 310: 1970-1973. 10.1126/science.1119420. · DOI
- Yokoyama M, Nishi Y, Miyamoto Y, Nakamura M, Akiyama K, Matsubara K, Okubo K: Molecular cloning of a human neuroD from a neuroblastoma cell line specifically expressed in the fetal brain and adult cerebellum. Brain Res Mol Brain Res. 1996, 42: 135-139. 10.1016/S0169-328X(96)00154-4. · DOI
- Cooper GM, Stone EA, Asimenos G, Green ED, Batzoglou S, Sidow A: Distribution and intensity of constraint in mammalian genomic sequence. Genome Res. 2005, 15: 901-913. 10.1101/gr.3577405. · DOI · Paper page
- Freilich S, Massingham T, Bhattacharyya S, Ponsting H, Lyons PA, Freeman TC, Thornton JM: Relationship between the tissue-specificity of mouse gene expression and the evolutionary origin and function of the proteins. Genome Biol. 2005, 6: R56-10.1186/gb-2005-6-7-r56. · DOI
- Su AI, Cooke MP, Ching KA, Hakak Y, Walker JR, Wiltshire T, Orth AP, Vega RG, Sapinoso LM, Moqrich A, Patapoutian A, Hampton GM, Schultz PG, Hogenesch JB: Large-scale analysis of the human and mouse transcriptomes. Proc Natl Acad Sci USA. 2002, 99: 4465-4470. 10.1073/pnas.012025199. · DOI · Paper page
- Kirschner M, Gerhart J: Evolvability. Proc Natl Acad Sci USA. 1998, 95: 8420-8427. 10.1073/pnas.95.15.8420. · DOI · Paper page
- Lee S, Kohane I, Kasif S: Genes involved in complex adaptive processes tend to have highly conserved upstream regions in mammalian genomes. BMC Genomics. 2005, 6: 168-10.1186/1471-2164-6-168. · DOI
- Taylor MS, Kai C, Kawai J, Carninci P, Hayashizaki Y, Semple CA: Heterotachy in mammalian promoter evolution. PLoS Genet. 2006, 2: e30-10.1371/journal.pgen.0020030. · DOI
- Khaitovich P, Hellmann I, Enard W, Nowick K, Leinweber M, Franz H, Weiss G, Lachmann M, Pääbo S: Parallel patterns of evolution in the genomes and transcriptomes of humans and chimpanzees. Science. 2005, 309: 1850-1854. 10.1126/science.1108296. · DOI
- Stranger BE, Forrest MS, Dunning M, Ingle CE, Beazley C, Thorne N, Redon R, Bird CP, de Grassi A, Lee C, Tyler-Smith C, Carter N, Scherer SW, Tavaré S, Deloukas P, Hurles ME, Dermitzakis ET: Relative impact of nucleotide and copy number variation on gene expression phenotypes. Science. 2007, 315: 848-853. 10.1126/science.1136678. · DOI
- Stranger BE, Forrest MS, Clark AG, Minichiello MJ, Deutsch S, Lyle R, Hunt S, Kahl B, Antonarakis SE, Tavaré S, Deloukas P, Dermitzakis ET: Genome-wide associations of gene expression variation in humans. PLoS Genet. 2005, 1: e78-10.1371/journal.pgen.0010078. · DOI
- Valdar W, Solberg LC, Gauguier D, Burnett S, Klenerman P, Cookson WO, Taylor MS, Rawlins JN, Mott R, Flint J: Genome-wide genetic association of complex traits in heterogeneous stock mice. Nat Genet. 2006, 38: 879-887. 10.1038/ng1840. · DOI
- Birney E, Andrews D, Caccamo M, Chen Y, Clarke L, Coates G, Cox T, Cunningham F, Curwen V, Cutts T, Down T, Durbin R, Fernandez-Suarez XM, Flicek P, Gräf S, Hammond M, Herrero J, Howe K, Iyer V, Jekosch K, Kähäri A, Kasprzyk A, Keefe D, Kokocinski F, Kulesha E, London D, Longden I, Melsopp C, Meidl P, Overduin B, et al: Ensembl 2006. Nucleic Acids Res. 2006, 34 (Database issue): D556-D561. 10.1093/nar/gkj133. · DOI
- Gene Ontology Consortium: The Gene Ontology (GO) project in 2006. Nucleic Acids Res. 2006, 34 (Database issue): D322-D326. 10.1093/nar/gkj021. · DOI
- Pruitt KD, Tatusova T, Maglott DR: NCBI reference sequences (RefSeq): a curated non-redundant sequence database of genomes, transcripts and proteins. Nucleic Acids Res. 2007, 35 (Database issue): D61-D65. 10.1093/nar/gkl842. · DOI
- Kummerfeld SK, Teichmann SA: DBD: a transcription factor prediction database. Nucleic Acids Res. 2006, 34 (Database issue): D74-D81. 10.1093/nar/gkj131. · DOI
- Lopez-Bigas N, Ouzounis CA: Genome-wide identification of genes likely to be involved in human genetic disease. Nucleic Acids Res. 2004, 32: 3108-3114. 10.1093/nar/gkh605. · DOI
- Morgenstern B: DIALIGN: multiple DNA and protein sequence alignment at BiBiServ. Nucleic Acids Res. 2004, 32 (Web Server issue): W33-W36. 10.1093/nar/gkh373. · DOI
- Friedman N, Ninio M, Pe'er I, Pupko T: A structural EM algorithm for phylogenetic inference. J Comput Biol. 2002, 9: 331-353. 10.1089/10665270252935494. · DOI
Cited by
Sorted by citations
A census of human transcription factors: function, expression and evolution
Vaquerizas, J. M., Kummerfeld, S. K., Teichmann, S. A., & Luscombe, N. M. (2009) · Nature Reviews Genetics · doi:10.1038/nrg2538 · Cited by 1,573
Self-citationConservation of core gene expression in vertebrate tissues
Chan, E. T., Quon, G. T., Chua, G., Babak, T., Trochesset, M., Zirngibl, R. A., Aubin, J., Ratcliffe, M. J., Wilde, A., Brudno, M., et al. (2009) · Journal of Biology · doi:10.1186/jbiol130 · Cited by 190
Three Tiers to biological escape velocity: The quest to outwit aging
Palmer, R. D. (2022) · AGING MEDICINE · doi:10.1002/agm2.12231 · Cited by 2
Metadata
- Authors
- Lopez-Bigas, N., De, S., & Teichmann, S. A.
- Venue
- Genome Biology
- Published
- 2008-02-15
- Volume
- 9
- Issue
- 2
- ISSN
- 1474-760X
- PMC
- PMC2374701
- Cited by
- 52
- References
- 9
- Language
- en
About these checks
Registry, retraction, Cites and statistics results are computed, not judged, with one exception: a printed reference that no index lists is read once by a model before it counts as a citation error. Claims are extracted by a model and kept only when their quote appears verbatim in the text; each cited source is then checked, with a model’s help, for whether it says what the claim relies on. Those verdicts can be wrong — read the claim’s quote and the cited source before relying on one.
Statistics and arithmetic are recomputed, not judged.
Confidence bands are shown only for fields calibrated on our annotated test set. None is calibrated yet, so no band is shown.
What counts as a claim ›How we measure confidence ›How we check this ›
Are you an author, or do you see a problem with this page? Request a review
