Cited by 305MicroRNA in disease regulationCancer-related Molecular PathwaysCancer-related molecular mechanisms research

The DOI matches its Crossref record; 37 of the 39 references it cites were found in a registry or an index.

The miR-17-5p microRNA is a key regulator of the G1/S phase cell cycle transition

Open access
Cloonan, Nicole, Brown, Mellissa K, Steptoe, Anita L, Wani, Shivangi, Chan, Wei Ling, Forrest, Alistair RR, Kolle, Gabriel, Gabrielli, Brian, Grimmond, Sean M·2008·Genome Biology

Abstract

Background: MicroRNAs are modifiers of gene expression, acting to reduce translation through either translational repression or mRNA cleavage. Recently, it has been shown that some microRNAs can act to promote or suppress cell transformation, with miR-17-92 described as the first oncogenic microRNA. The association of miR-17-92 encoded microRNAs with a surprisingly broad range of cancers not only underlines the clinical significance of this locus, but also suggests that miR-17-92 may regulate fundamental biological processes, and for these reasons miR-17-92 has been considered as a therapeutic target. Results: In this study, we show that miR-17-92 is a cell cycle regulated locus, and ectopic expression of a single microRNA (miR-17-5p) is sufficient to drive a proliferative signal in HEK293T cells. For the first time, we reveal the mechanism behind this response - miR-17-5p acts specifically at the G1/S-phase cell cycle boundary, by targeting more than 20 genes involved in the transition between these phases. While both pro- and anti-proliferative genes are targeted by miR-17-5p, pro-proliferative mRNAs are specifically up-regulated by secondary and/or tertiary effects in HEK293T cells. Conclusion: The miR-17-5p microRNA is able to act as both an oncogene and a tumor suppressor in different cellular contexts; our model of competing positive and negative signals can explain both of these activities. The coordinated suppression of proliferation-inhibitors allows miR-17-5p to efficiently de-couple negative regulators of the MAPK (mitogen activated protein kinase) signaling cascade, promoting growth in HEK293T cells. Additionally, we have demonstrated the utility of a systems biology approach as a unique and rapid approach to uncover microRNA function.

Overview

The claims and statistics of this paper haven’t been checked yet.

Run the check — free, no account needed. It reads the open-access text and checks the sources it cites.

A few free checks a day · papers already verified open instantly · results are public

Integrity signals

Registry

Crossref · 10.1186/gb-2008-9-8-r127

Cites

37 of 37 references verified0 citation errors · 0 not checkable

Statistics

Figures

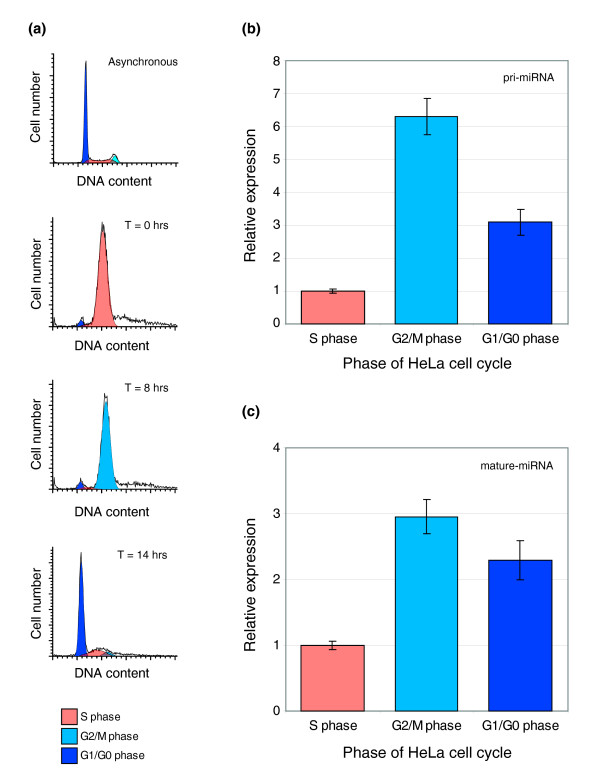
Figure 1 Phase enriched expression of the miR-17-92 locus. (a) HeLa cells were synchronized by double-thymidine block and synchrony was assessed by flow cytometry analysis of propidium iodide stained cells. DNA profiles are show from top to bottom as follows: asynchronous cells, S-phase cells (T = 0 h; synchrony >97%), G2/M phase cells (T = 8 h; synchrony >93%), and G1/GO phase cells (T = 14 h; synchrony >74%). Within each profile, cells classified as G1/G0 are depicted in dark blue, S-phase are depicted in orange, and G2/M are depicted in light blue. (b) Graph showing relative expression of miR17-92 pri-miRNAs in synchronized HeLa S phase, G2/M phase, and G1/G0 phase cell populations as assessed by qRT-PCR. (c) Graph showing relative expression of miR17-5p mature miRNAs in synchronized HeLa S phase, G2/M phase, and G1/G0 phase cell populations as assessed by qRT-PCR (mean ± SEM).
Figure 1 Phase enriched expression of the miR-17-92 locus. (a) HeLa cells were synchronized by double-thymidine block and synchrony was assessed by flow cytometry analysis of propidium iodide stained cells. DNA profiles are show from top to bottom as follows: asynchronous cells, S-phase cells (T = 0 h; synchrony >97%), G2/M phase cells (T = 8 h; synchrony >93%), and G1/GO phase cells (T = 14 h; synchrony >74%). Within each profile, cells classified as G1/G0 are depicted in dark blue, S-phase are depicted in orange, and G2/M are depicted in light blue. (b) Graph showing relative expression of miR17-92 pri-miRNAs in synchronized HeLa S phase, G2/M phase, and G1/G0 phase cell populations as assessed by qRT-PCR. (c) Graph showing relative expression of miR17-5p mature miRNAs in synchronized HeLa S phase, G2/M phase, and G1/G0 phase cell populations as assessed by qRT-PCR (mean ± SEM).CC BY · PubMed Central
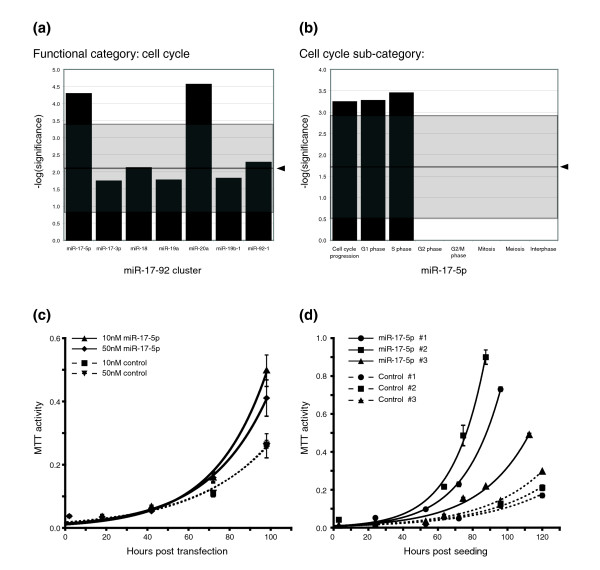
Figure 2 miR-17-5p is sufficient to drive a proliferative signal in HEK293T cells. (a) Graph displaying the significance of functional enrichment for PicTar predicted targets of miR-17-5p and miR-20a from the miR-17-92 cluster. Arrows indicate the mean significance of randomly selected gene sets of equivalent size, and the grey boxes show ± 4 standard deviations. (b) Graph displaying the significance of enrichment for genes acting at the G1/S cell cycle boundary. (c) Graph depicting the proliferation rates of HEK293T cells transiently transfected with miR-17-5p precursor dsRNA and those transfected with control dsRNA. (d) Graph depicting proliferation rates of HEK293T cells stably over-expressing plasmid-expressed miR-17-5p and HEK293T cells stably selected for the plasmid-control.
Figure 2 miR-17-5p is sufficient to drive a proliferative signal in HEK293T cells. (a) Graph displaying the significance of functional enrichment for PicTar predicted targets of miR-17-5p and miR-20a from the miR-17-92 cluster. Arrows indicate the mean significance of randomly selected gene sets of equivalent size, and the grey boxes show ± 4 standard deviations. (b) Graph displaying the significance of enrichment for genes acting at the G1/S cell cycle boundary. (c) Graph depicting the proliferation rates of HEK293T cells transiently transfected with miR-17-5p precursor dsRNA and those transfected with control dsRNA. (d) Graph depicting proliferation rates of HEK293T cells stably over-expressing plasmid-expressed miR-17-5p and HEK293T cells stably selected for the plasmid-control.CC BY · PubMed Central
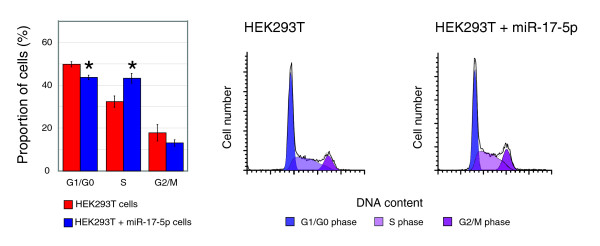
Figure 3 Over-expression of miR-17-5p alters the cell cycle profile of HEK293T cells. Graph and FACS plots displaying differences in cell cycle phases, as determined by FACS analysis, between normal and miR-7-5p expressing HEK293T cells. Cells over-expressing miR-17-5p have an altered cell cycle profile, with significantly less cells with G1/G0 DNA content, and significantly more with S-phase DNA content (mean ± SEM; asterisks indicate p ≤ 0.05 in a Student's t-test).
Figure 3 Over-expression of miR-17-5p alters the cell cycle profile of HEK293T cells. Graph and FACS plots displaying differences in cell cycle phases, as determined by FACS analysis, between normal and miR-7-5p expressing HEK293T cells. Cells over-expressing miR-17-5p have an altered cell cycle profile, with significantly less cells with G1/G0 DNA content, and significantly more with S-phase DNA content (mean ± SEM; asterisks indicate p ≤ 0.05 in a Student's t-test).CC BY · PubMed Central
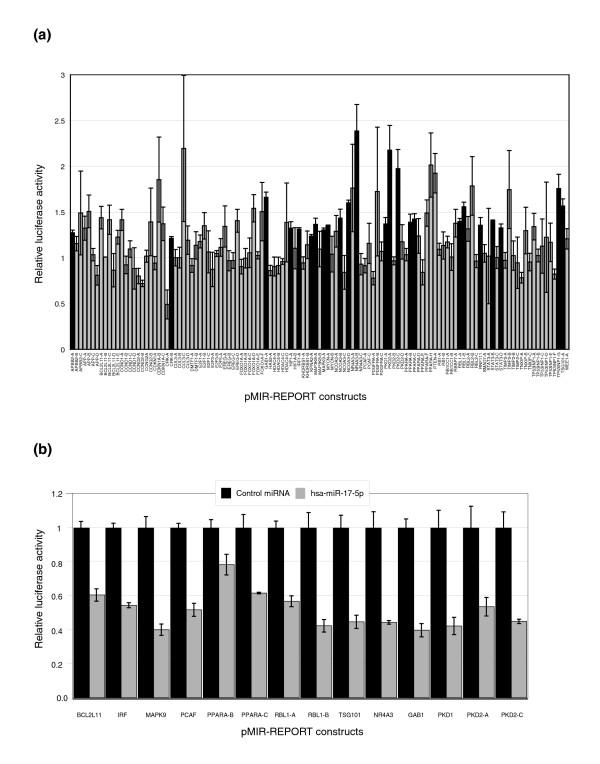
Figure 4 Validation of predicted binding sites by luciferase reporter assays. Synthetic oligonucleotides encoding 60 nucleotides that encompass predicted miRNA binding sites were cloned into luciferase reporter vectors. (a) These constructs were co-transfected into HEK293T-17-5p cells with a β-galactosidase expressing plasmid, and either a 17-5p 2'-O-Me ASO or a scrambled sequence ASO. Luciferase signals were normalized to β-galactosidase signals (as a control for transfection efficiency), and the mean and standard error relative to the scrambled ASO control are shown. Constructs that show a significant increase in luciferase expression with miR-17-5p ASO treatment (p ≤ 0.05 in a Student's t-test) are indicated in black. (b) Selected constructs were co-transfected into HEK293T (wild-type cells that express very low levels of miR-17-5p) with a β-galactosidase expressing plasmid, and either a short dsRNA precursor for miR-17-5p or a negative control dsRNA precursor. Mean and standard errors of luciferase signals normalized to β-galactosidase activity are shown, and all sites except PPARA-B show significantly less luciferase activity with miR-17-5p treatment compared to control miRNA treatment (p ≤ 0.05 in a Student's t-test).
Figure 4 Validation of predicted binding sites by luciferase reporter assays. Synthetic oligonucleotides encoding 60 nucleotides that encompass predicted miRNA binding sites were cloned into luciferase reporter vectors. (a) These constructs were co-transfected into HEK293T-17-5p cells with a β-galactosidase expressing plasmid, and either a 17-5p 2'-O-Me ASO or a scrambled sequence ASO. Luciferase signals were normalized to β-galactosidase signals (as a control for transfection efficiency), and the mean and standard error relative to the scrambled ASO control are shown. Constructs that show a significant increase in luciferase expression with miR-17-5p ASO treatment (p ≤ 0.05 in a Student's t-test) are indicated in black. (b) Selected constructs were co-transfected into HEK293T (wild-type cells that express very low levels of miR-17-5p) with a β-galactosidase expressing plasmid, and either a short dsRNA precursor for miR-17-5p or a negative control dsRNA precursor. Mean and standard errors of luciferase signals normalized to β-galactosidase activity are shown, and all sites except PPARA-B show significantly less luciferase activity with miR-17-5p treatment compared to control miRNA treatment (p ≤ 0.05 in a Student's t-test).CC BY · PubMed Central
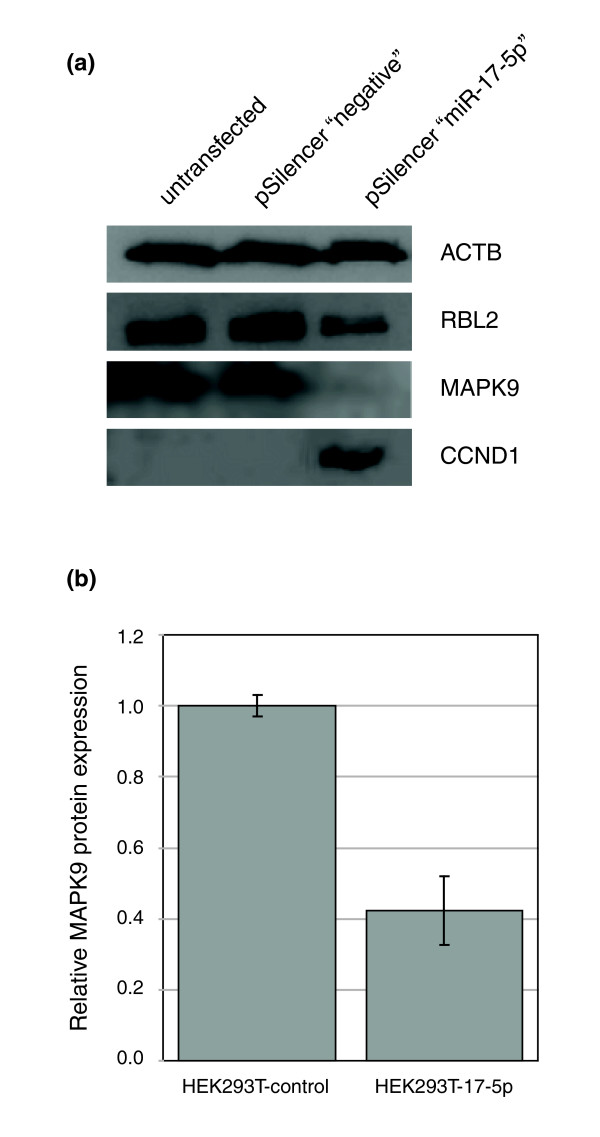
Figure 5 miR-17-5p targets MAPK9 translation. (a) Immunoblot analysis of miR-17-5p targets. Beta Actin (loading control), CCND1 and miR17-5p targets RBL2 and MAPK9 were assessed in untransfected, vector transfected and miR-17-5p transiently transfected lines. RBL2 and MAPK9 show lower protein levels while CCDN1 protein levels were dramatically increased in the miR17-5p expressing cell line. (b) Quantification of MAPK9 expression levels (assessed by immunoblot) in HEK293T-17-5p cell lines, and vector control cell lines grown under the same conditions. Mean and standard errors of independent experiments are shown (p = 0.02 in a Student's t-test).
Figure 5 miR-17-5p targets MAPK9 translation. (a) Immunoblot analysis of miR-17-5p targets. Beta Actin (loading control), CCND1 and miR17-5p targets RBL2 and MAPK9 were assessed in untransfected, vector transfected and miR-17-5p transiently transfected lines. RBL2 and MAPK9 show lower protein levels while CCDN1 protein levels were dramatically increased in the miR17-5p expressing cell line. (b) Quantification of MAPK9 expression levels (assessed by immunoblot) in HEK293T-17-5p cell lines, and vector control cell lines grown under the same conditions. Mean and standard errors of independent experiments are shown (p = 0.02 in a Student's t-test).CC BY · PubMed Central
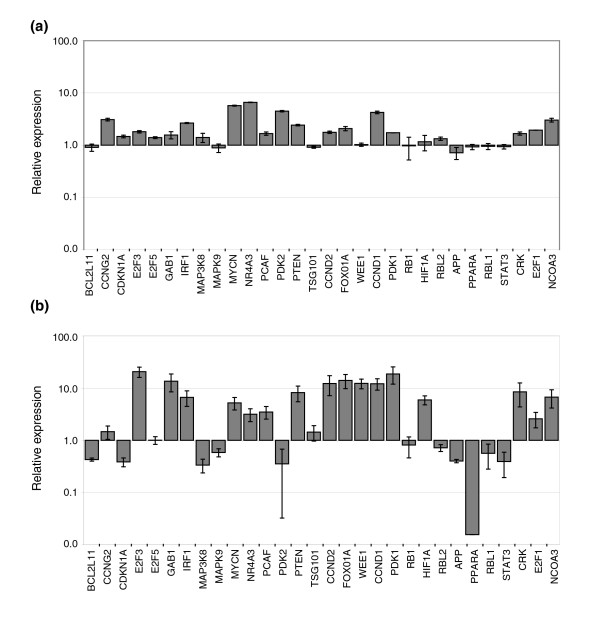
Figure 6 miR-17-5p perturbation of the transcriptional regulator network. qRT-PCR analysis of G1/S network mRNA levels, including 20 confirmed targets of miR-17-5p. (a) Cells transiently transfected with miR-17-5p dsRNA. (b) Cells with stable over-expression of plasmid-encoded miR-17-5p. In each case, the level of expression has been normalized to HPRT, and the means and standard errors are shown relative to the negative control.
Figure 6 miR-17-5p perturbation of the transcriptional regulator network. qRT-PCR analysis of G1/S network mRNA levels, including 20 confirmed targets of miR-17-5p. (a) Cells transiently transfected with miR-17-5p dsRNA. (b) Cells with stable over-expression of plasmid-encoded miR-17-5p. In each case, the level of expression has been normalized to HPRT, and the means and standard errors are shown relative to the negative control.CC BY · PubMed Central
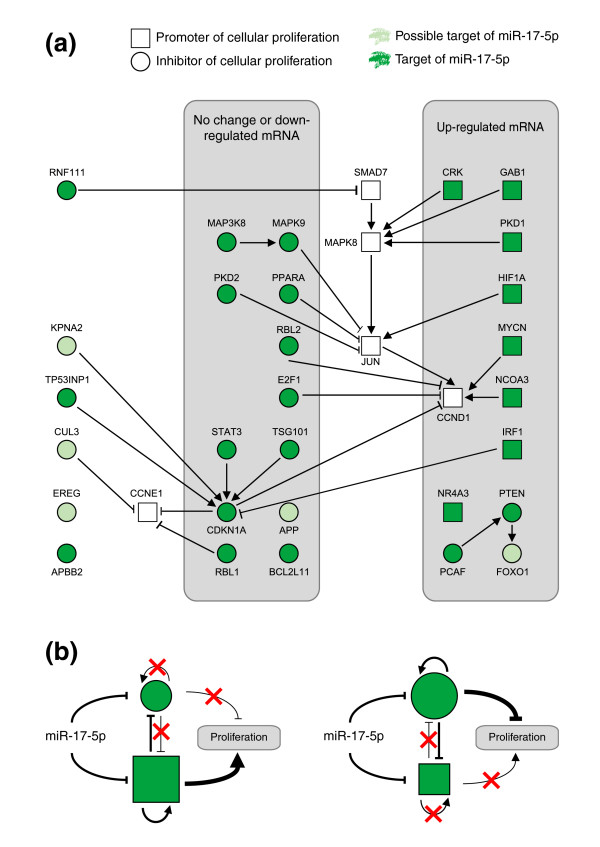
Figure 7 Network model summarizing the role of miR-17-5p in promoting cellular proliferation. (a) An integrated network model of results presented in this study. Each node present is either a possible (light green) or a confirmed/literature supported target of miR-17-5p (dark green). The shape of each node reflects whether the gene product encodes a pro-proliferative signal (square) or anti-proliferative signal (circle). The edges represent published interactions between nodes and are classified as either activation (arrowheads) or inhibition (perpendicular ends). All edges are supported by at least one reference from the literature. Finally, nodes whose mRNA levels have been examined by qRT-PCR appear in the grey boxes, and those with similar expression profiles are grouped together. This analysis shows that while miR-17-5p targets both pro- and anti-proliferative targets, pro-proliferative targets are specifically up-regulated in the HEK293T-17-5p network. (b) A proposed model depicting the ability of miR-17-5p to act as both a tumor suppressor and an oncogene, depending on the cellular context, and using the same color and shape schema as above. In a situation where pro-proliferative genes dominate (left), suppression of anti-proliferative targets is reinforced by removal of self-regulatory signals and increased suppression by pro-proliferative regulators. These signals combine and lead to a net proliferative (oncogenic) outcome. In situations where anti-proliferative genes dominate (right), suppression of pro-proliferative signals is reinforced, leading to a net anti-proliferative signal. In this case, removal of miR-17-5p results in a pro-proliferative signal - a classic tumor suppressor outcome.
Figure 7 Network model summarizing the role of miR-17-5p in promoting cellular proliferation. (a) An integrated network model of results presented in this study. Each node present is either a possible (light green) or a confirmed/literature supported target of miR-17-5p (dark green). The shape of each node reflects whether the gene product encodes a pro-proliferative signal (square) or anti-proliferative signal (circle). The edges represent published interactions between nodes and are classified as either activation (arrowheads) or inhibition (perpendicular ends). All edges are supported by at least one reference from the literature. Finally, nodes whose mRNA levels have been examined by qRT-PCR appear in the grey boxes, and those with similar expression profiles are grouped together. This analysis shows that while miR-17-5p targets both pro- and anti-proliferative targets, pro-proliferative targets are specifically up-regulated in the HEK293T-17-5p network. (b) A proposed model depicting the ability of miR-17-5p to act as both a tumor suppressor and an oncogene, depending on the cellular context, and using the same color and shape schema as above. In a situation where pro-proliferative genes dominate (left), suppression of anti-proliferative targets is reinforced by removal of self-regulatory signals and increased suppression by pro-proliferative regulators. These signals combine and lead to a net proliferative (oncogenic) outcome. In situations where anti-proliferative genes dominate (right), suppression of pro-proliferative signals is reinforced, leading to a net anti-proliferative signal. In this case, removal of miR-17-5p results in a pro-proliferative signal - a classic tumor suppressor outcome.CC BY · PubMed Central

Verification

Claims the paper makes

The claims and statistics of this paper haven’t been checked yet.

Run the check — free, no account needed. It reads the open-access text and checks the sources it cites.

A few free checks a day · papers already verified open instantly · results are public

Claims other papers make about this one

Each is checked against this paper’s own text: does it say what the citing paper says it does?

Self-check

Percentages, sums and reported differences re-computed from the paper’s own numbers.

The self-check needs the paper’s full text.

Citations

Cites

1 retracted

Show all 39 references

Research works printed but not linked: 1

  1. Oswald F, Lovec H, Moroy T, Lipp M: E2f-Dependent Regulation of Human Myc - Transactivation by Cyclin-D1 and Cyclin-a Overrides Tumor-Suppressor Protein Functions. Oncogene. 1994, 9: 2029-2036.

Cited by

Sorted by citations

Items 301–305 of 305

Metadata

Authors
Cloonan, N., Brown, M. K., Steptoe, A. L., Wani, S., Chan, W. L., Forrest, A. R., Kolle, G., Gabrielli, B., & Grimmond, S. M.
Affiliations
  • The University of Queensland (AU)
  • Princess Alexandra Hospital (AU)
Corresponding author
Grimmond, Sean M
Venue
Genome Biology
Published
2008-08-14
Volume
9
Issue
8
Pages
R127-R127
ISSN
  • 1465-6906 (ISSN-L)
  • 1474-760X
OpenAlex
W2108836814
Cited by
304
References
39
Citations by year
2026: 5 · 2025: 8 · 2024: 7 · 2023: 12 · 2022: 18 · 2021: 15 · 2020: 21 · 2019: 14 · 2018: 19 · 2017: 12 · 2016: 11 · 2015: 19 · 2014: 24 · 2013: 27 · 2012: 25
FWCI
7.52
Type
journal article
Language
en
Open access
Locations
  • Genome biology (publishedVersion, cc-by)
  • PubMed Central (publishedVersion, cc-by)
  • PubMed (publishedVersion)
  • Minerva Access (University of Melbourne) (submittedVersion, cc-by)
  • Griffith Research Online (submittedVersion, cc-by)
Funders
National Health and Medical Research Council (456140)
Topics
  • Life Sciences › Biochemistry, Genetics and Molecular Biology › Cancer Research › MicroRNA in disease regulation
  • Health Sciences › Medicine › Oncology › Cancer-related Molecular Pathways
  • Life Sciences › Biochemistry, Genetics and Molecular Biology › Cancer Research › Cancer-related molecular mechanisms research
Keywords
miR-17-5p, miR-17-92 cluster, microRNA, G1/S transition, cell cycle regulation, oncogenic microRNA, tumor suppressor, MAPK signaling, cell proliferation, HEK293T cells, systems biology, miRNA target genes
MeSH terms
Cell Line, Humans, RNA, Messenger, Protein Biosynthesis, Signal Transduction, G1 Phase, S Phase, MicroRNAs, Mitogen-Activated Protein Kinase 9, Cell Proliferation

About these checks

Registry, retraction, Cites and statistics results are computed, not judged, with one exception: a printed reference that no index lists is read once by a model before it counts as a citation error. Claims are extracted by a model and kept only when their quote appears verbatim in the text; each cited source is then checked, with a model’s help, for whether it says what the claim relies on. Those verdicts can be wrong — read the claim’s quote and the cited source before relying on one.

Statistics and arithmetic are recomputed, not judged.

Confidence bands are shown only for fields calibrated on our annotated test set. None is calibrated yet, so no band is shown.

What counts as a claim ›How we measure confidence ›How we check this ›

Are you an author, or do you see a problem with this page? Request a review