

The DOI matches its Crossref record; 78 of the 79 references it cites were found in a registry or an index.
MicroRNAs and their isomiRs function cooperatively to target common biological pathways
Open accessAbstract
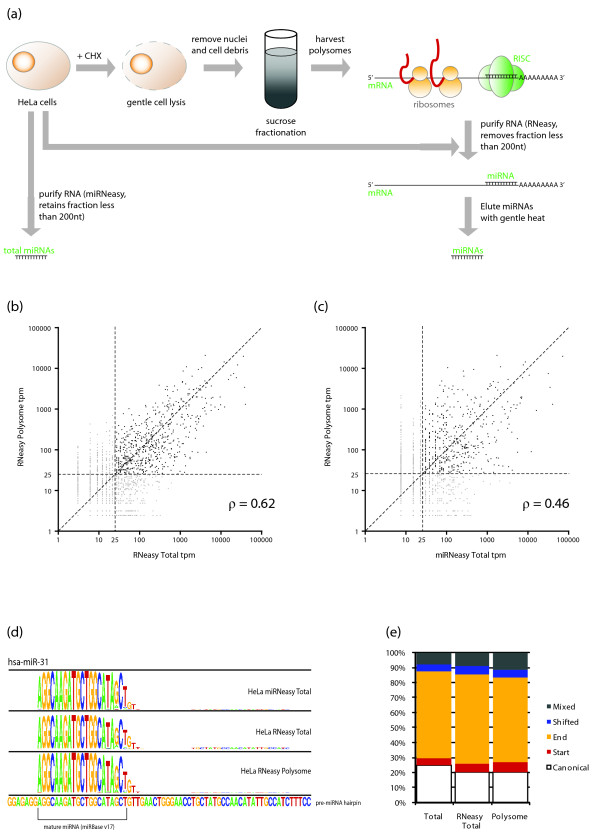
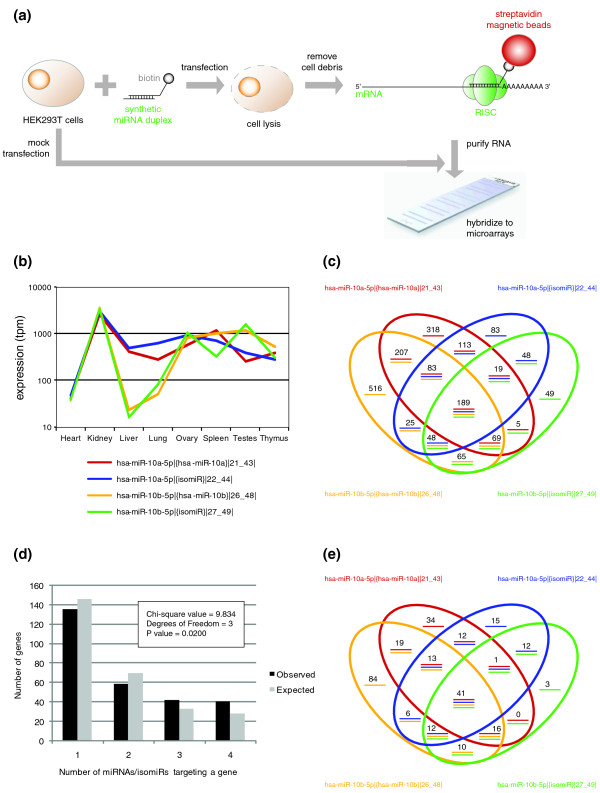
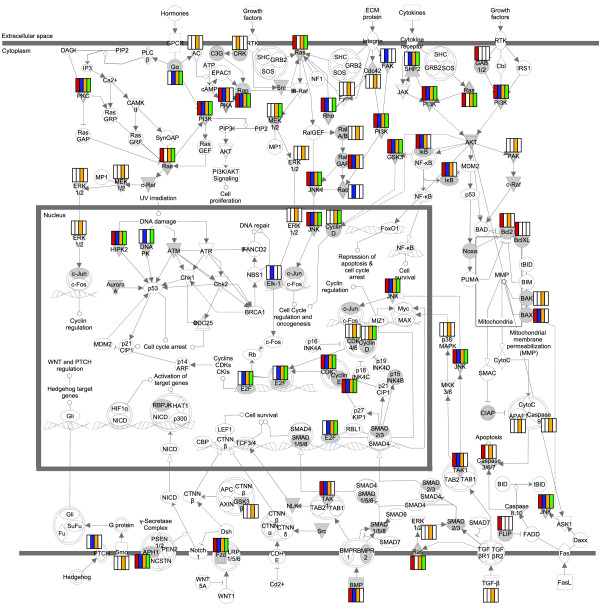
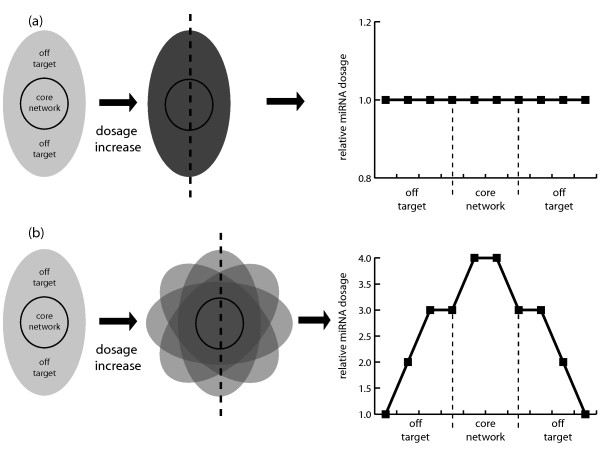
Background: Variants of microRNAs (miRNAs), called isomiRs, are commonly reported in deep-sequencing studies; however, the functional significance of these variants remains controversial. Observational studies show that isomiR patterns are non-random, hinting that these molecules could be regulated and therefore functional, although no conclusive biological role has been demonstrated for these molecules. Results: To assess the biological relevance of isomiRs, we have performed ultra-deep miRNA-seq on ten adult human tissues, and created an analysis pipeline called miRNA-MATE to align, annotate, and analyze miRNAs and their isomiRs. We find that isomiRs share sequence and expression characteristics with canonical miRNAs, and are generally strongly correlated with canonical miRNA expression. A large proportion of isomiRs potentially derive from AGO2 cleavage independent of Dicer. We isolated polyribosome-associated mRNA, captured the mRNA-bound miRNAs, and found that isomiRs and canonical miRNAs are equally associated with translational machinery. Finally, we transfected cells with biotinylated RNA duplexes encoding isomiRs or their canonical counterparts and directly assayed their mRNA targets. These studies allow us to experimentally determine genome-wide mRNA targets, and these experiments showed substantial overlap in functional mRNA networks suppressed by both canonical miRNAs and their isomiRs. Conclusions: Together, these results find isomiRs to be biologically relevant and functionally cooperative partners of canonical miRNAs that act coordinately to target pathways of functionally related genes. This work exposes the complexity of the miRNA-transcriptome, and helps explain a major miRNA paradox: how specific regulation of biological processes can occur when the specificity of miRNA targeting is mediated by only 6 to 11 nucleotides.
Overview
The claims and statistics of this paper haven’t been checked yet.
Run the check — free, no account needed. It reads the open-access text and checks the sources it cites.
Integrity signals
Registry
Cites
Statistics
Figures
Verification
Claims the paper makes
The claims and statistics of this paper haven’t been checked yet.
Run the check — free, no account needed. It reads the open-access text and checks the sources it cites.
Claims other papers make about this one
Each is checked against this paper’s own text: does it say what the citing paper says it does?
The source backs part of the claim, not all of it — or backs it for a different population, condition or comparison.
In the citing paper
“Next, because of the use of a primer targeted to the miRNA, the final reads reflect amplified products and have lost the original miRNA sequence present in the miRNA:mRNA chimeric molecule, leading to loss of information about differential targeting of miRNA family members (which often only contain a single nucleotide difference), and isomiRs or other variations which have been described to play”
From Scalable and deep profiling of mRNA targets for individual microRNAs with chimeric eCLIP (2022) · cites this paper as Cloonan et al., 2011
Experimental — accuracy not yet measuredThe cited source says what the claim attributes to it.
In the citing paper
“However, NGS analysis would enable to detect presently unknown miRNAs as well miRNAs iso-forms that have demonstrated to target biological pathways in a cooperative manner (16).”
From Distribution of miRNA expression across human tissues (2016) · cites this paper as [16]
Self-check
Percentages, sums and reported differences re-computed from the paper’s own numbers.
The self-check needs the paper’s full text.
Citations
Cites
MicroRNAs: Target Recognition and Regulatory Functions
Bartel, D. P. (2009) · Cell · doi:10.1016/j.cell.2009.01.002 · Cited by 20,068
Mapping and quantifying mammalian transcriptomes by RNA-Seq
Mortazavi, A., Williams, B. A., McCue, K., Schaeffer, L., & Wold, B. (2008) · Nature Methods · doi:10.1038/nmeth.1226 · Cited by 13,696
Lewis, B. P., Burge, C. B., & Bartel, D. P. (2005) · Cell · doi:10.1016/j.cell.2004.12.035 · Cited by 11,855
A scaling normalization method for differential expression analysis of RNA-seq data
Robinson, M. D., & Oshlack, A. (2010) · Genome Biology · doi:10.1186/gb-2010-11-3-r25 · Cited by 7,876
Prediction of Mammalian MicroRNA Targets
Lewis, B. P., Shih, I.-H., Jones-Rhoades, M. W., Bartel, D. P., & Burge, C. B. (2003) · Cell · doi:10.1016/s0092-8674(03)01018-3 · Cited by 5,199
The widespread regulation of microRNA biogenesis, function and decay
Krol, J., Loedige, I., & Filipowicz, W. (2010) · Nature Reviews Genetics · doi:10.1038/nrg2843 · Cited by 4,672
Combinatorial microRNA target predictions
Krek, A., Grün, D., Poy, M. N., Wolf, R., Rosenberg, L., Epstein, E. J., MacMenamin, P., da Piedade, I., Gunsalus, K. C., Stoffel, M., et al. (2005) · Nature Genetics · doi:10.1038/ng1536 · Cited by 4,603
A microRNA polycistron as a potential human oncogene
He, L., Thomson, J. M., Hemann, M. T., Hernando, E., Mu, D., Goodson, S. G., Powers, S., Cordon‐Cardo, C., Lowe, S. W., Hannon, G. J., et al. (2005) · Nature · doi:10.1038/nature03552 · Cited by 3,642
miRBase: integrating microRNA annotation and deep-sequencing data
Kozomara, A., & Griffiths-Jones, S. (2011) · Nucleic Acids Research · doi:10.1093/nar/gkq1027 · Cited by 3,634
MicroRNAs Modulate Hematopoietic Lineage Differentiation
Chen, C.-Z., Li, L., Lodish, H. F., & Bartel, D. P. (2004) · Science · doi:10.1126/science.1091903 · Cited by 3,257
Research works printed but not linked: 1
- Maroney PA, Yu Y, Fisher J, Nilsen TW: Evidence that microRNAs are associated with translating messenger RNAs in human cells. Nat Struct Mol Biol. 2006, 13: 1102-1107. 10.1038/nsmb1174. · DOI
Cited by
Sorted by citations
Regulation of microRNA function in animals
Gebert, L. F. R., & MacRae, I. J. (2019) · Nature Reviews Molecular Cell Biology · doi:10.1038/s41580-018-0045-7 · Cited by 2,284
MicroRNA profiling: approaches and considerations
Pritchard, C. C., Cheng, H. H., & Tewari, M. (2012) · Nature Reviews Genetics · doi:10.1038/nrg3198 · Cited by 1,765
Distribution of miRNA expression across human tissues
Ludwig, N., Leidinger, P., Becker, K., Backes, C., Fehlmann, T., Pallasch, C., Rheinheimer, S., Meder, B., Stähler, C., Meese, E., et al. (2016) · Nucleic Acids Research · doi:10.1093/nar/gkw116 · Cited by 968
A network-biology perspective of microRNA function and dysfunction in cancer
Bracken, C. P., Scott, H. S., & Goodall, G. J. (2016) · Nature Reviews Genetics · doi:10.1038/nrg.2016.134 · Cited by 688
ShortStack: Comprehensive annotation and quantification of small RNA genes
Axtell, M. J. (2013) · RNA · doi:10.1261/rna.035279.112 · Cited by 514
Metadata
- Authors
- Cloonan, N., Wani, S., Xu, Q., Gu, J., Lea, K., Heater, S., Barbacioru, C., Steptoe, A. L., Martin, H. C., Nourbakhsh, E., Krishnan, K., Gardiner, B., Wang, X., Nones, K., Steen, J. A., Matigian, N. A., Wood, D. L., Kassahn, K. S., Waddell, N., Shepherd, J., Lee, C., Ichikawa, J., McKernan, K., Bramlett, K., Kuersten, S., & Grimmond, S. M.
- Affiliations
- The University of Queensland (AU)
- Corresponding author
- Cloonan, Nicole
- Kuersten, Scott
- Grimmond, Sean M
- ORCID
- Venue
- Genome Biology
- Published
- 2011-12-30
- Volume
- 12
- Issue
- 12
- Pages
- R126-R126
- ISSN
- 1465-6906 (ISSN-L)
- 1474-760X
- PMC
- PMC3334621
- OpenAlex
- W2119942258
- Cited by
- 345
- References
- 79
- Citations by year
- 2026: 6 · 2025: 13 · 2024: 12 · 2023: 13 · 2022: 24 · 2021: 21 · 2020: 29 · 2019: 27 · 2018: 21 · 2017: 35 · 2016: 23 · 2015: 29 · 2014: 34 · 2013: 39 · 2012: 19
- FWCI
- 10.01
- Type
- journal article
- Language
- en
- Open access
- gold
- doi.org
- Locations
- Genome biology (publishedVersion, cc-by)
- Europe PMC (PubMed Central) (publishedVersion, cc-by)
- PubMed Central (publishedVersion, cc-by)
- PubMed (publishedVersion)
- Kent Academic Repository (University of Kent) (acceptedVersion)
- Minerva Access (University of Melbourne) (submittedVersion, cc-by)
- Griffith Research Online (submittedVersion, cc-by)
- Funders
- Medical Research Council
- Australian Research Council (DP0988754, DP1093164)
- National Health and Medical Research Council
- Topics
- Life Sciences › Biochemistry, Genetics and Molecular Biology › Cancer Research › MicroRNA in disease regulation
- Life Sciences › Agricultural and Biological Sciences › Plant Science › Plant Molecular Biology Research
- Life Sciences › Biochemistry, Genetics and Molecular Biology › Molecular Biology › RNA Research and Splicing
- Keywords
- microRNA isomiRs, miRNA target networks
- MeSH terms
- Base Sequence, HeLa Cells, Humans, Molecular Sequence Data, RNA, Messenger, Transfection, Sequence Alignment, Biotinylation, Oligonucleotide Array Sequence Analysis, Gene Expression Profiling, MicroRNAs, Ribonuclease III, Gene Regulatory Networks, DEAD-box RNA Helicases, HEK293 Cells, High-Throughput Nucleotide Sequencing, Transcriptome, Argonaute Proteins
About these checks
Registry, retraction, Cites and statistics results are computed, not judged, with one exception: a printed reference that no index lists is read once by a model before it counts as a citation error. Claims are extracted by a model and kept only when their quote appears verbatim in the text; each cited source is then checked, with a model’s help, for whether it says what the claim relies on. Those verdicts can be wrong — read the claim’s quote and the cited source before relying on one.
Statistics and arithmetic are recomputed, not judged.
Confidence bands are shown only for fields calibrated on our annotated test set. None is calibrated yet, so no band is shown.
What counts as a claim ›How we measure confidence ›How we check this ›
Are you an author, or do you see a problem with this page? Request a review
