

The DOI matches its Crossref record; 47 of the 47 references it cites were found in a registry or an index.
Postural orientation and equilibrium processes associated with increased postural sway in autism spectrum disorder (ASD)
Open accessAbstract
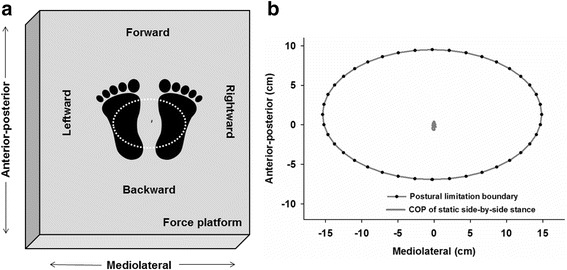
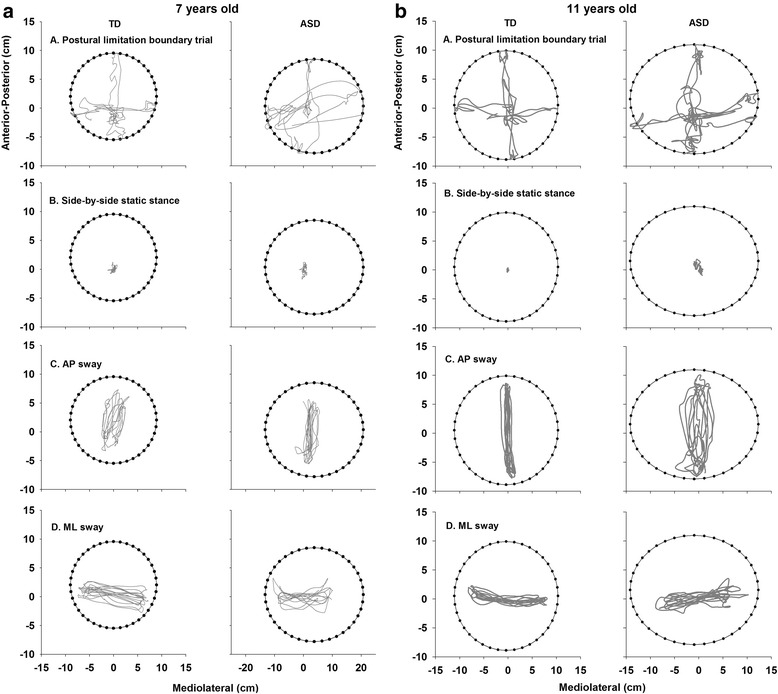
BACKGROUND: Increased postural sway has been repeatedly documented in children with autism spectrum disorder (ASD). Characterizing the control processes underlying this deficit, including postural orientation and equilibrium, may provide key insights into neurophysiological mechanisms associated with ASD. Postural orientation refers to children's ability to actively align their trunk and head with respect to their base of support, while postural equilibrium is an active process whereby children coordinate ankle dorsi-/plantar-flexion and hip abduction/adduction movements to stabilize their upper body. Dynamic engagement of each of these control processes is important for maintaining postural stability, though neither postural orientation nor equilibrium has been studied in ASD. METHODS: Twenty-two children with ASD and 21 age and performance IQ-matched typically developing (TD) controls completed three standing tests. During static stance, participants were instructed to stand as still as possible. During dynamic stances, participants swayed at a comfortable speed and magnitude in either anterior-posterior (AP) or mediolateral (ML) directions. The center of pressure (COP) standard deviation and trajectory length were examined to determine if children with ASD showed increased postural sway. Postural orientation was assessed using a novel virtual time-to-contact (VTC) approach that characterized spatiotemporal dimensions of children's postural sway (i.e., body alignment) relative to their postural limitation boundary, defined as the maximum extent to which each child could sway in each direction. Postural equilibrium was quantified by evaluating the amount of shared or mutual information of COP time series measured along the AP and ML directions. RESULTS: Consistent with prior studies, children with ASD showed increased postural sway during both static and dynamic stances relative to TD children. In regard to postural orientation processes, children with ASD demonstrated reduced spatial perception of their postural limitation boundary towards target directions and reduced time to correct this error during dynamic postural sways but not during static stance. Regarding postural equilibrium, they showed a compromised ability to decouple ankle dorsi-/plantar-flexion and hip abduction/adduction processes during dynamic stances. CONCLUSIONS: These results suggest that deficits in both postural orientation and equilibrium processes contribute to reduced postural stability in ASD. Specifically, increased postural sway in ASD appears to reflect patients' impaired perception of their body movement relative to their own postural limitation boundary as well as a reduced ability to decouple distinct ankle and hip movements to align their body during standing. Our findings that deficits in postural orientation and equilibrium are more pronounced during dynamic compared to static stances suggests that the increased demands of everyday activities in which children must dynamically shift their COP involve more severe postural control deficits in ASD relative to static stance conditions that often are studied. Systematic assessment of dynamic postural control processes in ASD may provide important insights into new treatment targets and neurodevelopmental mechanisms.
Overview
The claims and statistics of this paper haven’t been checked yet.
Free: it reads the open-access text and checks the first 5 claims that cite a source we can check. Create a free account to check every claim.
Integrity signals
Registry
Cites
Statistics
Figures



Verification
Claims the paper makes
The claims and statistics of this paper haven’t been checked yet.
Free: it reads the open-access text and checks the first 5 claims that cite a source we can check. Create a free account to check every claim.
Claims other papers make about this one
Each is checked against this paper’s own text: does it say what the citing paper says it does?
The source backs part of the claim, not all of it — or backs it for a different population, condition or comparison.
In the citing paper
“Other studies [44, 47] associated instability, higher COP variability, reduced motor independence, and anticipatory adjustments with repetitive behaviours.”
From Static and dynamic balance in children and adolescents with autism spectrum disorder compared with typically developing peers: a systematic review and meta-analysis (2026) · cites this paper as [44]
Experimental — accuracy not yet measuredThe cited source says what the claim attributes to it.
In the citing paper
“Twenty-nine studies used instrumental tools, [11, 12, 14, 24–48] while 11 employed observational assessments. [14, 26, 28, 32, 34, 38, 44, 49, 51–53]”
The check wasn’t confident either way, so it gives no verdict — never disputed.
In the citing paper
“Highest-quality studies were Surgent et al. [44], (13/14) and Abdel-Ghafar et al. [29] and Ghanouni et al. [25] (11/13).”
From Static and dynamic balance in children and adolescents with autism spectrum disorder compared with typically developing peers: a systematic review and meta-analysis (2026) · cites this paper as [44]
Experimental — accuracy not yet measured
Self-check
Percentages, sums and reported differences re-computed from the paper’s own numbers.
The self-check needs the paper’s full text.
Citations
Cites
Lord, C., Rutter, M., & Le Couteur, A. (1994) · Journal of Autism and Developmental Disorders · doi:10.1007/bf02172145 · Cited by 9,065
Horak, F. B. (2006) · Age and Ageing · doi:10.1093/ageing/afl077 · Cited by 2,758
Measures of postural steadiness: differences between healthy young and elderly adults
Prieto, T. E., Myklebust, J. B., Hoffmann, R. G., Lovett, E. G., & Myklebust, B. M. (1996) · IEEE Transactions on Biomedical Engineering · doi:10.1109/10.532130 · Cited by 1,863
Autism Diagnostic Observation Schedule
Lord, C., Rutter, M., Goode, S., Heemsbergen, J., Jordan, H., Mawhood, L., & Schopler, E. (2016) · PsycTESTS Dataset · doi:10.1037/t54175-000 · Cited by 1,678
Autism screening questionnaire: diagnostic validity
Berument, S. K., Rutter, M., Lord, C., Pickles, A., & Bailey, A. (1999) · British Journal of Psychiatry · doi:10.1192/bjp.175.5.444 · Cited by 1,464
Unified theory regarding A/P and M/L balance in quiet stance
Winter, D. A., Prince, F., Frank, J. S., Powell, C., & Zabjek, K. F. (1996) · Journal of Neurophysiology · doi:10.1152/jn.1996.75.6.2334 · Cited by 1,163
Why Do Autistic Individuals Show Superior Performance on the Block Design Task?
Shah, A., & Frith, U. (1993) · Journal of Child Psychology and Psychiatry · doi:10.1111/j.1469-7610.1993.tb02095.x · Cited by 935
Center of mass velocity-position predictions for balance control
Pai, Y.-C., & Patton, J. (1997) · Journal of Biomechanics · doi:10.1016/s0021-9290(96)00165-0 · Cited by 757
Massion, J. (1994) · Current Opinion in Neurobiology · doi:10.1016/0959-4388(94)90137-6 · Cited by 747
Prevalence of motor impairment in autism spectrum disorders
Ming, X., Brimacombe, M., & Wagner, G. C. (2007) · Brain and Development · doi:10.1016/j.braindev.2007.03.002 · Cited by 613
Research works printed but not linked: 3
- Wechsler D. Wechsler Abbreviated Scale of Intelligence: Psychological Corporation. 1999.
- Wechsler D. Wechsler Abbreviated Scale of Intelligence—second edition—(WASI-II). San Antonio, TX: Pearson Education; 2011.
- Bodfish JW, Parker DE, Lewis MH, et al. Stereotypy and motor control: differences in the postural stability dynamics of persons with stereotyped and dyskinetic movement disorders. Am J Ment Retard. 2001;106:123–34. · doi:10.1352/0895-8017(2001)106
Cited by
Wang, L. A. L., Petrulla, V., Zampella, C., Waller, R. E., & Schultz, R. T. (2022) · Psychological Bulletin · doi:10.1037/bul0000358 · Cited by 171
Postural control processes during standing and step initiation in autism spectrum disorder
Bojanek, E. K., Wang, Z., White, S. P., & Mosconi, M. W. (2020) · Journal of Neurodevelopmental Disorders · doi:10.1186/s11689-019-9305-x · Cited by 57
Self-citationOdeh, C. E., Gladfelter, A. L., Stoesser, C., & Roth, S. (2022) · International Journal of Developmental Disabilities · doi:10.1080/20473869.2020.1764241 · Cited by 51
Motor skills predict adaptive behavior in autistic children and adolescents
Fears, N. E., Palmer, S. A., & Miller, H. L. (2022) · Autism Research · doi:10.1002/aur.2708 · Cited by 45
Lepping, R. J., McKinney, W. S., Magnon, G. C., Keedy, S., Wang, Z., Coombes, S. A., Vaillancourt, D. E., Sweeney, J. A., & Mosconi, M. W. (2021) · Human Brain Mapping · doi:10.1002/hbm.25692 · Cited by 45
Self-citation
Metadata
- Authors
- Wang, Z., Hallac, R. R., Conroy, K. C., White, S. P., Kane, A. A., Collinsworth, A. L., Sweeney, J. A., & Mosconi, M. W.
- Affiliations
- University of Kansas (US)
- Children's Medical Center (US)
- The University of Texas Southwestern Medical Center (US)
- University of Cincinnati (US)
- Corresponding author
- Wang, Zheng
- ORCID
- Venue
- Journal of Neurodevelopmental Disorders
- Published
- 2016-11-25
- Volume
- 8
- Issue
- 1
- Pages
- 43-43
- ISSN
- 1866-1947 (ISSN-L)
- 1866-1955
- PMC
- PMC5124312
- OpenAlex
- W2549845568
- Cited by
- 53
- References
- 47
- Citations by year
- 2026: 3 · 2025: 8 · 2024: 4 · 2023: 7 · 2022: 5 · 2021: 11 · 2020: 6 · 2019: 5 · 2018: 1 · 2017: 3
- FWCI
- 1.91
- Type
- journal article
- Language
- en
- Open access
- gold
- doi.org
- Licence
- cc-by
- creativecommons.org/licenses/by/4.0/ (tdm)
- creativecommons.org/licenses/by/4.0/ (vor)
- Locations
- Journal of Neurodevelopmental Disorders (publishedVersion, cc-by)
- PubMed Central (publishedVersion, cc-by)
- PubMed (publishedVersion)
- KU ScholarWorks (University of Kansas) (submittedVersion, cc-by)
- Funders
- University of Kansas (Kansas Center for Autism Research and Training Research Investment Council Strategic Initiative Grant)
- National Institute of Mental Health (MH092696)
- Topics
- Life Sciences › Neuroscience › Cognitive Neuroscience › Autism Spectrum Disorder Research
- Health Sciences › Health Professions › Physical Therapy, Sports Therapy and Rehabilitation › Balance, Gait, and Falls Prevention
- Social Sciences › Psychology › Developmental and Educational Psychology › Children's Physical and Motor Development
- Keywords
- autism spectrum disorder, postural sway, postural orientation, postural stability, center of pressure, static posture, children, postural control
About these checks
Registry, retraction, Cites and statistics results are computed, not judged, with one exception: a printed reference that no index lists is read once by a model before it counts as a citation error. Claims are extracted by a model and kept only when their quote appears verbatim in the text; each cited source is then checked, with a model’s help, for whether it says what the claim relies on. Those verdicts can be wrong — read the claim’s quote and the cited source before relying on one.
Statistics and arithmetic are recomputed, not judged.
Confidence bands are shown only for fields calibrated on our annotated test set. None is calibrated yet, so no band is shown.
What counts as a claim ›How we measure confidence ›How we check this ›
Are you an author, or do you see a problem with this page? Request a review
How to cite
Cite CoChat for the checks on this page, and the paper for its own findings.
- This page
- CoChat. (2026). Citation check: Postural orientation and equilibrium processes associated with increased postural sway in autism spectrum disorder (ASD). https://app.cochat.ai/papers/10.1186/s11689-016-9178-1
- The paper
- Wang, Z., Hallac, R. R., Conroy, K. C., White, S. P., Kane, A. A., Collinsworth, A. L., Sweeney, J. A., & Mosconi, M. W. (2016). Postural orientation and equilibrium processes associated with increased postural sway in autism spectrum disorder (ASD). Journal of Neurodevelopmental Disorders. https://doi.org/10.1186/s11689-016-9178-1
Data sources
Bibliographic data: Semantic Scholar, OpenAlex, Crossref.
Contains information from the Semantic Scholar Academic Graph Datasets, made available under the ODC Attribution License (ODC-BY 1.0).
Semantic Scholar’s data is described in: Kinney, R., et al. (2023). The Semantic Scholar Open Data Platform. arXiv:2301.10140.
