

The DOI matches its Crossref record; 84 of the 84 references it cites were found in a registry or an index.
3D deep convolutional neural networks for amino acid environment similarity analysis
Open accessAbstract
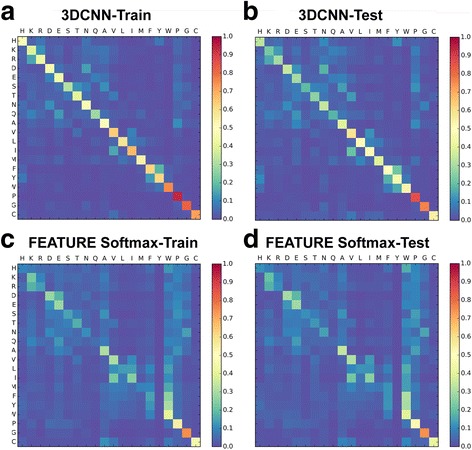
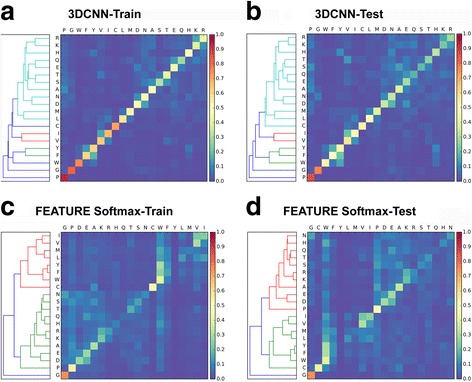
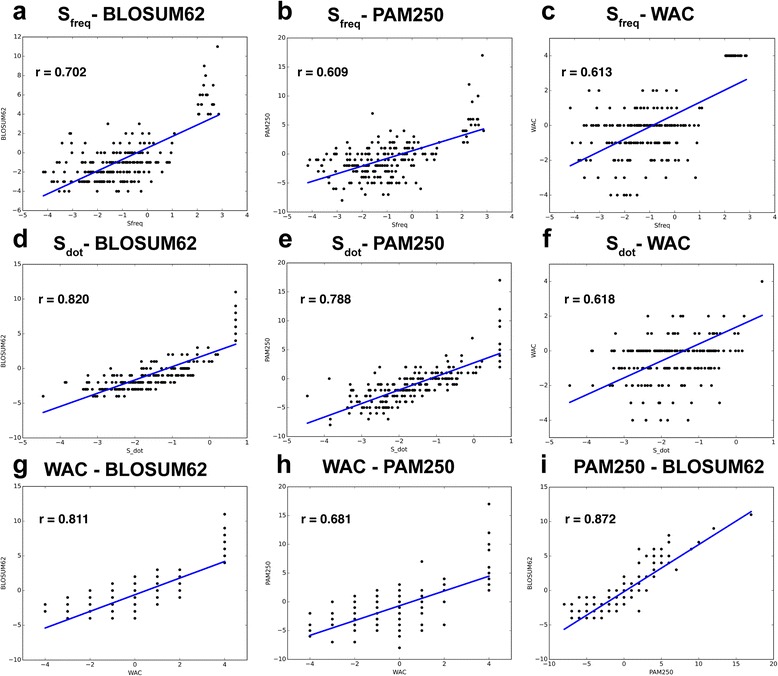
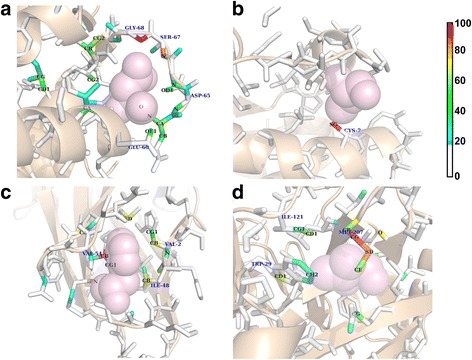
BACKGROUND: Central to protein biology is the understanding of how structural elements give rise to observed function. The surfeit of protein structural data enables development of computational methods to systematically derive rules governing structural-functional relationships. However, performance of these methods depends critically on the choice of protein structural representation. Most current methods rely on features that are manually selected based on knowledge about protein structures. These are often general-purpose but not optimized for the specific application of interest. In this paper, we present a general framework that applies 3D convolutional neural network (3DCNN) technology to structure-based protein analysis. The framework automatically extracts task-specific features from the raw atom distribution, driven by supervised labels. As a pilot study, we use our network to analyze local protein microenvironments surrounding the 20 amino acids, and predict the amino acids most compatible with environments within a protein structure. To further validate the power of our method, we construct two amino acid substitution matrices from the prediction statistics and use them to predict effects of mutations in T4 lysozyme structures. RESULTS: Our deep 3DCNN achieves a two-fold increase in prediction accuracy compared to models that employ conventional hand-engineered features and successfully recapitulates known information about similar and different microenvironments. Models built from our predictions and substitution matrices achieve an 85% accuracy predicting outcomes of the T4 lysozyme mutation variants. Our substitution matrices contain rich information relevant to mutation analysis compared to well-established substitution matrices. Finally, we present a visualization method to inspect the individual contributions of each atom to the classification decisions. CONCLUSIONS: End-to-end trained deep learning networks consistently outperform methods using hand-engineered features, suggesting that the 3DCNN framework is well suited for analysis of protein microenvironments and may be useful for other protein structural analyses.
Overview
The claims and statistics of this paper haven’t been checked yet.
Run the check — free, no account needed. It reads the open-access text and checks the sources it cites.
Integrity signals
Registry
Cites
Statistics
Figures
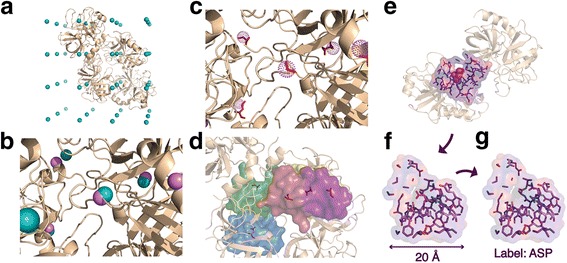
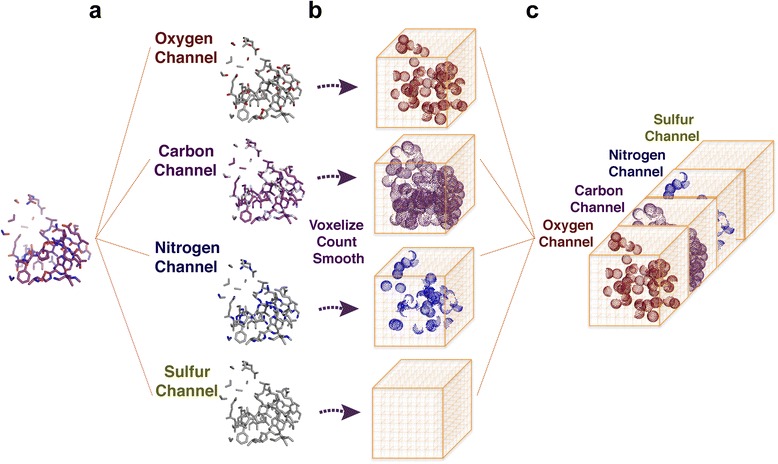
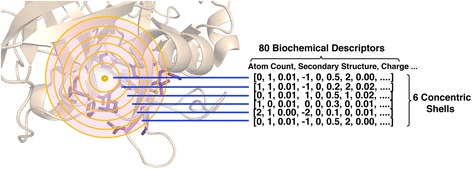
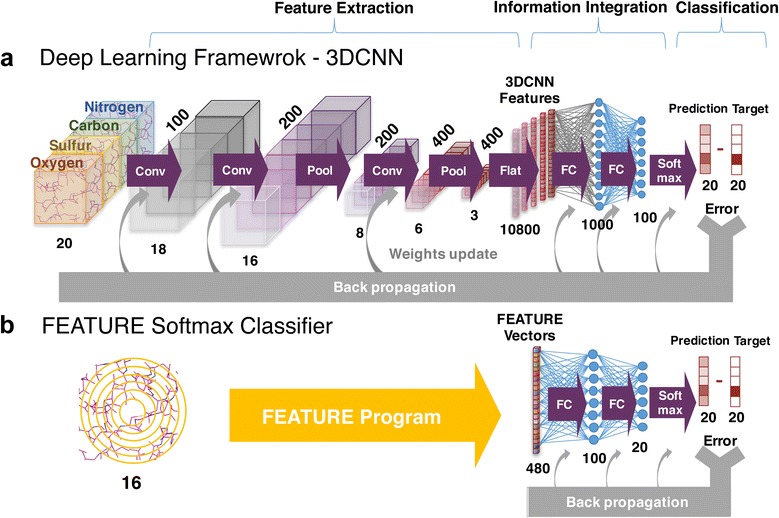
Verification
Claims the paper makes
The claims and statistics of this paper haven’t been checked yet.
Run the check — free, no account needed. It reads the open-access text and checks the sources it cites.
Claims other papers make about this one
Each is checked against this paper’s own text: does it say what the citing paper says it does?
In the citing paper
“We have previously shown that 3DCNNs can extract meaningful features of amino acid microenvironments directly from raw atom distribution 12 .”
From Graph Convolutional Neural Networks for Predicting Drug-Target Interactions (2019) · cites this paper as [12]
Self-check
Percentages, sums and reported differences re-computed from the paper’s own numbers.
The self-check needs the paper’s full text.
Citations
Cites
ImageNet classification with deep convolutional neural networks
Krizhevsky, A., Sutskever, I., & Hinton, G. E. (2017) · Communications of the ACM · doi:10.1145/3065386 · Cited by 112,155
LeCun, Y., Bengio, Y., & Hinton, G. (2015) · Nature · doi:10.1038/nature14539 · Cited by 84,126
Cortes, C., & Vapnik, V. (1995) · Machine Learning · doi:10.1007/bf00994018 · Cited by 59,421
Regression shrinkage and selection via the lasso
Tibshirani, R. (1996) · Journal of the Royal Statistical Society Series B: Statistical Methodology · doi:10.1111/j.2517-6161.1996.tb02080.x · Cited by 51,482
Going deeper with convolutions
Szegedy, C., Liu, W., Jia, Y., Sermanet, P., Reed, S., Anguelov, D., Erhan, D., Vanhoucke, V., & Rabinovich, A. (2015) · 2015 IEEE Conference on Computer Vision and Pattern Recognition (CVPR) · doi:10.1109/cvpr.2015.7298594 · Cited by 48,562
Berman, H. M. (2000) · Nucleic Acids Research · doi:10.1093/nar/28.1.235 · Cited by 40,196
Cortes, C., & Vapnik, V. N. (1995) · Machine Learning · doi:10.1023/a:1022627411411 · Cited by 34,565
(2014) · Cited by 33,419
Learning representations by back-propagating errors
Rumelhart, D. E., Hinton, G. E., & Williams, R. J. (1986) · Nature · doi:10.1038/323533a0 · Cited by 31,892
Hierarchical Grouping to Optimize an Objective Function
Ward, J. H. (1963) · Journal of the American Statistical Association · doi:10.1080/01621459.1963.10500845 · Cited by 21,341
Research works printed but not linked: 2
- C. M. Bishop, Pattern recognition. 2006.
- B. C. Dayhoff, M.O., Schwartz, R. and Orcutt, “A Model of Evolutionary Change in Proteins,” in Atlas of protein sequence and structure, Volume 5,., National Biomedical Research Foundation Silver Spring, MD, 1978, pp. 345–358
Cited by
Sorted by citations
Machine learning in chemoinformatics and drug discovery
Lo, Y.-C., Rensi, S. E., Torng, W., & Altman, R. B. (2018) · Drug Discovery Today · doi:10.1016/j.drudis.2018.05.010 · Cited by 960
Self-citationTensor field networks: Rotation- and translation-equivariant neural networks for 3D point clouds
Thomas, N., Smidt, T., Kearnes, S., Yang, L., Li, L., Kohlhoff, K., & Riley, P. (2018) · arXiv · doi:10.48550/arxiv.1802.08219 · Cited by 1,303
Graph convolutional networks for computational drug development and discovery
Sun, M., Zhao, S., Gilvary, C. M., Elemento, O., Zhou, J., & Wang, F. (2019) · Briefings in Bioinformatics · doi:10.1093/bib/bbz042 · Cited by 424
Graph Convolutional Neural Networks for Predicting Drug-Target Interactions
Torng, W., & Altman, R. B. (2019) · Journal of Chemical Information and Modeling · doi:10.1021/acs.jcim.9b00628 · Cited by 371
Self-citationArtificial Intelligence for Drug Toxicity and Safety
Basile, A. O., Yahi, A., & Tatonetti, N. P. (2019) · Trends in Pharmacological Sciences · doi:10.1016/j.tips.2019.07.005 · Cited by 401
Metadata
- Authors
- Torng, W., & Altman, R. B.
- Affiliations
- Stanford University (US)
- Corresponding author
- Altman, Russ B.
- Venue
- BMC Bioinformatics
- Published
- 2017-06-14
- Volume
- 18
- Issue
- 1
- Pages
- 302-302
- ISSN
- 1471-2105 (ISSN-L)
- PMC
- PMC5472009
- OpenAlex
- W2625768267
- Cited by
- 142
- References
- 82
- Citations by year
- 2026: 6 · 2025: 13 · 2024: 12 · 2023: 23 · 2022: 21 · 2021: 18 · 2020: 15 · 2019: 20 · 2018: 14
- FWCI
- 5.48
- Type
- journal article
- Language
- en
- Open access
- gold
- doi.org
- Locations
- BMC Bioinformatics (publishedVersion, cc-by)
- Europe PMC (PubMed Central) (publishedVersion, other-oa)
- PubMed Central (publishedVersion, cc-by)
- PubMed (publishedVersion)
- DOAJ (DOAJ: Directory of Open Access Journals) (submittedVersion, cc-by-sa)
- Funders
- National Institutes of Health (GM102365, LM05652, HL117798)
- Topics
- Life Sciences › Biochemistry, Genetics and Molecular Biology › Molecular Biology › Protein Structure and Dynamics
- Life Sciences › Biochemistry, Genetics and Molecular Biology › Molecular Biology › Machine Learning in Bioinformatics
- Life Sciences › Pharmacology, Toxicology and Pharmaceutics › Drug Discovery › Computational Drug Discovery Methods
- Keywords
- 3D convolutional neural networks, protein microenvironment, protein structure representation, amino acid substitution matrices, T4 lysozyme, mutation prediction, structure-function relationship, end-to-end deep learning, feature visualization
- MeSH terms
- Amino Acids, Animals, Brain, Nerve Net, ROC Curve, In Situ Hybridization, Area Under Curve, Embryonic Development, Mice, Transcriptome
About these checks
Registry, retraction, Cites and statistics results are computed, not judged, with one exception: a printed reference that no index lists is read once by a model before it counts as a citation error. Claims are extracted by a model and kept only when their quote appears verbatim in the text; each cited source is then checked, with a model’s help, for whether it says what the claim relies on. Those verdicts can be wrong — read the claim’s quote and the cited source before relying on one.
Statistics and arithmetic are recomputed, not judged.
Confidence bands are shown only for fields calibrated on our annotated test set. None is calibrated yet, so no band is shown.
What counts as a claim ›How we measure confidence ›How we check this ›
Are you an author, or do you see a problem with this page? Request a review
