

The DOI matches its Crossref record; 120 of the 120 references it cites were found in a registry or an index.
Genomic architecture of haddock (Melanogrammus aeglefinus) shows expansions of innate immune genes and short tandem repeats
Published version of a preprint
Abstract
BACKGROUND: Increased availability of genome assemblies for non-model organisms has resulted in invaluable biological and genomic insight into numerous vertebrates, including teleosts. Sequencing of the Atlantic cod (Gadus morhua) genome and the genomes of many of its relatives (Gadiformes) demonstrated a shared loss of the major histocompatibility complex (MHC) II genes 100 million years ago. An improved version of the Atlantic cod genome assembly shows an extreme density of tandem repeats compared to other vertebrate genome assemblies. Highly contiguous assemblies are therefore needed to further investigate the unusual immune system of the Gadiformes, and whether the high density of tandem repeats found in Atlantic cod is a shared trait in this group. RESULTS: Here, we have sequenced and assembled the genome of haddock (Melanogrammus aeglefinus) - a relative of Atlantic cod - using a combination of PacBio and Illumina reads. Comparative analyses reveal that the haddock genome contains an even higher density of tandem repeats outside and within protein coding sequences than Atlantic cod. Further, both species show an elevated number of tandem repeats in genes mainly involved in signal transduction compared to other teleosts. A characterization of the immune gene repertoire demonstrates a substantial expansion of MCHI in Atlantic cod compared to haddock. In contrast, the Toll-like receptors show a similar pattern of gene losses and expansions. For the NOD-like receptors (NLRs), another gene family associated with the innate immune system, we find a large expansion common to all teleosts, with possible lineage-specific expansions in zebrafish, stickleback and the codfishes. CONCLUSIONS: The generation of a highly contiguous genome assembly of haddock revealed that the high density of short tandem repeats as well as expanded immune gene families is not unique to Atlantic cod - but possibly a feature common to all, or most, codfishes. A shared expansion of NLR genes in teleosts suggests that the NLRs have a more substantial role in the innate immunity of teleosts than other vertebrates. Moreover, we find that high copy number genes combined with variable genome assembly qualities may impede complete characterization of these genes, i.e. the number of NLRs in different teleost species might be underestimates.
Overview
The claims and statistics of this paper haven’t been checked yet.
Run the check — free, no account needed. It reads the open-access text and checks the sources it cites.
Integrity signals
Registry
Cites
Statistics
Figures
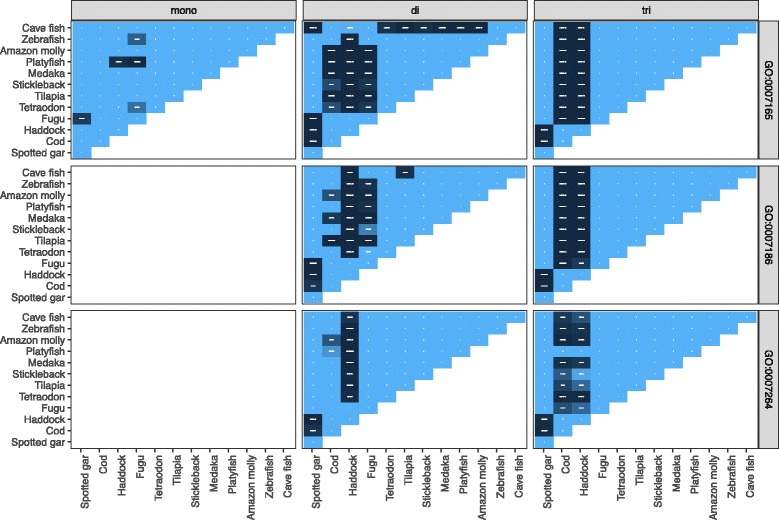
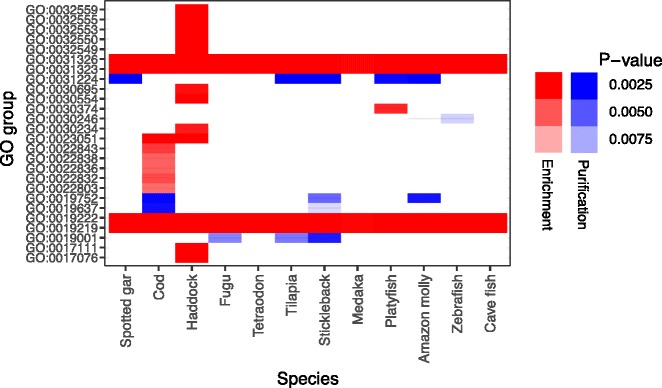
Verification
Claims the paper makes
The claims and statistics of this paper haven’t been checked yet.
Run the check — free, no account needed. It reads the open-access text and checks the sources it cites.
Claims other papers make about this one
Each is checked against this paper’s own text: does it say what the citing paper says it does?
The cited source says what the claim attributes to it.
In the citing paper
“Another gene family that greatly expanded in teleost fish are the nod-like receptor (NLR) genes (74,75), genes encoding proteins active in the innate immune system.”
From Tandem repeats lead to sequence assembly errors and impose multi-level challenges for genome and protein databases (2019) · cites this paper as [74]
Self-check
Percentages, sums and reported differences re-computed from the paper’s own numbers.
The self-check needs the paper’s full text.
Citations
Cites
The Sequence Alignment/Map format and SAMtools
Li, H., Handsaker, B., Wysoker, A., Fennell, T., Ruan, J., Homer, N., Marth, G., Abecasis, G., Durbin, R., & 1000 Genome Project Data Processing Subgroup (2009) · Bioinformatics · doi:10.1093/bioinformatics/btp352 · Cited by 62,041
Wickham, H. (2016) · Use R! · doi:10.1007/978-3-319-24277-4 · Cited by 33,115
BEDTools: a flexible suite of utilities for comparing genomic features
Quinlan, A. R., & Hall, I. M. (2010) · Bioinformatics · doi:10.1093/bioinformatics/btq033 · Cited by 27,437
BLAST+: architecture and applications
Camacho, C., Coulouris, G., Avagyan, V., Ma, N., Papadopoulos, J., Bealer, K., & Madden, T. L. (2009) · BMC Bioinformatics · doi:10.1186/1471-2105-10-421 · Cited by 22,074
Full-length transcriptome assembly from RNA-Seq data without a reference genome
Grabherr, M. G., Haas, B. J., Yassour, M., Levin, J. Z., Thompson, D. A., Amit, I., Adiconis, X., Fan, L., Raychowdhury, R., Zeng, Q., et al. (2011) · Nature Biotechnology · doi:10.1038/nbt.1883 · Cited by 21,039
FLASH: fast length adjustment of short reads to improve genome assemblies
Magoč, T., & Salzberg, S. L. (2011) · Bioinformatics · doi:10.1093/bioinformatics/btr507 · Cited by 15,366
ggplot2: Elegant Graphics for Data Analysis
Wickham, H. (2009) · doi:10.1007/978-0-387-98141-3 · Cited by 14,447
BUSCO: assessing genome assembly and annotation completeness with single-copy orthologs
Simão, F. A., Waterhouse, R. M., Ioannidis, P., Kriventseva, E. V., & Zdobnov, E. M. (2015) · Bioinformatics · doi:10.1093/bioinformatics/btv351 · Cited by 13,344
Wickham, H. (2016) · Use R! · doi:10.1007/978-3-319-24277-4_9 · Cited by 12,516
The control of the false discovery rate in multiple testing under dependency
Benjamini, Y., & Yekutieli, D. (2001) · The Annals of Statistics · doi:10.1214/aos/1013699998 · Cited by 10,490
Cited by
Tørresen, O. K., Star, B., Mier, P., Andrade-Navarro, M. A., Bateman, A., Jarnot, P., Gruca, A., Grynberg, M., Kajava, A. V., Promponas, V. J., et al. (2019) · Nucleic Acids Research · doi:10.1093/nar/gkz841 · Cited by 347
Self-citationBaalsrud, H. T., Tørresen, O. K., Solbakken, M. H., Salzburger, W., Hanel, R., Jakobsen, K. S., & Jentoft, S. (2018) · Molecular Biology and Evolution · doi:10.1093/molbev/msx311 · Cited by 116
Self-citationTeleost genomic repeat landscapes in light of diversification rates and ecology
Reinar, W. B., Tørresen, O. K., Nederbragt, A. J., Matschiner, M., Jentoft, S., & Jakobsen, K. S. (2023) · Mobile DNA · doi:10.1186/s13100-023-00302-9 · Cited by 28
Self-citation
Metadata
- Authors
- Tørresen, O. K., Brieuc, M. S. O., Solbakken, M. H., Sørhus, E., Nederbragt, A. J., Jakobsen, K. S., Meier, S., Edvardsen, R. B., & Jentoft, S.
- Venue
- BMC Genomics
- Published
- 2018-04-10
- Volume
- 19
- Issue
- 1
- ISSN
- 1471-2164
- PMC
- PMC5894186
- Cited by
- 46
- References
- 120
- Language
- en
- Licence
- creativecommons.org/licenses/by/4.0/ (tdm)
- Funders
- Norges Forskningsråd (#222378/F20, #234367/E40)
About these checks
Registry, retraction, Cites and statistics results are computed, not judged, with one exception: a printed reference that no index lists is read once by a model before it counts as a citation error. Claims are extracted by a model and kept only when their quote appears verbatim in the text; each cited source is then checked, with a model’s help, for whether it says what the claim relies on. Those verdicts can be wrong — read the claim’s quote and the cited source before relying on one.
Statistics and arithmetic are recomputed, not judged.
Confidence bands are shown only for fields calibrated on our annotated test set. None is calibrated yet, so no band is shown.
What counts as a claim ›How we measure confidence ›How we check this ›
Are you an author, or do you see a problem with this page? Request a review
How to cite
Cite CoChat for the checks on this page, and the paper for its own findings.
- This page
- CoChat. (2026). Citation check: Genomic architecture of haddock (Melanogrammus aeglefinus) shows expansions of innate immune genes and short tandem repeats. https://app.cochat.ai/papers/10.1186/s12864-018-4616-y
- The paper
- Tørresen, O. K., Brieuc, M. S. O., Solbakken, M. H., Sørhus, E., Nederbragt, A. J., Jakobsen, K. S., Meier, S., Edvardsen, R. B., & Jentoft, S. (2018). Genomic architecture of haddock (Melanogrammus aeglefinus) shows expansions of innate immune genes and short tandem repeats. BMC Genomics. https://doi.org/10.1186/s12864-018-4616-y
Data sources
Bibliographic data: Semantic Scholar, OpenAlex, Crossref.
Contains information from the Semantic Scholar Academic Graph Datasets, made available under the ODC Attribution License (ODC-BY 1.0).
Semantic Scholar’s data is described in: Kinney, R., et al. (2023). The Semantic Scholar Open Data Platform. arXiv:2301.10140.
