

The DOI matches its Crossref record; 1 of the 1 references it cites were found in a registry or an index.
Small RNA sequencing and bioinformatics analysis of RAW264.7-derived exosomes after Mycobacterium Bovis Bacillus Calmette-Guérin infection
Abstract
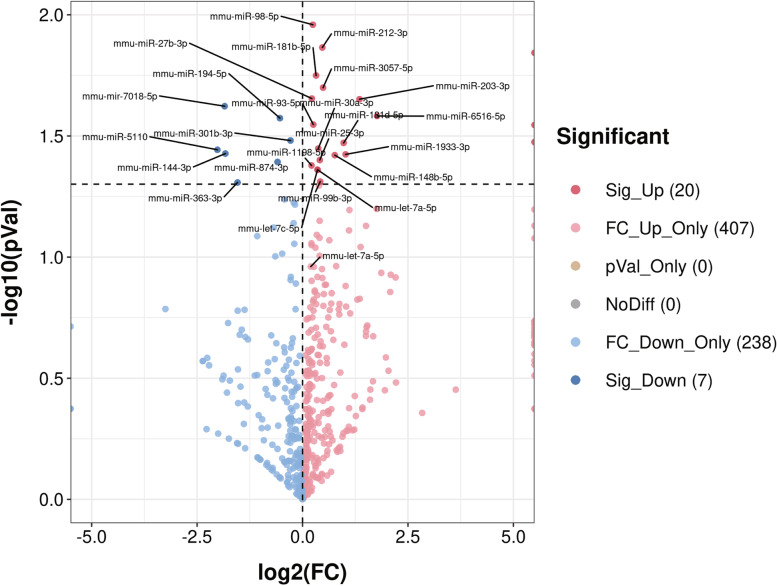
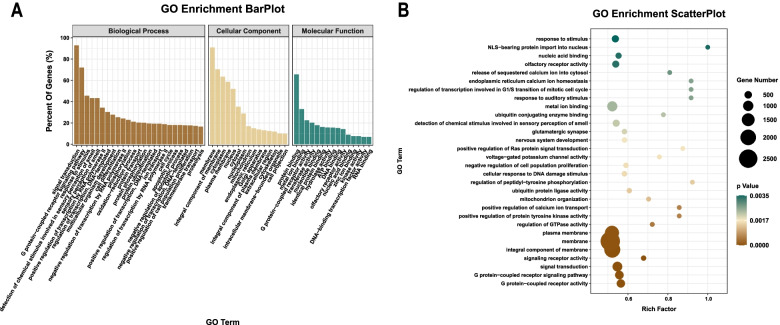
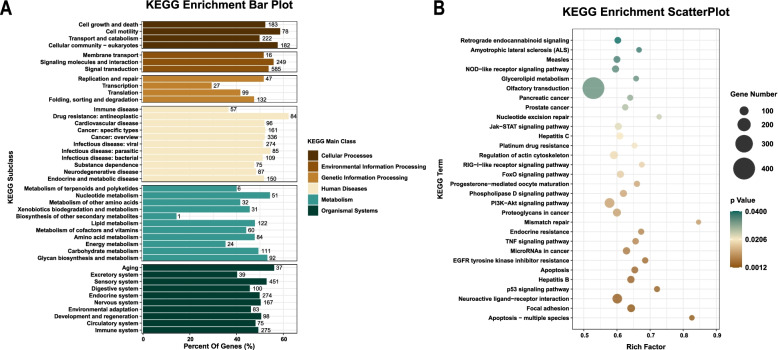
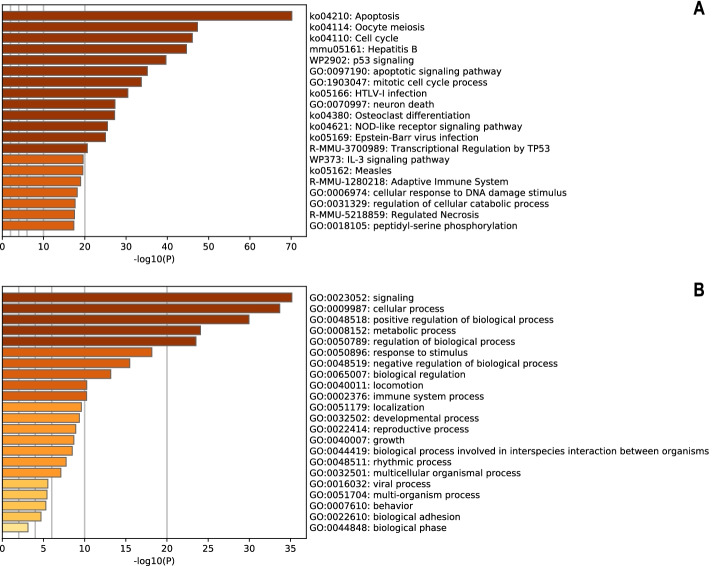
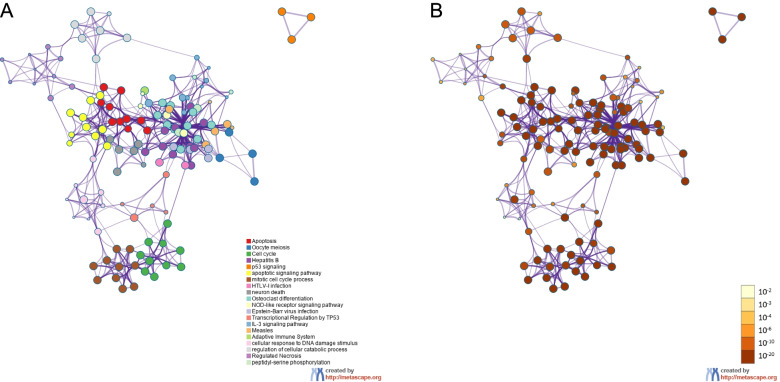
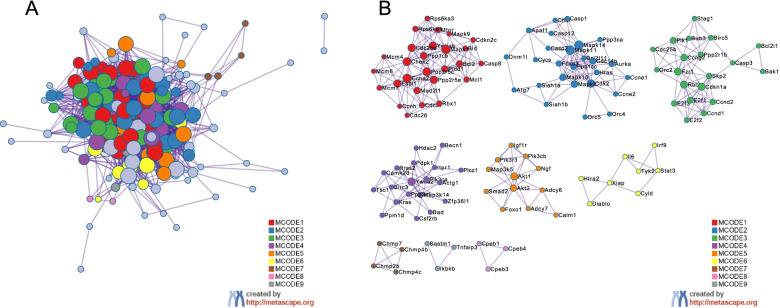
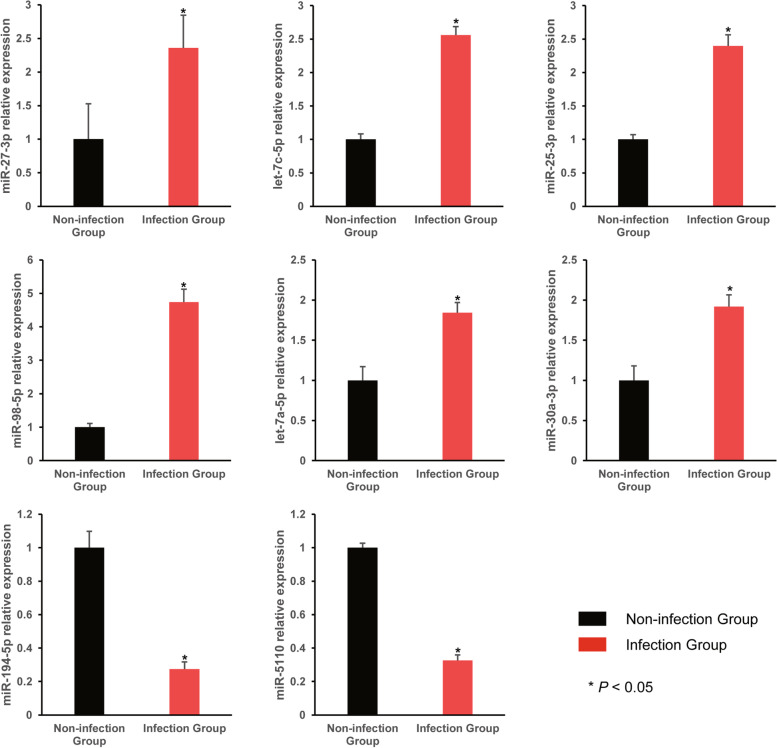
Background: The mechanisms through which Mycobacterium tuberculosis evades immune surveillance during tuberculosis (TB) infection remain complex. Previous studies have found that Mycobacteria can manipulate the miRNAs of host cells to promote their survival during host-pathogen interactions, and most of these effects occur at the cellular miRNA level. We attempted to investigate the possible related mechanisms at the exosomal miRNA level. Results: High-throughput sequencing revealed that Bacillus Calmette-Guérin (BCG) infection could alter the composition of the macrophage exosome content, and the expression levels of miRNAs in exosomes derived from the cell culture media of macrophages showed significant differences between the BCG-infected and non-infected groups. Compared with the non-infected group, 20 exosomal miRNAs were up-regulated and 7 exosomal miRNAs were down-regulated in the infection group (p < 0.05), of which mmu-miR-27b-3p, mmu-miR-93-5p, mmu-miR-25-3p, mmu-miR-1198-5p, mmu-let-7c-5p and let-7a-5p were significantly up-regulated. A bioinformatic analysis indicated that these differentially expressed exosomal miRNAs were involved in multiple biological processes and pathways. The target genes of top six miRNAs in up-regulated groups were positively correlated with the regulation of apoptosis. Conclusions: The expression profile of miRNA in exosomes derived from macrophage were altered after Mycobacterium Bovis Bacillus Calmette-Guérin infection, and the differentially expressed miRNAs were involved in multiple biological processes and signalling pathways. The top six up-regulated miRNAs and their targeted genes were predominantly correlated with the regulation of apoptosis.
Overview
The claims and statistics of this paper haven’t been checked yet.
Run the check — free, no account needed. It reads the open-access text and checks the sources it cites.
Integrity signals
Registry
Cites
Statistics
Figures
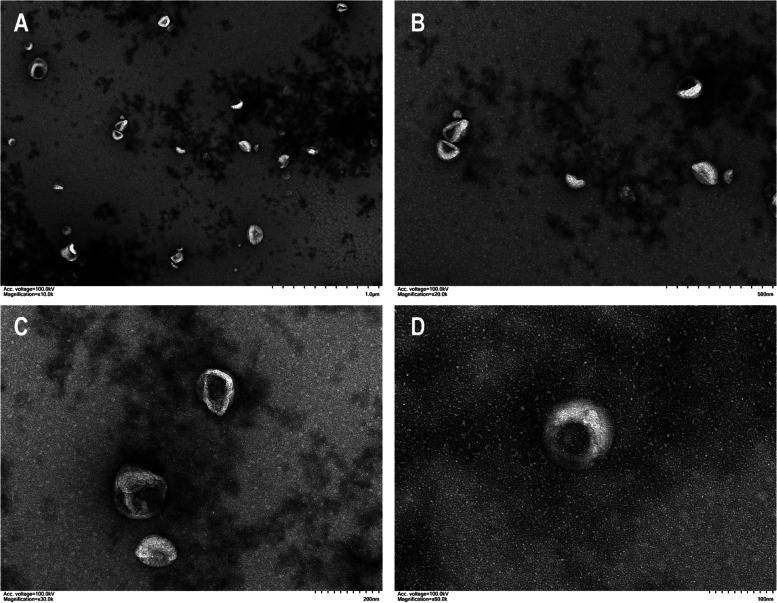
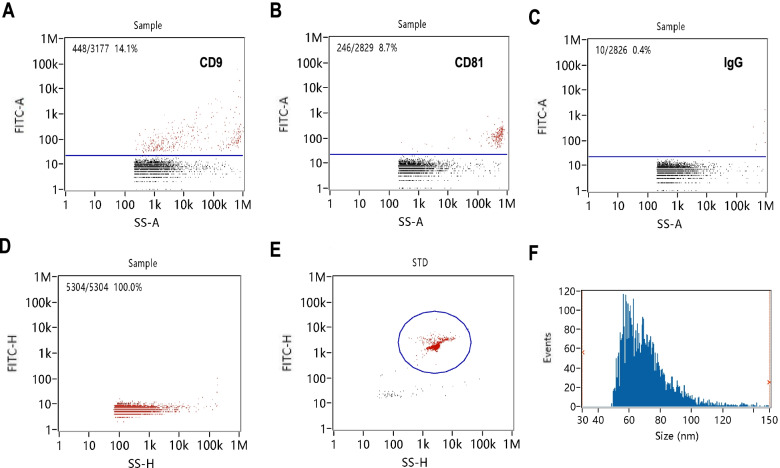
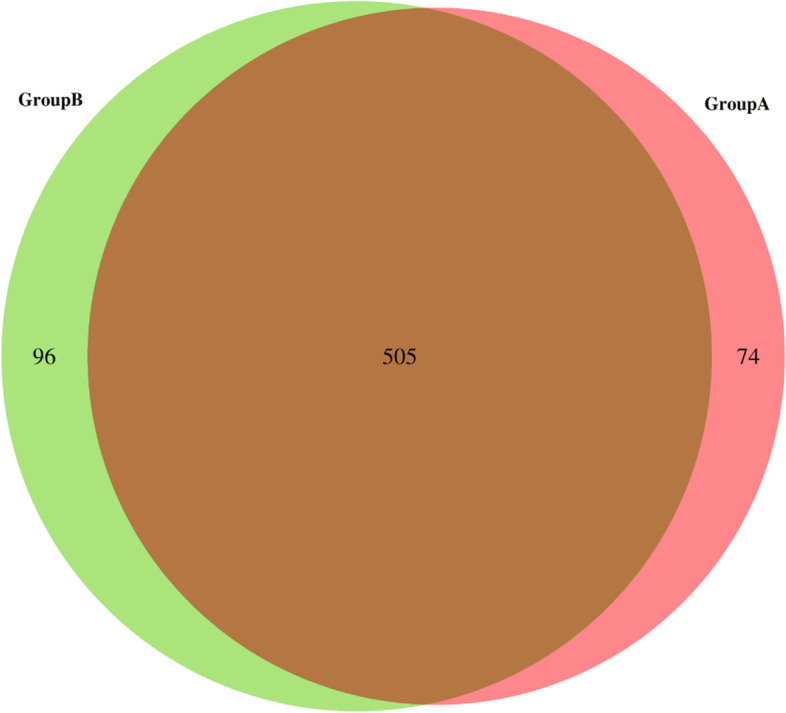
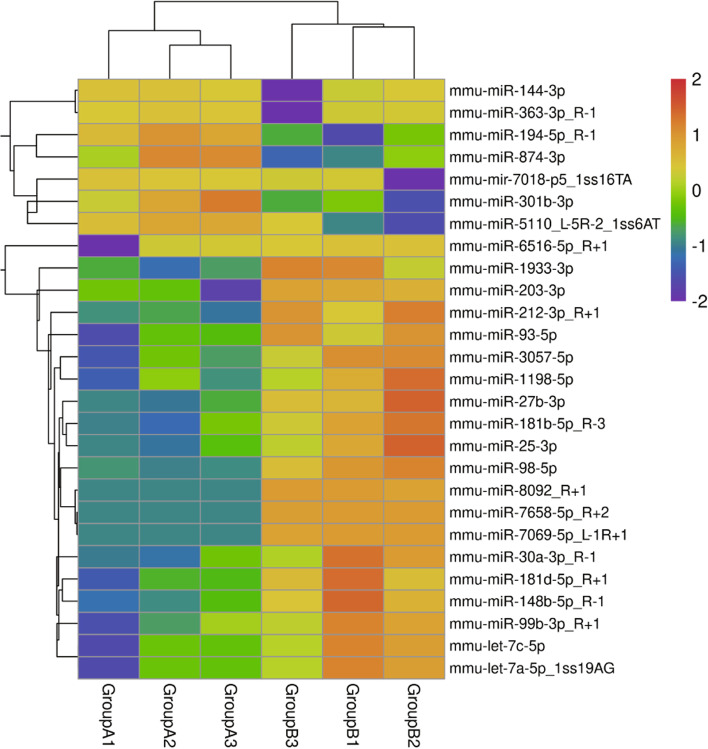
Verification
Claims the paper makes
The claims and statistics of this paper haven’t been checked yet.
Run the check — free, no account needed. It reads the open-access text and checks the sources it cites.
Claims other papers make about this one
Each is checked against this paper’s own text: does it say what the citing paper says it does?
In the citing paper
“Zhan et, al. found that Bacillus Calmette-Guérin (BCG) infection significantly increased the amount of miR-25-3p and miR-93-5p in macrophage-derived sEVs, which is positively correlated with macrophage apoptosis [56].”
From M2 microglia-derived small extracellular vesicles modulate NSC fate after ischemic stroke via miR-25-3p/miR-93-5p-TGFBR/PTEN/FOXO3 axis (2025) · cites this paper as [56]
Self-check
Percentages, sums and reported differences re-computed from the paper’s own numbers.
The self-check needs the paper’s full text.
Citations
Cites
RNA delivery by extracellular vesicles in mammalian cells and its applications
O’Brien, K., Breyne, K., Ughetto, S., Laurent, L. C., & Breakefield, X. O. (2020) · Nature Reviews Molecular Cell Biology · doi:10.1038/s41580-020-0251-y · Cited by 1,811
Research works printed but not linked: 35
- World Health Organization. Global Tuberculosis Report 2021. Geneva: World Health Organization; 2021. p. 2021.
- Liu CH, Liu H, Ge B. Innate immunity in tuberculosis: host defense vs pathogen evasion. Cell Mol Immunol. 2017;14(12):963–75. · DOI
- Zhai W, Wu F, Zhang Y, Fu Y, Liu Z. The immune escape mechanisms of mycobacterium tuberculosis. Int J Mol Sci. 2019;20(2):340. · DOI
- Abdalla AE, Ejaz H, Mahjoob MO, Alameen AAM, Abosalif KOA, Elamir MYM, et al. Intelligent mechanisms of macrophage apoptosis subversion by mycobacterium. Pathogens. 2020;9(3):218. · DOI
- Alipoor SD, Tabarsi P, Varahram M, Movassaghi M, Dizaji MK, Folkerts G, et al. Serum exosomal miRNAs are associated with active pulmonary tuberculosis. Dis Markers. 2019;2019:1907426. · DOI
- Ha M, Kim VN. Regulation of microRNA biogenesis. Nat Rev Mol Cell Biol. 2014;15(8):509–24. · DOI · Paper page
- Jadli AS, Ballasy N, Edalat P, Patel VB. Inside (sight) of tiny communicator: exosome biogenesis, secretion, and uptake. Mol Cell Biochem. 2020;467(1–2):77–94. · DOI
- Chen WX, Liu XM, Lv MM, Chen L, Zhao JH, Zhong SL, et al. Exosomes from drug-resistant breast cancer cells transmit chemoresistance by a horizontal transfer of microRNAs. PLoS One. 2014;9(4):e95240. · DOI
- Ismail N, Wang Y, Dakhlallah D, Moldovan L, Agarwal K, Batte K, et al. Macrophage microvesicles induce macrophage differentiation and miR-223 transfer. Blood. 2013;121(6):984–95. · DOI
- Singh PP, Li L, Schorey JS. Exosomal RNA from Mycobacterium tuberculosis-infected cells is functional in recipient macrophages. Traffic. 2015;16(6):555–71. · DOI
- Bettencourt P, Carmo N, Pires D, Timóteo P, Anes E. Mycobacterial infection of macrophages: the effect of the multiplicity of infection. In: Méndez-Vilas A, editor. Antimicrobial research: novel bioknowledge and educational programs. Badajoz: Formatex Research Center; 2017. p. 651–64.
- Szklarczyk D, Gable AL, Lyon D, Junge A, Wyder S, Huerta-Cepas J, et al. STRING v11: protein-protein association networks with increased coverage, supporting functional discovery in genome-wide experimental datasets. Nucleic Acids Res. 2019;47(D1):D607–D13. · DOI · Paper page
- Stark C, Breitkreutz BJ, Reguly T, Boucher L, Breitkreutz A, Tyers M. BioGRID: a general repository for interaction datasets. Nucleic Acids Res. 2006;34(Database issue):D535–9. · DOI · Paper page
- Li T, Wernersson R, Hansen RB, Horn H, Mercer J, Slodkowicz G, et al. A scored human protein-protein interaction network to catalyze genomic interpretation. Nat Methods. 2017;14(1):61–4. · DOI
- Bader GD, Hogue CW. An automated method for finding molecular complexes in large protein interaction networks. BMC Bioinform. 2003;4:2. · DOI
- Shannon P, Markiel A, Ozier O, Baliga NS, Wang JT, Ramage D, et al. Cytoscape: a software environment for integrated models of biomolecular interaction networks. Genome Res. 2003;13(11):2498–504. · DOI · Paper page
- Singh PP, Smith VL, Karakousis PC, Schorey JS. Exosomes isolated from mycobacteria-infected mice or cultured macrophages can recruit and activate immune cells in vitro and in vivo. J Immunol. 2012;189(2):777–85. · DOI
- Alipoor SD, Adcock IM, Garssen J, Mortaz E, Varahram M, Mirsaeidi M, et al. The roles of miRNAs as potential biomarkers in lung diseases. Eur J Pharmacol. 2016;791:395–404. · DOI
- Behar SM, Martin CJ, Booty MG, Nishimura T, Zhao X, Gan HX, et al. Apoptosis is an innate defense function of macrophages against mycobacterium tuberculosis. Mucosal Immunol. 2011;4(3):279–87. · DOI · Paper page
- Alipoor SD, Adcock IM, Folkerts G, Garssen J, Mortaz E. A bioinformatics analysis of exosomal microRNAs released following mycobacterial infection. Int J Mycobacteriol. 2019;8(3):218–22. · DOI
- Agarwal RG, Sharma P, Nyati KK. microRNAs in mycobacterial infection: modulation of host immune response and apoptotic pathways. Immune Netw. 2019;19(5):e30. · DOI
- Kim JK, Kim TS, Basu J, Jo EK. MicroRNA in innate immunity and autophagy during mycobacterial infection. Cell Microbiol. 2017;19(1):e12687. · DOI
- Loeuillet C, Martinon F, Perez C, Munoz M, Thome M, Meylan PR. Mycobacterium tuberculosis subverts innate immunity to evade specific effectors. J Immunol. 2006;177(9):6245–55. · DOI
- Fu Y, Yi Z, Wu X, Li J, Xu F. Circulating microRNAs in patients with active pulmonary tuberculosis. J Clin Microbiol. 2011;49(12):4246–51. · DOI
- Sharbati J, Lewin A, Kutz-Lohroff B, Kamal E, Einspanier R, Sharbati S. Integrated microRNA-mRNA-analysis of human monocyte derived macrophages upon mycobacterium avium subsp. hominissuis infection. PLoS One. 2011;6(5):e20258. · DOI
- Bettencourt P, Marion S, Pires D, Santos LF, Lastrucci C, Carmo N, et al. Actin-binding protein regulation by microRNAs as a novel microbial strategy to modulate phagocytosis by host cells: the case of N-wasp and miR-142-3p. Front Cell Infect Microbiol. 2013;3:19. · DOI · Paper page
- Guo L, Zhou L, Gao Q, Zhang A, Wei J, Hong D, et al. MicroRNA-144-3p inhibits autophagy activation and enhances Bacillus Calmette-Guerin infection by targeting ATG4a in RAW264.7 macrophage cells. PLoS One. 2017;12(6):e0179772. · DOI
- Gu X, Gao Y, Mu DG, Fu EQ. MiR-23a-5p modulates mycobacterial survival and autophagy during mycobacterium tuberculosis infection through TLR2/MyD88/NF-kappaB pathway by targeting TLR2. Exp Cell Res. 2017;354(2):71–7. · DOI
- Alipoor SD, Mortaz E, Tabarsi P, Farnia P, Mirsaeidi M, Garssen J, et al. Bovis bacillus calmette-guerin (BCG) infection induces exosomal miRNA release by human macrophages. J Transl Med. 2017;15(1):105. · DOI
- Alipoor SD, Mortaz E, Tabarsi P, Marjani M, Varahram M, Folkerts G, et al. miR-1224 expression is increased in human macrophages after infection with bacillus calmette-guerin (BCG). Iran J Allergy Asthma Immunol. 2018;17(3):250–7.
- Daniel J, Maamar H, Deb C, Sirakova TD, Kolattukudy PE. Mycobacterium tuberculosis uses host triacylglycerol to accumulate lipid droplets and acquires a dormancy-like phenotype in lipid-loaded macrophages. PLoS Pathog. 2011;7(6):e1002093. · DOI
- Kim MJ, Wainwright HC, Locketz M, Bekker LG, Walther GB, Dittrich C, et al. Caseation of human tuberculosis granulomas correlates with elevated host lipid metabolism. EMBO Mol Med. 2010;2(7):258–74. · DOI · Paper page
- Zheng X, Ye C, Zhao J, Bian P, Zhang Y, Jia Z. Alterations and clinical signifecance of exosome-containing innate immunity related lncRNAs in patients of hemorrhagic fever with renal syndrome. Xi Bao Yu Fen Zi Mian Yi Xue Za Zhi. 2016;32(11):1522–6.
- Zhang D, Yi Z, Fu Y. Downregulation of miR-20b-5p facilitates Mycobacterium tuberculosis survival in RAW 264.7 macrophages via attenuating the cell apoptosis by Mcl-1 upregulation. J Cell Biochem. 2019;120(4):5889–96. · DOI
- Hadifar S, Fateh A, Yousefi MH, Siadat SD, Vaziri F. Exosomes in tuberculosis: Still terra incognita? J Cell Physiol. 2019;234(3):2104–11. · DOI
Cited by
Sorted by citations
Zhang, Q., Yi, Y., Chen, T., Ai, Y., Chen, Z., Liu, G., Tang, Z., Chen, J., Xu, T., Chen, X., et al. (2025) · Journal of Nanobiotechnology · doi:10.1186/s12951-025-03390-2 · Cited by 27
Metadata
- Authors
- Zhan, X., Yuan, W., Zhou, Y., Ma, R., & Ge, Z.
- Venue
- BMC Genomics
- Published
- 2022-05-07
- Volume
- 23
- Issue
- 1
- ISSN
- 1471-2164
- PMC
- PMC9080156
- Cited by
- 23
- References
- 1
- Language
- en
- Funders
- National Natural Science Foundation of China (8196090244)
About these checks
Registry, retraction, Cites and statistics results are computed, not judged, with one exception: a printed reference that no index lists is read once by a model before it counts as a citation error. Claims are extracted by a model and kept only when their quote appears verbatim in the text; each cited source is then checked, with a model’s help, for whether it says what the claim relies on. Those verdicts can be wrong — read the claim’s quote and the cited source before relying on one.
Statistics and arithmetic are recomputed, not judged.
Confidence bands are shown only for fields calibrated on our annotated test set. None is calibrated yet, so no band is shown.
What counts as a claim ›How we measure confidence ›How we check this ›
Are you an author, or do you see a problem with this page? Request a review
