

The DOI matches its Crossref record; 67 of the 67 references it cites were found in a registry or an index.
Aging progression of human gut microbiota
Open accessAbstract
Background: Human gut microbiota are important for human health and have been regarded as a “forgotten organ”, whose variation is closely linked with various factors, such as host genetics, diet, pathological conditions and external environment. The diversity of human gut microbiota has been correlated with aging, which was characterized by different abundance of bacteria in various age groups. In the literature, most of the previous studies of age-related gut microbiota changes focused on individual species in the gut community with supervised methods. Here, we aimed to examine the underlying aging progression of the human gut microbial community from an unsupervised perspective. Results: We obtained raw 16S rRNA sequencing data of subjects ranging from newborns to centenarians from a previous study, and summarized the data into a relative abundance matrix of genera in all the samples. Without using the age information of samples, we applied an unsupervised algorithm to recapitulate the underlying aging progression of microbial community from hosts in different age groups and identify genera associated to this progression. Literature review of these identified genera indicated that for individuals with advanced ages, some beneficial genera are lost while some genera related with inflammation and cancer increase. Conclusions: The multivariate unsupervised analysis here revealed the existence of a continuous aging progression of human gut microbiota along with the host aging process. The identified genera associated to this aging process are meaningful for designing probiotics to maintain the gut microbiota to resemble a young age, which hopefully will lead to positive impact on human health, especially for individuals in advanced age groups.
Overview
The claims and statistics of this paper haven’t been checked yet.
Run the check — free, no account needed. It reads the open-access text and checks the sources it cites.
Integrity signals
Registry
Cites
Statistics
Figures
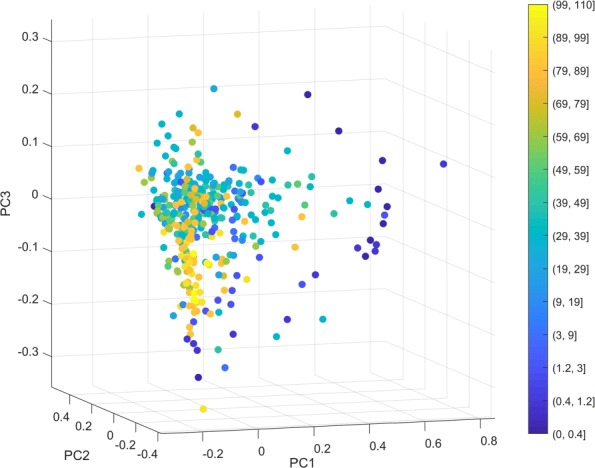
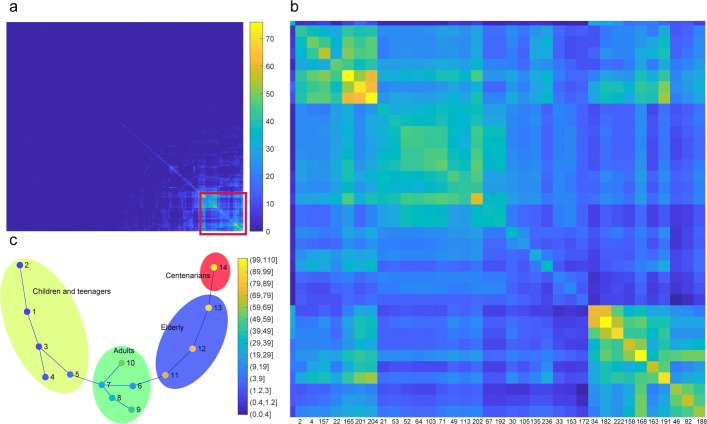
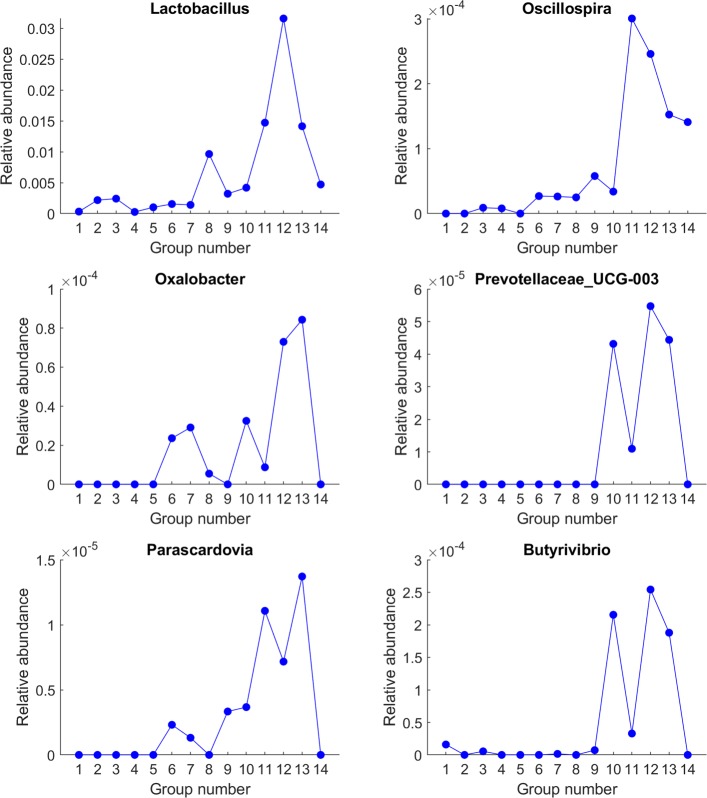
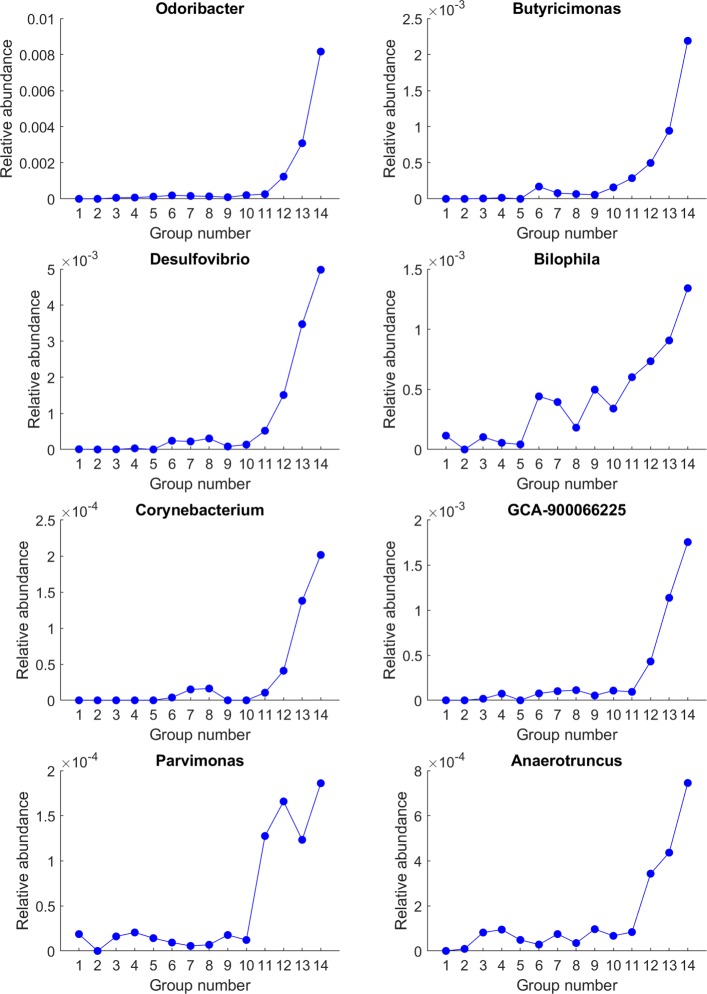
Verification
Claims the paper makes
The claims and statistics of this paper haven’t been checked yet.
Run the check — free, no account needed. It reads the open-access text and checks the sources it cites.
Claims other papers make about this one
Each is checked against this paper’s own text: does it say what the citing paper says it does?
In the citing paper
“Desulfovibrio, one of the main H2S-producing gut bacteria [59], is known to be associated with PD due to its elevated abundance [60].”
From Healthy Human Fecal Microbiota Transplantation into Mice Attenuates MPTP-Induced Neurotoxicity via AMPK/SOD2 Pathway (2023) · cites this paper as [59]
In the citing paper
“The aging process of the host parallels a continuous aging progression of the GM (90).”
From Signalling cognition: The gut microbiota and hypothalamic-pituitary-adrenal axis (2023) · cites this paper as [90]
Self-check
Percentages, sums and reported differences re-computed from the paper’s own numbers.
The self-check needs the paper’s full text.
Citations
Cites
The SILVA ribosomal RNA gene database project: improved data processing and web-based tools
Quast, C., Pruesse, E., Yilmaz, P., Gerken, J., Schweer, T., Yarza, P., Peplies, J., & Glöckner, F. O. (2012) · Nucleic Acids Research · doi:10.1093/nar/gks1219 · Cited by 33,055
Schloss, P. D., Westcott, S. L., Ryabin, T., Hall, J. R., Hartmann, M., Hollister, E. B., Lesniewski, R. A., Oakley, B. B., Parks, D. H., Robinson, C. J., et al. (2009) · Applied and Environmental Microbiology · doi:10.1128/aem.01541-09 · Cited by 19,549
Structure, function and diversity of the healthy human microbiome
The Human Microbiome Project Consortium (2012) · Nature · doi:10.1038/nature11234 · Cited by 11,726
Human gut microbiome viewed across age and geography
Yatsunenko, T., Rey, F. E., Manary, M. J., Trehan, I., Dominguez-Bello, M. G., Contreras, M., Magris, M., Hidalgo, G., Baldassano, R. N., Anokhin, A. P., et al. (2012) · Nature · doi:10.1038/nature11053 · Cited by 7,815
Trapnell, C., Cacchiarelli, D., Grimsby, J., Pokharel, P., Li, S., Morse, M., Lennon, N. J., Livak, K. J., Mikkelsen, T. S., & Rinn, J. L. (2014) · Nature Biotechnology · doi:10.1038/nbt.2859 · Cited by 7,314
A metagenome-wide association study of gut microbiota in type 2 diabetes
Qin, J., Li, Y., Cai, Z., Li, S., Zhu, J., Zhang, F., Liang, S., Zhang, W., Guan, Y., Shen, D., et al. (2012) · Nature · doi:10.1038/nature11450 · Cited by 6,762
Richness of human gut microbiome correlates with metabolic markers
Le Chatelier, E., Nielsen, T., Qin, J., Prifti, E., Hildebrand, F., Falony, G., Almeida, M., Arumugam, M., Batto, J.-M., Kennedy, S., et al. (2013) · Nature · doi:10.1038/nature12506 · Cited by 4,662
Human Genetics Shape the Gut Microbiome
Goodrich, J. K., Waters, J. L., Poole, A. C., Sutter, J. L., Koren, O., Blekhman, R., Beaumont, M., Van Treuren, W., Knight, R., Bell, J. T., et al. (2014) · Cell · doi:10.1016/j.cell.2014.09.053 · Cited by 3,164
Gut metagenome in European women with normal, impaired and diabetic glucose control
Karlsson, F. H., Tremaroli, V., Nookaew, I., Bergström, G., Behre, C. J., Fagerberg, B., Nielsen, J., & Bäckhed, F. (2013) · Nature · doi:10.1038/nature12198 · Cited by 3,115
The gut flora as a forgotten organ
O'Hara, A. M., & Shanahan, F. (2006) · The EMBO Reports · doi:10.1038/sj.embor.7400731 · Cited by 2,791
Research works printed but not linked: 2
- Padmanabhan R, Dubourg G, Lagier J-C, Couderc C, Michelle C, Raoult D, Fournier P-E. Genome sequence and description of corynebacterium ihumii sp. nov. Stand Genomic Sci. 2014; 9(3):1128. https://doi.org/10.4056/sigs.5149006. · DOI
- Anderson MJ. Permutation tests for univariate or multivariate analysis of variance and regression. Can J Fish Aquat Sci. 2001; 58(3):626–39. https://doi.org/10.1139/cjfas-58-3-626. · DOI
Cited by
Sorted by citations
Items 201–257 of 257
Sultanova, Z., Dönertaş, H. M., Hita, A., Aguilar, P., Dag, B., Lucas‐Lledó, J. I., Latorre, A., & Carazo, P. (2025) · bioRxiv (Cold Spring Harbor Laboratory) · doi:10.1101/2025.05.22.655607 · Cited by 2
Symbiotic association of gut microbiome in health and diseases at ageing
Mane, S. S., Patel, D. A., & Patil, P. C. (2023) · Elsevier eBooks · doi:10.1016/b978-0-323-99334-0.00049-9 · Cited by 1
Ageing-associated gut dysbiosis deteriorates mouse cognition
Ju, H., Zhou, Y., Wei, W., Yan, H., Fang, H., Chen, Z., Sun, X., Shi, Y. P., & Fang, H. (2024) · Acta Biochimica et Biophysica Sinica · doi:10.3724/abbs.2024217 · Cited by 1
Compare, D., Fosso, B., Nunziato, M., Sgamato, C., Maggio, F. D., D’Argenio, V., Granata, I., Zamparelli, M. S., Lovero, D., Casaburi, G., et al. (2025) · Gut Pathogens · doi:10.1186/s13099-025-00767-4 · Cited by 1
Lignan-enriched nutmeg extract changes gut microbiota associated with aging in C57BL/6 mice
Ahn, J.-S., Kim, J. U., Lee, J.-H., Ban, G.-T., Yoon, Y., Yoo, H.-S., Choi, J.-S., & Chung, H.-J. (2025) · Journal of Functional Foods · doi:10.1016/j.jff.2025.106966 · Cited by 2
Gut Microbiota-Mediated Molecular Events in Hepatocellular Carcinoma: From Pathogenesis to Treatment
Sgamato, C., Marchitto, S. A., Compare, D., Coccoli, P., Colace, V., Minieri, S., Ambrosio, C., Nardone, G., & Rocco, A. (2026) · Livers · doi:10.3390/livers6010004 · Cited by 1
Relationship between the microbiome and obesity-associated cancer risk using Mendelian randomisation
Yates, T., Went, M., Mills, C., Law, P. J., & Houlston, R. S. (2026) · International Journal of Obesity · doi:10.1038/s41366-026-02032-3 · Cited by 1
Wang, Y., Chen, Z. Y., Hua, C., Mao, J., Geng, W., Feng, X., Ye, S., Song, S., Wang, H., Wang, X., et al. (2026) · Frontiers in Veterinary Science · doi:10.3389/fvets.2026.1775401 · Cited by 1
Signatures in the gut microbiome of German elite athletes: insights from a matched-subgroup analysis
Lenz, C., Seel, W., Dombrowski, T., Hacker, S., Simon, M., Zentgraf, K., Dawczynski, C., & Krüger, K. (2026) · mSystems · doi:10.1128/msystems.00489-26 · Cited by 1
The Impact of Camel Milk Consumption on Modulation and Abundance of Gut Microbiota
Najjar, A., Almugadam, B. S., Asseri, A. H., & Altayb, H. N. (2023) · Journal of Pharmaceutical Research International · doi:10.9734/jpri/2023/v35i127359 · Cited by 1
Miqdad, M. A., Kosaraju, K., Mohamad, A. S., Hulwi, H., Rais, U., Taleb, M., & Aloreibi, T. (2023) · Cureus · doi:10.7759/cureus.39193 · Cited by 1
Gut microbiota and acute kidney injury: immunological crosstalk link
Ali, A. M. M., Wu, L., & Ali, S. S. (2023) · International Urology and Nephrology · doi:10.1007/s11255-023-03760-5 · Cited by 1
Utilizing the Gut Microbiome as a Therapeutic Target for Liver Disease – Narrative Review
Ayer, D., Trovato, A., & Tadros, M. S. (2023) · Journal of Translational Gastroenterology · doi:10.14218/jtg.2023.00027 · Cited by 1
Chronic Liver Disease and Promising Therapeutic Strategy: A Concise Review
Yu, H., Wang, Z., & Zhao, G. (2024) · Pharmacognosy Magazine · doi:10.1177/09731296241228361 · Cited by 1
Comparative Analysis of Faecal Bacteria in Captive Asian Elephants of Various Age Groups and Musth
Sreehari, O. K., Jose, R. M., Menon, D. B., Saranya, M., & Anilkumar, T. R. (2024) · Indian Journal of Microbiology · doi:10.1007/s12088-024-01391-7 · Cited by 1
Gut microbiota and geriatric health
Nayak, K., Gopan, A., ., P., Muraleedharan, A., Varghese, A., Patil, A., & Manokaran, K. (2024) · Reviews in Medical Microbiology · doi:10.1097/mrm.0000000000000398 · Cited by 1
Lee, E., & Hong, S. (2021) · Current Opinion in Allergy and Clinical Immunology · doi:10.1097/aci.0000000000000738 · Cited by 1
Genital and Oral Microbiome and Behçet’s Disease ActivityPreprint
Senusi, A. A., Ogunkolade, W. B., Sandionigi, A., & Fortune, F. (2022) · Research Square · doi:10.21203/rs.3.rs-1208933/v1 · Cited by 1
Gut microbiome co-abundance networks varies with age, sex, smoking status and body mass indexPreprint
Boetto, C., Romero, V. B., Henches, L., Frouin, A., Auvergne, A., Patin, É., Bredon, M., Kennedy, S., Duffy, D., Quintana‐Murci, L., et al. (2024) · medRxiv · doi:10.1101/2024.04.30.24306630 · Cited by 1
Advances in Research on the Relationship between Intestinal Flora and Myasthenia GravisPreprint
Wu, X., Xu, Y., Wang, Q., Wei, Y., Karim, M. R., & Wang, Y. (2020) · Preprints.org · doi:10.20944/preprints202005.0378.v1
The Roles of the Microbiome in Alzheimer’s Disease
Hafiz, Z., Malek, M., & Ju, W. (2021) · UTSC s Journal of Natural Sciences · doi:10.33137/jns.v2i1.35867
Improving the Gut Microbiota with Probiotics and Faecal Microbiota Transplantation
Patil, Y. M., Patwardhan, R. B., & Abhyankar, P. S. (2021) · Journal of Pure and Applied Microbiology · doi:10.22207/jpam.15.3.53
Rozencwaig, R. (2022) · Elsevier eBooks · doi:10.1016/b978-0-12-819265-8.00111-x
Gruneck, L., Kullawong, N., Kespechara, K., & Popluechai, S. (2020) · PeerJ · doi:10.7287/peerj.9622v0.1/reviews/3
Ichinohe, T., Nagai, M., Moriyama, M., Ishii, C., Mori, H., Watanabe, H., Nitta, Y., Arimitsu, N., Nishimoto, M., Nakahara, T., et al. (2022) · Research Square · doi:10.21203/rs.3.rs-1654765/v1
Nature and evolution of the cellular HIV-1 reservoir in children and adolescents
Canape, J., Diallo, M. A., & Soudeyns, H. (2023) · Virologie · doi:10.1684/vir.2023.1023
Ghosh, T. S., Shanahan, F., & O’Toole, P. W. (2024) · Elsevier eBooks · doi:10.1016/b978-0-323-99971-7.00005-9
Microbiota–brain interactions in aging and neurodegeneration
Foster, J. A., & Clarke, G. A. (2024) · Elsevier eBooks · doi:10.1016/b978-0-12-814800-6.00009-1
Doğan, N. M., & Kart, N. N. B. (2024) · Journal of Turkish Sleep Medicine · doi:10.4274/jtsm.galenos.2023.97658
Adserias‐Garriga, J., Yaroshuk, T., & Zapico, S. C. (2024) · Elsevier eBooks · doi:10.1016/b978-0-443-13320-6.00002-0
Customised Microbiome Restoration Approaches in Older People: Perspectives and Therapeutic Prospects
Rajalakshmi, M., Vijayalakshmi, P., & Indu, S. (2024) · Springer eBooks · doi:10.1007/978-981-99-8803-7_10
The Epigenetic Impact of the Human Microbiota on Host Cells
Stein, R. A., Cui, R., Faussete, K. C., & Riber, L. (2024) · Springer eBooks · doi:10.1007/978-981-97-3790-1_5
Microbiome and Circadian Rhythms: Implications for Sleep, Aging, and Therapeutic Strategies
Najumuddin, Ullah, I., Taqveem, A., & Khurshid, M. (2024) · Springer eBooks · doi:10.1007/978-981-97-3790-1_10
Future trends that can be used for MP removals
Zomuansangi, R., Deka, P., Singh, A., Kar, J., Vanlallawmzuali, & Lalbiaktluangi, C. (2024) · Elsevier eBooks · doi:10.1016/b978-0-443-29804-2.00014-7
Avaliação da microbiota intestinal e uso de probióticos na doença de Alzheimer
da Rosa, J. C. P., Lopes, I. G. C., Rainieri, A. L., Cardoso, R. D. R., & Lage, P. S. (2024) · Debates em Psiquiatria · doi:10.25118/2763-9037.2024.v14.1346 · Cited by 1
Doi, M., Inoue, R., Hosomi, K., Park, J., Yumioka, H., Syauki, A. Y., Kageyama, S., Sakaue, H., Tanabe, K., Mizuguchi, K., et al. (2025) · Journal of Nutrition in Gerontology and Geriatrics · doi:10.1080/21551197.2024.2431283
Overfeeding, Agavins, and Dietary Fat: Factors that Modulate the Zebrafish Gut Microbiota
Navarro-Barrón, E., Hernández-González, C., Llera‐Herrera, R., Garcı́a-Gasca, A., López, M. G., & Gómez‐Gil, B. (2025) · Zebrafish · doi:10.1177/15458547251365846
Boetto, C., Romero, V. B., Henches, L., Frouin, A., Auvergne, A., Patin, É., Bredon, M., Abel, L., Alcover, A., Aschard, H., et al. (2025) · Communications Biology · doi:10.1038/s42003-025-08895-y
Exploring promising pharmaceutical candidates for antiaging
Nandi, N. K., Lodhi, A., Kumar, D., Lather, V., & Tripathi, P. N. (2025) · Elsevier eBooks · doi:10.1016/b978-0-443-36295-8.00014-6
Additional file 1 of Gut microbiota: effect of pubertal status
Yuan, X., Chen, R., Zhang, Y., 林祥泉, & Yang, X. (2020) · Figshare · doi:10.6084/m9.figshare.13185989
Additional file 4 of Correction to: Aging progression of human gut microbiota
Xu, C., Zhu, H., & Qiu, P. (2021) · Figshare · doi:10.6084/m9.figshare.14510305
Self-citationUh, Y.-R., Park, S.-N., & Song, M.-J. (2026) · Frontiers in Microbiology · doi:10.3389/fmicb.2025.1745533
Influence of the microbiota on Candida albicans gastrointestinal colonization in healthy individuals
Delavy, M. (2023) · theses.fr (ABES) · doi:10.70675/da5a2f9dz2e64z4e1fz9280z36a010c349be
Siow, T. Y., Wong, A. M., Fang, J., Chiu, C., Yeh, Y., Cheng, M., Lo, C.-J., Lin, S.-N., Lin, C., & Toh, C. (2026) · Communications Medicine · doi:10.1038/s43856-026-01566-x
Donor Age and Oligosaccharide Structure Jointly Shape the Gut Microbiome FunctionPreprint
Zhang, A., Wu, Q., Qin, H., Mayne, J., Ning, Z., da Rosa, C. E., & Figeys, D. (2026) · bioRxiv (Cold Spring Harbor Laboratory) · doi:10.64898/2026.06.07.730712
Yue, R., Wen, Y., Zhao, S., Liu, X., Luo, L., Liu, Y., & Zeng, L. (2026) · Critical Reviews in Food Science and Nutrition · doi:10.1080/10408398.2026.2684712
Effect of chemotherapy on gut microbiota in patients with colorectal cancer
Mi, X., Zheng, P., Zhao, S., Zhang, X., Tian, L., & Wu, X. (2026) · Frontiers in Microbiology · doi:10.3389/fmicb.2026.1811645
Han, D., & Yang, C. (2026) · Frontiers in Cellular and Infection Microbiology · doi:10.3389/fcimb.2026.1815265
Association Characteristics and Potential Mechanisms of Aging, Gut Microbiota, and Hearing Loss
Cheng, C., Wang, L., Li, R., Lai, W., Sun, C., Cui, J., Zhu, B., & Zhang, J. (2026) · Integrative Zoology · doi:10.1111/1749-4877.70156
Reytor-González, C., Román-Galeano, N. M., Jimenez, J. C. C., Oentiono, O. Y., Yoong, W. A., Montalván, M., & Simancas‐Racines, D. (2026) · Frontiers in Nutrition · doi:10.3389/fnut.2026.1844337
Pan, S., & Wang, G. (2026) · Archives of Gerontology and Geriatrics · doi:10.1016/j.archger.2026.106373
Xie, T., Zhou, J., & Wang, Y. (2026) · Frontiers in Cellular and Infection Microbiology · doi:10.3389/fcimb.2026.1828471
Zhang, Y., Suo, C., & Sun, L. (2026) · Chinese Medical Journal · doi:10.1097/cm9.0000000000004174
Metadata
- Authors
- Xu, C., Zhu, H., & Qiu, P.
- Affiliations
- Georgia Institute of Technology (US)
- Peking University (CN)
- Corresponding author
- Qiu, Peng
- Venue
- BMC Microbiology
- Published
- 2019-10-28
- Volume
- 19
- Issue
- 1
- Pages
- 236-236
- ISSN
- 1471-2180 (ISSN-L)
- PMC
- PMC6819604
- OpenAlex
- W2982520321
- Cited by
- 258
- References
- 67
- Citations by year
- 2026: 21 · 2025: 26 · 2024: 52 · 2023: 39 · 2022: 50 · 2021: 43 · 2020: 27
- FWCI
- 9.92
- Type
- journal article
- Language
- en
- Update notices
- correction (2021-04-28)
- Open access
- gold
- doi.org
- Locations
- BMC Microbiology (publishedVersion, cc-by)
- PubMed Central (publishedVersion, cc-by)
- PubMed (publishedVersion)
- DOAJ (DOAJ: Directory of Open Access Journals) (submittedVersion, cc-by-sa)
- Funders
- National Science Foundation (1552784)
- Georgia Institute of Technology
- China Scholarship Council
- Topics
- Life Sciences › Biochemistry, Genetics and Molecular Biology › Molecular Biology › Gut microbiota and health
- Health Sciences › Dentistry › Periodontics › Oral microbiology and periodontitis research
- Life Sciences › Agricultural and Biological Sciences › Food Science › Probiotics and Fermented Foods
- Keywords
- gut microbiota, aging, age-related microbial changes, 16S rRNA gene sequencing, unsupervised clustering, microbial genera, probiotics, centenarians, inflammation, tumor-associated bacteria
- MeSH terms
- Gastrointestinal Microbiome, Unsupervised Machine Learning, Adolescent, Adult, Age Factors, Aged, Aged, 80 and over, Aging, Bacteria, Child, Child, Preschool, DNA, Bacterial, DNA, Ribosomal, Female, Humans, Infant, Infant, Newborn, Male, Middle Aged, Phylogeny, RNA, Ribosomal, 16S, Sequence Analysis, DNA, Young Adult
About these checks
Registry, retraction, Cites and statistics results are computed, not judged, with one exception: a printed reference that no index lists is read once by a model before it counts as a citation error. Claims are extracted by a model and kept only when their quote appears verbatim in the text; each cited source is then checked, with a model’s help, for whether it says what the claim relies on. Those verdicts can be wrong — read the claim’s quote and the cited source before relying on one.
Statistics and arithmetic are recomputed, not judged.
Confidence bands are shown only for fields calibrated on our annotated test set. None is calibrated yet, so no band is shown.
What counts as a claim ›How we measure confidence ›How we check this ›
Are you an author, or do you see a problem with this page? Request a review
