

The DOI matches its Crossref record; 35 of the 35 references it cites were found in a registry or an index.
Double-adjustment in propensity score matching analysis: choosing a threshold for considering residual imbalance
Open accessAbstract
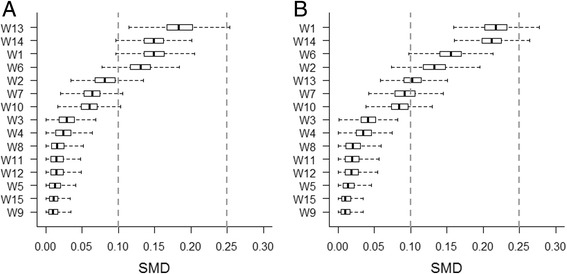
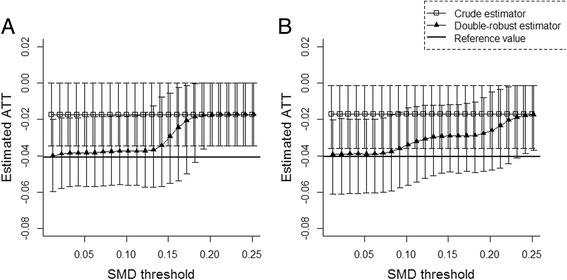
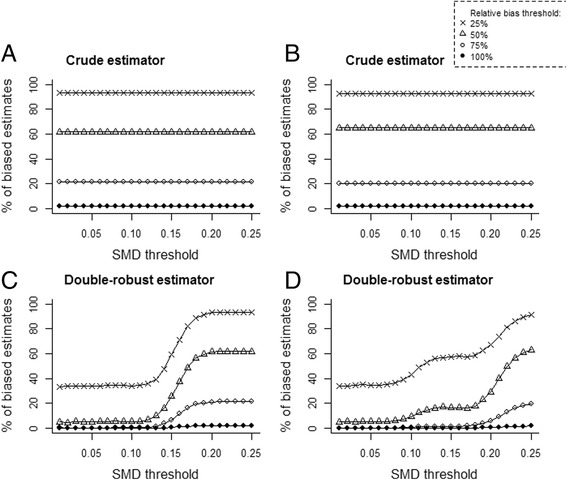
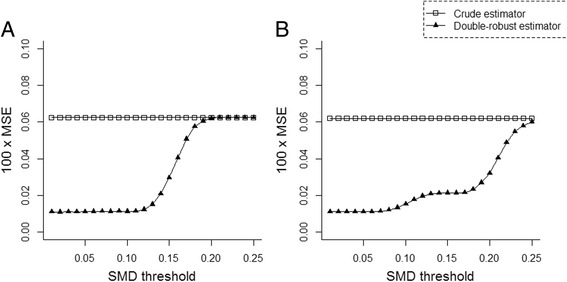
BACKGROUND: Double-adjustment can be used to remove confounding if imbalance exists after propensity score (PS) matching. However, it is not always possible to include all covariates in adjustment. We aimed to find the optimal imbalance threshold for entering covariates into regression. METHODS: We conducted a series of Monte Carlo simulations on virtual populations of 5,000 subjects. We performed PS 1:1 nearest-neighbor matching on each sample. We calculated standardized mean differences across groups to detect any remaining imbalance in the matched samples. We examined 25 thresholds (from 0.01 to 0.25, stepwise 0.01) for considering residual imbalance. The treatment effect was estimated using logistic regression that contained only those covariates considered to be unbalanced by these thresholds. RESULTS: We showed that regression adjustment could dramatically remove residual confounding bias when it included all of the covariates with a standardized difference greater than 0.10. The additional benefit was negligible when we also adjusted for covariates with less imbalance. We found that the mean squared error of the estimates was minimized under the same conditions. CONCLUSION: If covariate balance is not achieved, we recommend reiterating PS modeling until standardized differences below 0.10 are achieved on most covariates. In case of remaining imbalance, a double adjustment might be worth considering.
Overview
The claims and statistics of this paper haven’t been checked yet.
Run the check — free, no account needed. It reads the open-access text and checks the sources it cites.
Integrity signals
Registry
Cites
Statistics
Figures
Verification
Claims the paper makes
The claims and statistics of this paper haven’t been checked yet.
Run the check — free, no account needed. It reads the open-access text and checks the sources it cites.
Claims other papers make about this one
Each is checked against this paper’s own text: does it say what the citing paper says it does?
The source backs part of the claim, not all of it — or backs it for a different population, condition or comparison.
In the citing paper
“residual imbalance was handled through double adjustment in the outcome analyses to achieve double robustness to potential model misspecification.46,47”
From Hysterectomy versus uterine preservation for pelvic organ prolapse surgery: a prospective cohort study (2025) · cites this paper as [47]
Experimental — accuracy not yet measured
Self-check
Percentages, sums and reported differences re-computed from the paper’s own numbers.
The self-check needs the paper’s full text.
Citations
Cites
The central role of the propensity score in observational studies for causal effects
ROSENBAUM, P. R., & RUBIN, D. B. (1983) · Biometrika · doi:10.1093/biomet/70.1.41 · Cited by 31,241
A simulation study of the number of events per variable in logistic regression analysis
Peduzzi, P., Concato, J., Kemper, E., Holford, T. R., & Feinstein, A. R. (1996) · Journal of Clinical Epidemiology · doi:10.1016/s0895-4356(96)00236-3 · Cited by 9,655
Austin, P. C. (2009) · Statistics in Medicine · doi:10.1002/sim.3697 · Cited by 6,758
Relaxing the Rule of Ten Events per Variable in Logistic and Cox Regression
Vittinghoff, E., & McCulloch, C. E. (2007) · American Journal of Epidemiology · doi:10.1093/aje/kwk052 · Cited by 4,359
Matching as Nonparametric Preprocessing for Reducing Model Dependence in Parametric Causal Inference
Ho, D. E., Imai, K., King, G., & Stuart, E. A. (2007) · Political Analysis · doi:10.1093/pan/mpl013 · Cited by 4,285
Lee, T. H.-Y., Marcantonio, E. R., Mangione, C. M., Thomas, E. J., Polanczyk, C. A., Cook, E. F., Sugarbaker, D. J., Donaldson, M. C., Poss, R., Ho, K. K. L., et al. (1999) · Circulation · doi:10.1161/01.cir.100.10.1043 · Cited by 3,749
Variable Selection for Propensity Score Models
Brookhart, M. A., Schneeweiss, S., Rothman, K. J., Glynn, R. J., Avorn, J., & Stürmer, T. (2006) · American Journal of Epidemiology · doi:10.1093/aje/kwj149 · Cited by 2,336
Peduzzi, P., Concato, J., Feinstein, A. R., & Holford, T. R. (1995) · Journal of Clinical Epidemiology · doi:10.1016/0895-4356(95)00048-8 · Cited by 2,154
Lunceford, J. K., & Davidian, M. (2004) · Statistics in Medicine · doi:10.1002/sim.1903 · Cited by 1,676
Research works printed but not linked: 1
- Ho DE, Imai K, King G, Stuart EA. Matching as nonparametric preprocessing for reducing model dependence in parametric causal inference. Polit Anal. 2006;15(3):199–236.
Cited by
Sorted by citations
Items 101–200 of 513
Luo, S., Zheng, X., Bao, W., Nie, S., Ding, Y., Yue, T., Zhou, Y., Hu, Y., Li, H., Yang, Q., et al. (2024) · Signal Transduction and Targeted Therapy · doi:10.1038/s41392-024-01854-9 · Cited by 22
Pulmonary contusions in patients with rib fractures: The need to better classify a common injury
Choi, J., Tennakoon, L., You, J. G., Kaghazchi, A., Forrester, J. D., & Spain, D. A. (2020) · The American Journal of Surgery · doi:10.1016/j.amjsurg.2020.07.022 · Cited by 22
Chan, V. K. Y., Cheung, E. C. L., Chan, S. S. M., Knapp, M. R. J., Hayes, J., Fan, M., Lai, F. T. T., Luo, H., Lum, T. Y. S., Wong, R. S. M., et al. (2022) · The Lancet Regional Health - Western Pacific · doi:10.1016/j.lanwpc.2022.100426 · Cited by 21
Liver Fibrosis Marker and Postoperative Mortality in Patients Without Overt Liver Disease
Zelber‐Sagi, S., O’Reilly-Shah, V. N., Fong, C. T., Wajcman, D. I., Reed, M. J., & Bentov, I. (2022) · Anesthesia & Analgesia · doi:10.1213/ane.0000000000006044 · Cited by 21
Nomah, D. K., Reyes‐Urueña, J., Díaz, Y., Moreno‐Fornés, S., Aceitón, J., Bruguera, A., Vivanco‐Hidalgo, R. M., Casabona, J., Domingo, P., Navarro, J., et al. (2022) · Journal of Antimicrobial Chemotherapy · doi:10.1093/jac/dkac177 · Cited by 21
Huang, Y., Chen, W., Chen, M., Shia, B., & Wu, S. (2022) · Journal of Clinical Medicine · doi:10.3390/jcm11112992 · Cited by 21
Chemotherapy in patients with localized angiosarcoma of any site: A retrospective european study
Conforti, F., Gronchi, A., Penel, N., Jones, R. L., Martín‐Broto, J., Sala, I., Bagnardi, V., Napolitano, A., Pala, L., Pennacchioli, E., et al. (2022) · European Journal of Cancer · doi:10.1016/j.ejca.2022.04.030 · Cited by 21
Salim, H. A., Pulli, B., Yedavalli, V. S., Musmar, B., Adeeb, N., Lakhani, D. A., Essibayi, M. A., Naamani, K. E., Henninger, N., Sundararajan, S. H., et al. (2024) · European Stroke Journal · doi:10.1177/23969873241291465 · Cited by 24
Self-citationJivraj, N. K., Scales, D. C., Gomes, T., Bethell, J., Hill, A. D., Pinto, R. L., Wijeysundera, D. N., & Wunsch, H. (2020) · British Journal of Anaesthesia · doi:10.1016/j.bja.2019.12.006 · Cited by 21
Yang, J. M., Choi, S. U., Kim, Y. J., Kim, R., Yon, D. K., Lee, S. W., Shin, J. I., Lee, J. Y., & Kim, J.-G. (2021) · Retina · doi:10.1097/iae.0000000000003262 · Cited by 21
Nguyen, T., & Xie, L. (2020) · Journal of Clinical Epidemiology · doi:10.1016/j.jclinepi.2020.10.012 · Cited by 21
Self-citationEffectiveness of BNT162b2 COVID-19 Vaccination in Children and Adolescents
Klein, N. P., Demarco, M., Fleming-Dutra, K. E., Stockwell, M. S., Kharbanda, A. B., Gaglani, M., Rao, S., Lewis, N., Irving, S. A., Hartmann, E., et al. (2023) · PEDIATRICS · doi:10.1542/peds.2022-060894 · Cited by 20
Distressing testing: A propensity score analysis of high-stakes exam failure and mental health
Beck, K. C., Røhr, H. L., Reme, B., & Flatø, M. (2023) · Child Development · doi:10.1111/cdev.13985 · Cited by 20
Hamilton, F., Arnold, D., Henley, W., & Payne, R. (2020) · European Respiratory Journal · doi:10.1183/13993003.02795-2020 · Cited by 20
Thomson, R., Kopasker, D., Leyland, A. H., Pearce, A., & Katikireddi, S. V. (2022) · International Journal of Epidemiology · doi:10.1093/ije/dyac226 · Cited by 20
Morgan, J. A., Biggio, J., Martin, J. K., Mussarat, N., Elmayan, A., Chawla, H. K., Kandalaft, S., Magalski, G. R., Puri, P., & Williams, F. B. (2023) · Obstetrics and Gynecology · doi:10.1097/aog.0000000000005072 · Cited by 19
Schaffner, S. L., Casazza, W., Artaud, F., Konwar, C., Merrill, S. M., Domenighetti, C., Schulze-Hentrich, J. M., Lesage, S., Brice, A., Corvol, J., et al. (2024) · npj Parkinson s Disease · doi:10.1038/s41531-024-00704-3 · Cited by 19
Hawley, S. J., Ali, M. S., Cordtz, R., Dreyer, L., Edwards, C. J., Arden, N., Cooper, C. C., Judge, A., Hyrich, K. L., & Prieto‐Alhambra, D. (2018) · Lara D. Veeken · doi:10.1093/rheumatology/key424 · Cited by 19
Brennand, E. A., Scime, N. V., Huang, B., Edwards, A. D., Kim-Fine, S., Hall, J., Birch, C., Robert, M., & Carter Ramirez, A. (2025) · American Journal of Obstetrics and Gynecology · doi:10.1016/j.ajog.2024.10.021 · Cited by 18
Domnich, A., Panatto, D., Pariani, E., Napoli, C., Chironna, M., Manini, I., Rizzo, C., Orsi, A., & Icardi, G. (2022) · International Journal of Infectious Diseases · doi:10.1016/j.ijid.2022.10.041 · Cited by 18
Kallas, K.-A., Marr, K., Moirangthem, S., Heude, B., Koehl, M., van der Waerden, J. E. B., & Downes, N. (2023) · Journal of Clinical Medicine · doi:10.3390/jcm12031120 · Cited by 16
A deeper dive, a wider pool: Preschool benefits sustain to first grade on a broader set of outcomes
Johnson, A. D., Partika, A. C., Martin, A., Horm, D. M., Phillips, D. A., & the Tulsa SEED Study Team (2023) · Child Development · doi:10.1111/cdev.13928 · Cited by 21
Balas, M., Jaja, B. N. R., Harrington, E. M., Jack, A. S., Hofereiter, J., Malhotra, A. K., Jaffe, R. H., He, Y., Byrne, J. P., Wilson, J. R., et al. (2023) · Neurosurgery · doi:10.1227/neu.0000000000002575 · Cited by 18
Cottone, F., Anota, A., Bonnetain, F., Collins, P. G. S., & Efficace, F. (2019) · Pharmacoepidemiology and Drug Safety · doi:10.1002/pds.4756 · Cited by 18
Laurés, N., Konecki, C., Brügel, M., Giffard, A.-L., Abdelli, N., Botsen, D., Carlier, C., Gozalo, C., Féliu, C., Slimano, F., et al. (2022) · Pharmaceutics · doi:10.3390/pharmaceutics14102119 · Cited by 16
Thomson, R., Kopasker, D., Leyland, A. H., Pearce, A., & Katikireddi, S. V. (2022) · Psychological Medicine · doi:10.1017/s0033291722003580 · Cited by 19
Durey, B., Djerada, Z., Boujibar, F., Besnier, E., Montagne, F., Baste, J., Dusseaux, M.-M., Compère, V., Clavier, T., & Selim, J. (2023) · Cancers · doi:10.3390/cancers15082306 · Cited by 16
Davies, A. R., Sabharwal, S., Liddle, A. D., Zamora, B., Rangan, A., & Reilly, P. (2024) · Journal of Shoulder and Elbow Surgery · doi:10.1016/j.jse.2024.01.053 · Cited by 16
Kaur, J., Nakafero, G., Abhishek, A., Mallen, C. D., Doherty, M., & Zhang, W. (2024) · Arthritis Care & Research · doi:10.1002/acr.25471 · Cited by 18
Karim, M. E., Pellegrini, F., Platt, R. W., Simoneau, G., Rouette, J., & de Moor, C. (2020) · Multiple Sclerosis Journal · doi:10.1177/1352458520972557 · Cited by 16
Bastawrous, A. L., Brockhaus, K. K., Chang, M. I., Milky, G., Shih, I., Li, Y., & Cleary, R. K. (2021) · Surgical Endoscopy · doi:10.1007/s00464-021-08338-9 · Cited by 16
Association between Preexisting Sarcopenia and Stroke in Patients with Type 2 Diabetes Mellitus
Chai, K.-C., Chen, W.-M., Chen, M.-H., Shia, B., & Wu, S. (2022) · The journal of nutrition health & aging · doi:10.1007/s12603-022-1846-0 · Cited by 16
Lapin, B. R., & Katzan, I. L. (2022) · Journal of General Internal Medicine · doi:10.1007/s11606-021-07340-0 · Cited by 16
Amano, T., Reynolds, A., Scher, C. J., & Jia, Y. (2021) · Dementia and Geriatric Cognitive Disorders · doi:10.1159/000519581 · Cited by 15
Davis, M. L., Neelon, B., Nietert, P. J., Burgette, L. F., Hunt, K. J., Lawson, A. B., & Egede, L. E. (2021) · International Journal of Health Geographics · doi:10.1186/s12942-021-00265-1 · Cited by 15
Gogna, S., Latifi, R., Samson, D. J., & Butler, J. R. (2021) · European Journal of Trauma and Emergency Surgery · doi:10.1007/s00068-021-01772-3 · Cited by 14
Song, Y. J., Huh, G., Kim, E. H., Lee, J. B., & Park, D. H. (2023) · Gastrointestinal Endoscopy · doi:10.1016/j.gie.2023.05.049 · Cited by 14
Català, M., Burn, E., Rathod‐Mistry, T., Xie, J., Delmestri, A., Prieto‐Alhambra, D., & Jödicke, A. M. (2023) · International Journal of Epidemiology · doi:10.1093/ije/dyad138 · Cited by 16
He, M., Pawar, A. M., Desai, R. J., Glynn, R. J., Lee, H., Weinblatt, M. E., Solomon, D. H., & Kim, S. C. (2021) · Seminars in Arthritis and Rheumatism · doi:10.1016/j.semarthrit.2021.10.001 · Cited by 14
Prats‐Uribe, A., Kolovos, S., Berencsi, K., Carr, A. J., Judge, A., Silman, A. J., Arden, N., Petersen, I., Douglas, I., Wilkinson, J. M., et al. (2021) · Health Technology Assessment · doi:10.3310/hta25660 · Cited by 14
Gangadhar, A., Hasjim, B. J., Zhao, X., Sun, Y., Chon, J., Sidhu, A., Jaeckel, E., Selzner, N., Cattral, M. S., Sayed, B. A., et al. (2025) · Journal of Hepatology · doi:10.1016/j.jhep.2025.04.040 · Cited by 13
Pawar, A. M., Desai, R. J., He, M., Bessette, L. G., & Kim, S. C. (2021) · ACR Open Rheumatology · doi:10.1002/acr2.11292 · Cited by 13
Qu, X., Wang, Q., Zhang, J., He, W., Zhang, F., & Zhang, W. (2023) · Journal of Oral Rehabilitation · doi:10.1111/joor.13623 · Cited by 16
Han, S. J., & Kim, K. H. (2024) · Journal of Preventive Medicine and Public Health · doi:10.3961/jpmph.23.250 · Cited by 13
Molina, K. C., Webb, B. J., Kennerley, V. M., Beaty, L. E., Bennett, T. D., Carlson, N. E., Mayer, D. A., Peers, J. L., Russell, S., Wynia, M. K., et al. (2024) · BMC Infectious Diseases · doi:10.1186/s12879-024-09708-z · Cited by 13
Sarmanova, A., Doherty, M., Kuo, C., Wei, J., Abhishek, A., Mallen, C. D., Zeng, C., Wang, Y., Lei, G., & Zhang, W. (2020) · Rheumatology · doi:10.1093/rheumatology/keaa044 · Cited by 16
Kulalert, P., Phinyo, P., Patumanond, J., Smathakanee, C., Chuenjit, W., & Nanthapisal, S. (2020) · Asthma Research and Practice · doi:10.1186/s40733-020-00059-5 · Cited by 13
Chang, J. C. H., Young, C. C., Muscal, E., Tejtel, S. K. S., Newhams, M. M., Kücükak, S., Crandall, H., Maddux, A. B., Rowan, C. M., Halasa, N., et al. (2023) · Arthritis & Rheumatology · doi:10.1002/art.42495 · Cited by 13
Rhee, J. J., Han, J., Montez‐Rath, M. E., & Chertow, G. M. (2024) · Diabetes Obesity and Metabolism · doi:10.1111/dom.15427 · Cited by 15
The effect of LNG bunkering on port competitiveness using multilevel data analysis
Yao, A. F., Sèbe, M., Virto, L. R., Nassiri, A., & Dumez, H. (2024) · Transportation Research Part D Transport and Environment · doi:10.1016/j.trd.2024.104240 · Cited by 17
Addition of Macrolide Antibiotics for Hospital Treatment of Community-Acquired Pneumonia
Wei, J., Walker, A. S., & Eyre, D. W. (2024) · The Journal of Infectious Diseases · doi:10.1093/infdis/jiae639 · Cited by 12
Direct-Acting Antivirals and Risk of Hepatitis C Extrahepatic Manifestations
Jeong, D., Wong, S., Karim, M. E., Manges, A. R., Makuza, J. D., García, H. A. V., Adu, P., Binka, M., Yu, A., Bartlett, S. R., et al. (2025) · JAMA Network Open · doi:10.1001/jamanetworkopen.2025.14631 · Cited by 12
Prognostic importance of long-term SBP variability in high-risk hypertension
Pinto, R. D., Pietropaoli, D., Dobre, M. A., & Ferri, C. (2020) · Journal of Hypertension · doi:10.1097/hjh.0000000000002552 · Cited by 15
Cheddani, L., Haymann, J., Liabeuf, S., Tabibzadeh, N., Boffa, J., Letavernier, E., Essig, M., Drüeke, T. B., Delahousse, M., Massy, Z. A., et al. (2020) · Clinical Kidney Journal · doi:10.1093/ckj/sfaa120 · Cited by 12
Impact of the matching algorithm on the treatment effect estimate: A neutral comparison study
Heinz, P., Wendel‐Garcia, P. D., & Held, U. (2022) · Zurich Open Repository and Archive (University of Zurich) · doi:10.5167/uzh-223417 · Cited by 12
Chang, J. C. H., Weiss, P. F., Xiao, R., Atkinson, M. A., & Wenderfer, S. E. (2022) · Kidney International · doi:10.1016/j.kint.2022.04.023 · Cited by 12
Johnson, T. M., Walker, D. R., Lockefeer, A., Jiang, B., Nimke, D., Lozano‐Ortega, G., & Kimura, T. (2022) · Neurourology and Urodynamics · doi:10.1002/nau.25040 · Cited by 11
More intensive therapy has a better effect for frail parents with multiple myeloma
DuMontier, C., La, J., Bihn, J. R., Corrigan, J., Yildirim, C., Dharne, M., Hassan, H., Yellapragada, S. V., Abel, G. A., Gaziano, J. M., et al. (2023) · Blood Advances · doi:10.1182/bloodadvances.2023011019 · Cited by 12
Methods in pharmacoepidemiology
Sommet, A., & Pariente, A. (2019) · Therapies · doi:10.1016/j.therap.2018.11.015 · Cited by 16
Miano, T. A., Shashaty, M. G. S., Yang, W. P., Brown, J. R., Zuppa, A. F., & Hennessy, S. (2020) · Kidney360 · doi:10.34067/kid.0001432020 · Cited by 12
Singh, T. P., Wong, S. A., Quigley, F., Jenkins, J. S., & Golledge, J. (2020) · Atherosclerosis · doi:10.1016/j.atherosclerosis.2020.08.029 · Cited by 12
Hermosilla, E., Coma, E., Xie, J., Feng, S., Cabezas, C., Méndez-Boo, L., Avilés, F. F., Balló, E., Martínez, M., Medina, M., et al. (2022) · Nature Communications · doi:10.1038/s41467-022-29301-9 · Cited by 12
IDRIS, I. R., Zhang, R., Mamza, J. B., Ford, M., Morris, T., Banerjee, A., & Khunti, K. K. (2022) · Diabetes Obesity and Metabolism · doi:10.1111/dom.14799 · Cited by 11
Lee, H., Kwon, Y., Bae, J., Yoo, S., Yoon, H., Yoon, S., Kim, J., Bahk, J.-H., & Kim, W. H. (2020) · Anesthesia & Analgesia · doi:10.1213/ane.0000000000004926 · Cited by 11
Wenzel, A. N., Marrache, M., Schmerler, J., Kinney, J., Khanuja, H. S., & Hegde, V. V. (2023) · The Journal of Arthroplasty · doi:10.1016/j.arth.2023.10.016 · Cited by 11
Kibuchi, E., Sturgis, P., Durrant, G. B., & Maslovskaya, O. (2024) · Journal of Survey Statistics and Methodology · doi:10.1093/jssam/smae017 · Cited by 13
Salim, H. A., Pulli, B., Yedavalli, V. S., Milhem, F. S., Musmar, B., Adeeb, N., Lakhani, D. A., Essibayi, M. A., Heit, J. J., Faizy, T. D., et al. (2024) · Journal of NeuroInterventional Surgery · doi:10.1136/jnis-2024-022467 · Cited by 11
Self-citationGiolito, A., Lévy, C., Varon, E., Cohen, R., Hanna, S., Assad, Z., Lenglart, L., Béchet, S., Bonacorsi, S., Dubos, F., et al. (2025) · The Lancet Child & Adolescent Health · doi:10.1016/s2352-4642(25)00029-x · Cited by 11
Cohen‐Mekelburg, S., Wallace, B. I., Van, T., Wiitala, W. L., Govani, S. M., Burns, J., Lipson, R., Yun, H., Hou, J. K., Lewis, J. D., et al. (2021) · JAMA Network Open · doi:10.1001/jamanetworkopen.2021.0313 · Cited by 11
Tsai, Y.-H., Chen, W., Chen, M., Shia, B., Wu, S., & Huang, C.-C. (2022) · Cancers · doi:10.3390/cancers14133246 · Cited by 11
Effect of Sleep Disorders on the Risks of Cancers and Site-Specific Cancers
Zheng, S.-M. W., Chen, J.-W., Huang, Y., Chen, W., & Wu, S. (2022) · Sleep Medicine · doi:10.1016/j.sleep.2022.08.014 · Cited by 11
Molina, K. C., Kennerley, V. M., Beaty, L. E., Bennett, T. D., Carlson, N. E., Mayer, D. A., Peers, J. L., Russell, S., Wynia, M. K., Aggarwal, N. R., et al. (2023) · International Journal of Infectious Diseases · doi:10.1016/j.ijid.2023.04.396 · Cited by 11
Assawapalanggool, S., Kasatpibal, N., Sirichotiyakul, S., Arora, R., Suntornlimsiri, W., & Apisarnthanarak, A. (2018) · Antimicrobial Resistance and Infection Control · doi:10.1186/s13756-018-0304-6 · Cited by 11
Kim, M., Okunowo, O., Ades, A. M., Fuller, S., Rintoul, N. E., & Naim, M. Y. (2021) · The Journal of Pediatrics · doi:10.1016/j.jpeds.2021.06.059 · Cited by 11
Balas, M., Proemmel, P., Nguyen, L., Jack, A. S., Lebovic, G., Badhiwala, J. H., da Costa, L., Nathens, A. B., Fehlings, M. G., Wilson, J. R., et al. (2021) · Journal of Neurotrauma · doi:10.1089/neu.2021.0177 · Cited by 12
Association of Diabetes Severity and Mortality with Lung Squamous Cell Carcinoma
Su, C.-H., Chen, W., Chen, M., Shia, B., & Wu, S. (2022) · Cancers · doi:10.3390/cancers14102553 · Cited by 12
Morbidity and Mortality of Hospital-Onset SARS-CoV-2 Infections Due to Omicron Versus Prior Variants
Klompas, M., McKenna, C. S., Kanjilal, S., Pak, T. R., Rhee, C., & Chen, T. (2024) · Annals of Internal Medicine · doi:10.7326/m24-0199 · Cited by 10
Anesthesia for cesarean delivery and subsequent depression: A nationwide retrospective cohort study
Chen, Y.-C., Liang, F.-W., Ho, C.-H., Chang, Y.-J., Hung, K.-C., Chu, C.-C., Chen, J.-Y., & Yu, C.-H. (2024) · Journal of Affective Disorders · doi:10.1016/j.jad.2024.07.147 · Cited by 10
Li, M., Fan, X., Li, J., Wang, J., Yin, P., Zuo, R., Xie, Y. J., & Hao, C. (2024) · International Journal for Equity in Health · doi:10.1186/s12939-024-02297-y · Cited by 10
Impact of Perioperative Pulmonary Artery Catheter Use on Clinical Outcomes After Cardiac Surgery
Ju, J., Chung, J., Heo, G., Cho, Y. J., Jeon, Y., & Nam, K. (2024) · CHEST Journal · doi:10.1016/j.chest.2024.10.008 · Cited by 10
Ling, R. R., Chen, Y., Low, C. J. W., Agerstrand, C. L., Jung, J. S., Lim, S. L., Lorusso, R., Müeller, T., Okada, Y., Tonna, J. E., et al. (2025) · Critical Care · doi:10.1186/s13054-025-05345-3 · Cited by 10
Paracetamol use and lowered risk of acute kidney injury in patients with rhabdomyolysis
Desgrouas, M., & Boulain, T. (2021) · Journal of Nephrology · doi:10.1007/s40620-020-00950-7 · Cited by 10
Maternal Pregnancy Intention and Developmental Outcomes in Brazilian Preschool-Aged Children
Jang, M., Molino, A. R., Ribeiro, M. V., Mariano, M., Martins, S. S., Caetano, S. C., & Surkan, P. J. (2021) · Journal of Developmental & Behavioral Pediatrics · doi:10.1097/dbp.0000000000000951 · Cited by 10
Evidence of Stability in Patient-Reported Global Health During the COVID-19 Pandemic
Lapin, B. R., Tang, W. H. W., Honomichl, R. D., Hogue, O., & Katzan, I. L. (2021) · Value in Health · doi:10.1016/j.jval.2021.06.009 · Cited by 10
James, M., Bentley, R. A., Womack, J., & Goodman, B. A. (2022) · Canadian Journal of Anesthesia/Journal canadien d anesthésie · doi:10.1007/s12630-022-02279-0 · Cited by 10
Pécastaing, N., & Salavarriga, J. (2022) · Ecological Economics · doi:10.1016/j.ecolecon.2022.107598 · Cited by 13
Assisted reproductive technology treatment and risk of multiple sclerosis – a Danish cohort study
Kopp, T. I., Pinborg, A. B., Glazer, C. H., & Magyari, M. (2022) · Fertility and Sterility · doi:10.1016/j.fertnstert.2022.10.027 · Cited by 10
The effect of philosophy on critical reading: Evidence from initial teacher education in Colombia
Farieta, A., & Delprato, M. (2023) · International Journal of Educational Development · doi:10.1016/j.ijedudev.2023.102974 · Cited by 15
Dmytriw, A. A., Salim, H. A., Musmar, B., Cancelliere, N. M., Griessenauer, C. J., Regenhardt, R. W., Jones, J. G. A., Tutino, V. M., Hasan, Z., Limbucci, N., et al. (2024) · Clinical Neuroradiology · doi:10.1007/s00062-024-01435-x · Cited by 10
Timpson, M. L., Hade, E. M., Beaulieu, C. L., Horn, S. D., Hammond, F. M., Peng, J., Montgomery, E., Giuffrida, C. G., Gilchrist, K., Lash, A., et al. (2018) · Archives of Physical Medicine and Rehabilitation · doi:10.1016/j.apmr.2018.11.015 · Cited by 10
Statin use and outcome risks according to predicted CVD risk in Korea: A retrospective cohort study
Jung, H. H. (2021) · PLoS ONE · doi:10.1371/journal.pone.0245609 · Cited by 10
Wongtanasarasin, W., Ungrungseesopon, N., Namsongwong, N., Chotipongkul, P., Visavakul, O., Banping, N., Kampeera, W., & Phinyo, P. (2022) · Turkish Journal of Emergency Medicine · doi:10.4103/2452-2473.342805 · Cited by 10
Patanwala, A. E., Xiao, X., Hills, T. E., Higgins, A. M., McArthur, C. J., Alexander, G. C., & Mehta, H. B. (2024) · Critical Care Medicine · doi:10.1097/ccm.0000000000006444 · Cited by 10
Local Economic Impacts of Wind Power Deployment in Denmark
Gavard, C., Göbel, J., & Schoch, N. (2025) · Environmental and Resource Economics · doi:10.1007/s10640-025-00982-2 · Cited by 9
Lewing, B., Sansgiry, S., Abughosh, S., Lal, L. S., Essien, E. J., & Sansgiry, S. S. (2022) · Postgraduate Medicine · doi:10.1080/00325481.2022.2061260 · Cited by 9
Karim, M. E. (2024) · BMC Medical Research Methodology · doi:10.1186/s12874-024-02284-5 · Cited by 11
Ou, L., Chen, J., Hillman, K., Flabouris, A., Parr, M. J., & Green, M. (2020) · Resuscitation · doi:10.1016/j.resuscitation.2020.01.021 · Cited by 9
Buranupakorn, T., Thangsuk, P., Patumanond, J., & Phinyo, P. (2021) · Cancers · doi:10.3390/cancers13050992 · Cited by 9
Wu, S., Chang, S.-C., Chen, C.-I., & Huang, C. (2021) · Cancers · doi:10.3390/cancers13071517 · Cited by 9
Cheng, H.-Y., Lin, H., Lin, H., Uang, Y. S., Keller, J. J., & Wang, L. (2022) · Frontiers in Pharmacology · doi:10.3389/fphar.2021.805318 · Cited by 9
Metadata
- Authors
- Nguyen, T.-L., Collins, G. S., Spence, J., Daurès, J.-P., Devereaux, P. J., Landais, P., & Le Manach, Y.
- Affiliations
- Université de Montpellier (FR)
- Population Health Research Institute (CA)
- Venue
- BMC Medical Research Methodology
- Published
- 2017-04-28
- Volume
- 17
- Issue
- 1
- Pages
- 78-78
- ISSN
- 1471-2288 (ISSN-L)
- PMC
- PMC5408373
- OpenAlex
- W2609185034
- Cited by
- 512
- References
- 35
- Citations by year
- 2026: 65 · 2025: 79 · 2024: 76 · 2023: 76 · 2022: 86 · 2021: 61 · 2020: 32 · 2019: 19 · 2018: 12 · 2017: 5
- FWCI
- 12.93
- Type
- journal article
- Language
- en
- Open access
- gold
- doi.org
- Licence
- cc-by
- Locations
- BMC Medical Research Methodology (publishedVersion, cc-by)
- Europe PMC (PubMed Central) (publishedVersion, cc-by)
- PubMed Central (publishedVersion, cc-by)
- PubMed (publishedVersion)
- University of Birmingham Research Portal (University of Birmingham) (publishedVersion, other-oa)
- HAL (submittedVersion, cc-by)
- DOAJ (DOAJ: Directory of Open Access Journals) (submittedVersion, cc-by-sa)
- Funders
- None
- Topics
- Physical Sciences › Mathematics › Statistics and Probability › Advanced Causal Inference Techniques
- Physical Sciences › Mathematics › Statistics and Probability › Statistical Methods in Clinical Trials
- Physical Sciences › Mathematics › Statistics and Probability › Statistical Methods in Epidemiology
- Keywords
- propensity score matching, standardized mean difference, covariate balance, regression adjustment, confounding, nearest neighbor matching, treatment effect estimation, mean squared error
- MeSH terms
- Algorithms, Computer Simulation, Humans, Monte Carlo Method, Models, Statistical, Bias, Logistic Models, Propensity Score
About these checks
Registry, retraction, Cites and statistics results are computed, not judged, with one exception: a printed reference that no index lists is read once by a model before it counts as a citation error. Claims are extracted by a model and kept only when their quote appears verbatim in the text; each cited source is then checked, with a model’s help, for whether it says what the claim relies on. Those verdicts can be wrong — read the claim’s quote and the cited source before relying on one.
Statistics and arithmetic are recomputed, not judged.
Confidence bands are shown only for fields calibrated on our annotated test set. None is calibrated yet, so no band is shown.
What counts as a claim ›How we measure confidence ›How we check this ›
Are you an author, or do you see a problem with this page? Request a review
