

The DOI matches its Crossref record; 8 of the 8 references it cites were found in a registry or an index.
Accurate interpretation of thyroid dysfunction during pregnancy: should we continue to use published guidelines instead of population-based gestation-specific reference intervals for the thyroid-stimulating hormone (TSH)?
Abstract
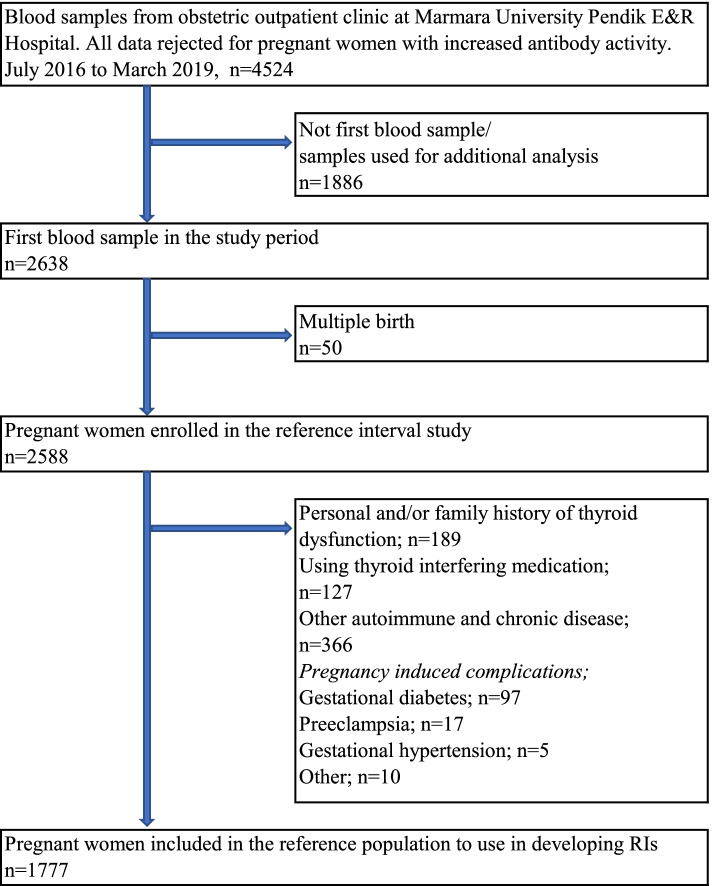
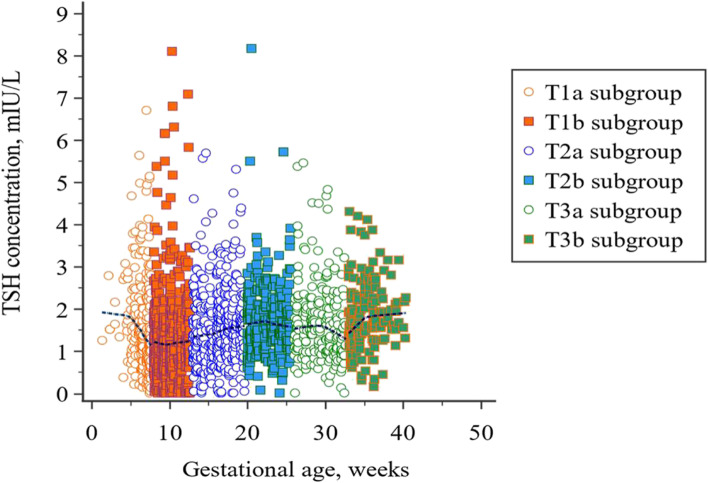
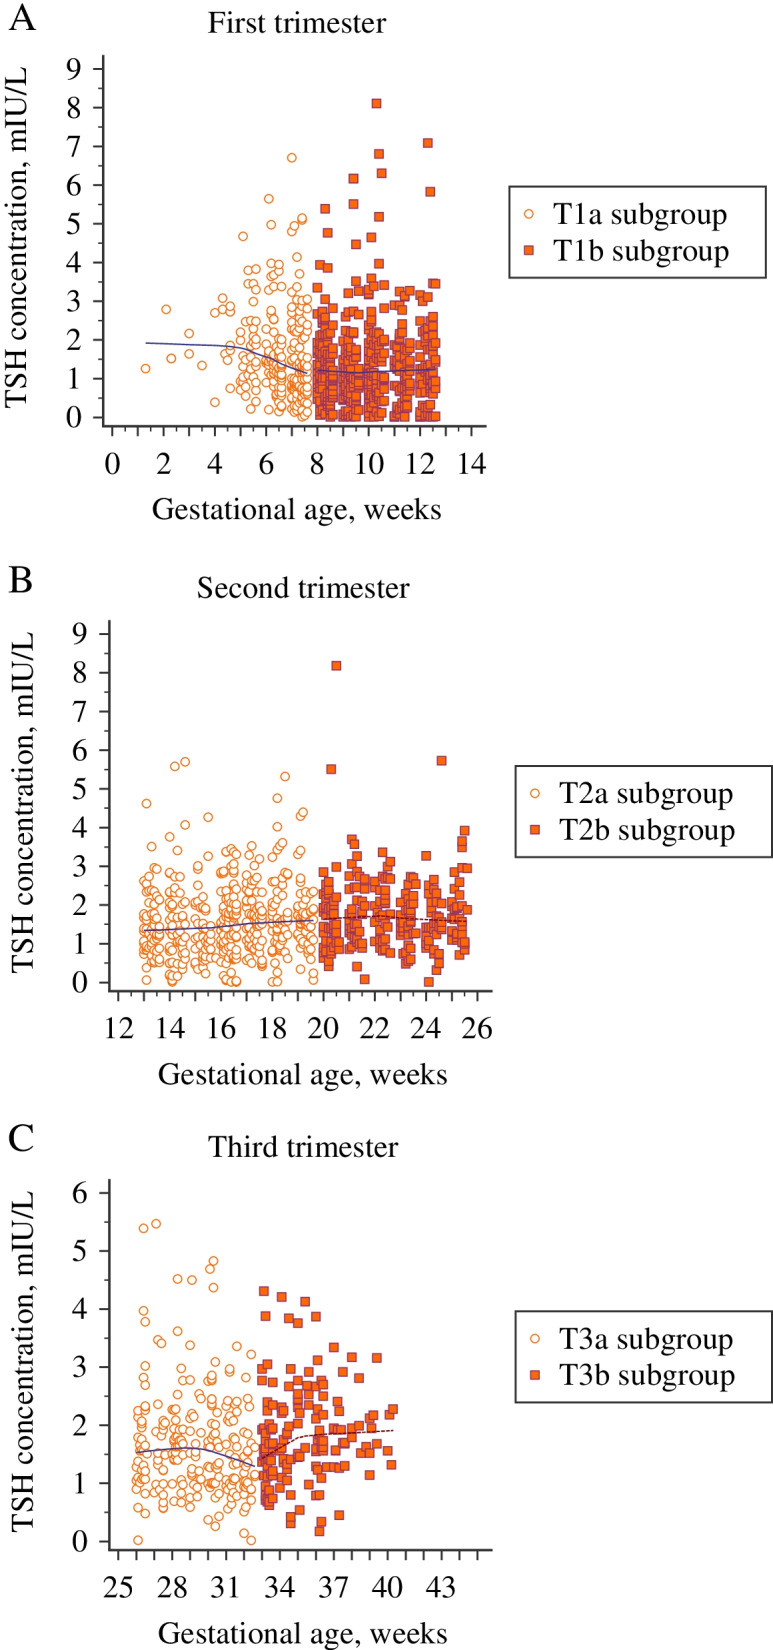
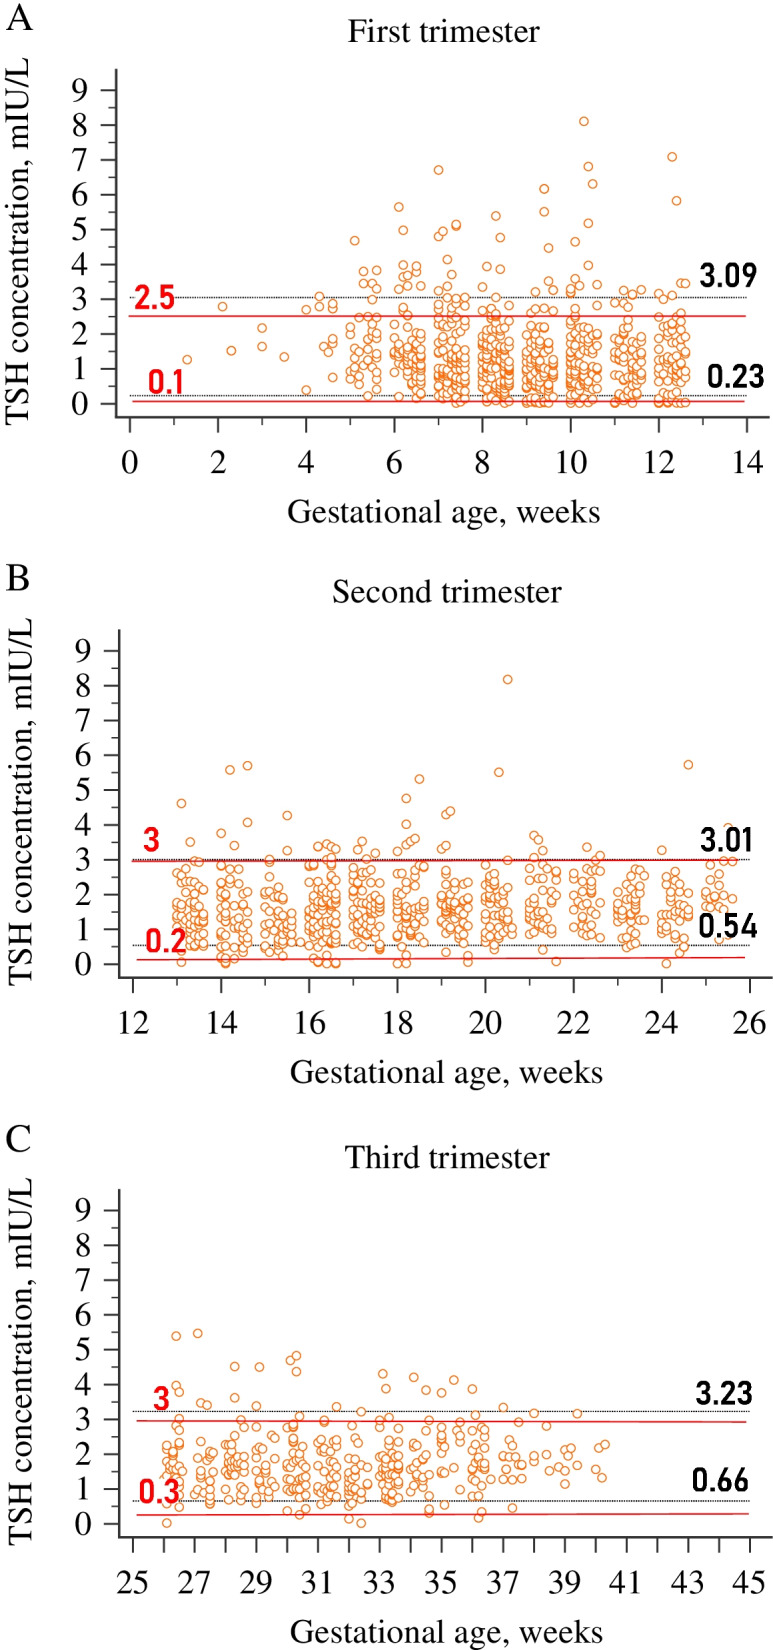
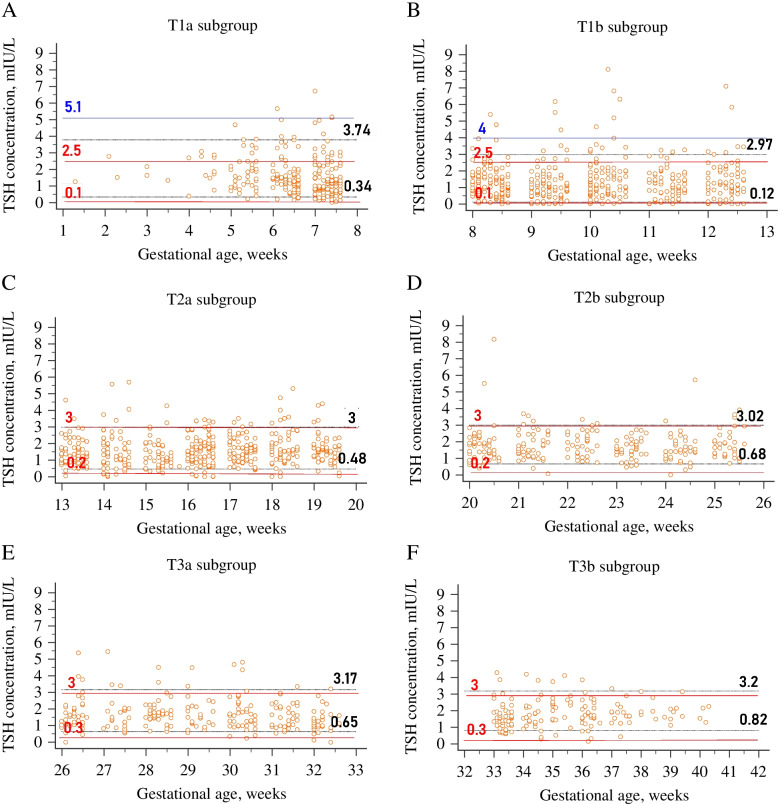
Background: Considering the changes in thyroid physiology associated with pregnancy and poor outcomes related to abnormal maternal thyroid function, international guidelines recommend using population-based trimester-specific reference intervals (RIs) for thyroid testing. If these RIs are not available in the laboratory, implementing recommended fixed cut-off values globally is still controversial. To address this issue, we aimed to establish appropriate RI of thyroid-stimulating hormone (TSH) in pregnant Turkish women for our laboratory and compare the prevalence of thyroid dysfunction based on the established and recommended criteria. Methods: Of 2638 pregnant women, 1777 women followed in the obstetric outpatient were enrolled in the reference interval study after applying exclusion criteria related to medical and prenatal history. A retrospective study was conducted by collecting data from July 2016 to March 2019. Serum TSH was measured by UniCel DxI 800 Immunoassay System (Beckman Coulter Inc., Brea, CA, USA). The study design relied on two approaches in order to classify pregnant women: trimester-specific and subgroup-specific; the latter involved dividing each trimester into two subgroups: T1 a, T1 b, T2 a, T2 b, T3 a, T3 b. The lower and upper limits of the RIs were derived by the parametric method after normalizing the data distribution using the modified Box-Cox power transformation method. Results: The lowest TSH value was detected at 8-12 weeks in early pregnancy, and the median value of TSH in the T1 b subgroup was significantly lower than the T1 a subgroup (P < 0.05). TSH levels showed a gradual trend of increase along with the pregnancy and increased significantly in the T2 a, T2 b, and T3 b subgroups compared to the preceding subgroups (P < 0.05). Compared to the diagnostic criteria recommended by American Thyroid Association (ATA), the prevalence of thyroid dysfunction was significantly different from the established trimester- and subgroup-specific RIs throughout the pregnancy (P < 0.001). Conclusions: We conclude that establishing gestation- and laboratory-specific RIs, especially for TSH, is essential for diagnosing thyroid disorders in pregnancy, and the recommended universal cut-off values, which may contribute to the risk of a misdiagnosis or a missed diagnosis, should be taken with caution in the clinical setting. However, regarding the fluctuation of thyroid function tests throughout pregnancy, trimester-specific RIs are insufficient, and implementing split phases is required.
Overview
The claims and statistics of this paper haven’t been checked yet.
Run the check — free, no account needed. It reads the open-access text and checks the sources it cites.
Integrity signals
Registry
Cites
Statistics
Figures
Verification
Claims the paper makes
The claims and statistics of this paper haven’t been checked yet.
Run the check — free, no account needed. It reads the open-access text and checks the sources it cites.
Claims other papers make about this one
Each is checked against this paper’s own text: does it say what the citing paper says it does?
In the citing paper
“In Ghana and other sub-Saharan African nations, these results are in line with research that shows regional disparities in healthcare access and resource distribution [21], [22], [23].”
From The Burden of Hospital Morbidity and Mortality in Ghana: A Four-Year Retrospective Analysis of National Data (2026) · cites this paper as [22]
Self-check
Percentages, sums and reported differences re-computed from the paper’s own numbers.
The self-check needs the paper’s full text.
Citations
Cites
Stagnaro-Green, A., Abalovich, M., Alexander, E., Azizi, F., Mestman, J., Negro, R., Nixon, A., Pearce, E. N., Soldin, O. P., Sullivan, S., et al. (2011) · Thyroid · doi:10.1089/thy.2011.0087 · Cited by 2,942
Glinoer, D. (1997) · Endocrine Reviews · doi:10.1210/edrv.18.3.0300 · Cited by 1,364
Cooper, D. S., & Laurberg, P. (2013) · The Lancet Diabetes & Endocrinology · doi:10.1016/s2213-8587(13)70086-x · Cited by 310
Free T4 immunoassays are flawed during pregnancy
Lee, R. H., Spencer, C. A., Mestman, J. H., Miller, E. A., Petrovic, I., Braverman, L. E., & Goodwin, T. M. (2009) · American Journal of Obstetrics and Gynecology · doi:10.1016/j.ajog.2008.10.042 · Cited by 281
Li, C., Shan, Z., Mao, J., Wang, W., Xie, X., Zhou, W., Li, C., Xu, B., Bi, L., Meng, T., et al. (2014) · The Journal of Clinical Endocrinology & Metabolism · doi:10.1210/jc.2013-1674 · Cited by 249
Dashe, J. S., Casey, B. M., Wells, C. E., McIntire, D. D., Byrd, E. W., Leveno, K. J., & Cunningham, F. G. (2005) · Obstetrics & Gynecology · doi:10.1097/01.aog.0000175836.41390.73 · Cited by 203
Ethnic differences in maternal thyroid parameters during pregnancy: the Generation R study
Korevaar, T. I. M., Medici, M., de Rijke, Y. B., Visser, W., de Muinck Keizer-Schrama, S. M. P. F., Jaddoe, V. W. V., Hofman, A., Ross, H. A., Visser, W. E., Hooijkaas, H., et al. (2013) · The Journal of Clinical Endocrinology & Metabolism · doi:10.1210/jc.2013-2005 · Cited by 150 · cited 1×
“also reported misinterpretation of TSH in 18% of pregnant women due to ethnic discrepancy [25].”
BackgroundDrugs affecting thyroid function
Barbesino, G. (2010) · Thyroid · doi:10.1089/thy.2010.1635 · Cited by 146
Research works printed but not linked: 34
- Moleti M, Trimarchi F, Vermiglio F. Thyroid physiology in pregnancy. Endocr Pract. 2014;20(6):589–96. · DOI
- Alexander EK, Pearce EN, Brent GA, Brown RS, Chen H, Dosiou C, et al. Guidelines of the American Thyroid Association for the diagnosis and management of thyroid disease during pregnancy and the postpartum. Thyroid. 2017;27(3):315–89. · DOI · Paper page
- Krassas GE, Poppe K, Glinoer D. Thyroid function and human reproductive health. Endocr Rev. 2010;31(5):702–55. · DOI · Paper page
- Schneuer FJ, Nassar N, Tasevski V, Morris JM, Roberts CL. Association and predictive accuracy of high TSH serum levels in first trimester and adverse pregnancy outcomes. J Clin Endocrinol Metab. 2012;97(9):3115–22. · DOI
- Lao TT. Thyroid disorders in pregnancy. Curr Opin Obstet Gynecol. 2005;17(2):123–7. · DOI
- Mestman JH. Hyperthyroidism in pregnancy. Best Pract Res Clin Endocrinol Metab. 2004;18(2):267–8. · DOI
- Abalovich M, Amino N, Barbour LA, Cobin RH, De Groot LJ, Glinoer D, et al. Management of thyroid dysfunction during pregnancy and postpartum: an Endocrine Society clinical practice guideline. J Clin Endocrinol Metab. 2007;92(Suppl 8):1–47. · DOI
- De Groot L, Abalovich M, Alexander EK, Amino N, Barbour L, Cobin RH, et al. Management of thyroid dysfunction during pregnancy and postpartum: an Endocrine Society clinical practice guideline. J Clin Endocrinol Metab. 2012;97(8):2543–65. · DOI
- Jones G, Haeckel R, Loh TP, Sikaris K, Streichert T, Katayev A, et al. Indirect methods for reference interval determination – review and recommendations. Clin Chem Lab Med. 2018;57(1):20–9. · DOI
- Demers LM, Spencer CA. Laboratory medicine practice guidelines: laboratory support for the diagnosis and monitoring of thyroid disease. Washington, DC: National Academy of Clinical Biochemistry; 2002. https://www.aacc.org/science-and-research/practice-guidelines/thyroid-disease. Accessed 16 May 2021
- Surks MI, Sievert R. Drugs and thyroid function. N Engl J Med. 1995;333(25):1688–94. · DOI
- Ichihara K, Kawai T. Determination of reference intervals for 13 plasma proteins based on IFCC international reference preparation (CRM470) and NCCLS proposed guideline (C28-P,1992): trial to select reference individuals by results of screening tests and application of maximal likelihood method. J Clin Lab Anal. 1996;10(2):110–7. · DOI
- McHugh ML. Interrater reliability: the kappa statistic. Biochem Medica. 2012;22(3):276–82. · DOI · Paper page
- Glinoer D, Spencer CA. Serum TSH determinations in pregnancy: how, when and why? Nat Rev Endocrinol. 2010;6(9):526–9. · DOI
- Roti E, Gardini E, Minelli R, Bianconi L, Flisi M. Thyroid function evaluation by different commercially available free thyroid hormone measurement kits in term pregnant women and their newborns. J Endocrinol Investig. 1991;14(1):1–9. · DOI
- Gilbert RM, Hadlow NC, Walsh JP, Fletcher SJ, Brown SJ, Stuckey BG, et al. Assessment of thyroid function during pregnancy: first-trimester (weeks 9-13) reference intervals derived from Western Australian women. Med J Aust. 2008;189(5):250–3. · DOI
- La'ulu SL, Roberts WL. Ethnic differences in first-trimester thyroid reference intervals. Clin Chem. 2011;57(6):913–5. · DOI
- Männistö T, Surcel HM, Ruokonen A, Vääräsmäki M, Pouta A, Bloigu A, et al. Early pregnancy reference intervals of thyroid hormone concentrations in a thyroid antibody-negative pregnant population. Thyroid. 2011;21(3):291–8. · DOI
- Vaidya B, Anthony S, Bilous M, Shields B, Drury J, Hutchison S, et al. Detection of thyroid dysfunction in early pregnancy: universal screening or targeted high-risk case finding? J Clin Endocrinol Metab. 2007;92(1):203–7. · DOI
- La'ulu SL, Roberts WL. Second-trimester reference intervals for thyroid tests: the role of ethnicity. Clin Chem. 2007;53(9):1658–64. · DOI
- Medici M, Korevaar TI, Visser WE, Visser TJ, Peeters RP. Thyroid function in pregnancy: what is normal? Clin Chem. 2015;61(5):704–13. · DOI
- Korevaar TI, Muetzel R, Medici M, Chaker L, Jaddoe VW, de Rijke YB, et al. Association of maternal thyroid function during early pregnancy with offspring IQ and brain morphology in childhood: a population-based prospective cohort study. Lancet Diabetes Endocrinol. 2016;4(1):35–43. · DOI
- Bulur O, Atak Z, Ertugrul DT, Beyan E, Gunakan E, Karakaya S, et al. Trimester-specific reference intervals of thyroid function tests in Turkish pregnants. Gynecol Endocrinol. 2020;36(5):413–6. · DOI
- Akarsu S, Akbiyik F, Karaismailoglu E, Dikmen ZG. Gestation specific reference intervals for thyroid function tests in pregnancy. Clin Chem Lab Med. 2016;54(8):1377–83. · DOI
- Medici M, de Rijke YB, Peeters RP, Visser W, de Muinck Keizer-Schrama SM, et al. Maternal early pregnancy and newborn thyroid hormone parameters: the generation R study. J Clin Endocrinol Metab. 2012;97(2):646–52. · DOI
- Springer D, Bartos V, Zima T. Reference intervals for thyroid markers in early pregnancy determined by 7 different analytical systems. Scand J Clin Lab Invest. 2014;74(2):95–101. · DOI
- Weeke J, Dybkjaer L, Granlie K, Eskjaer Jensen S, Kjaerulff E, Laurberg P, et al. A longitudinal study of serum TSH, and total and free iodothyronines during normal pregnancy. Acta Endocrinol. 1982;101(4):531–7. · DOI
- Panesar NS, Li CY, Rgers MS. Reference intervals for thyroid hormones in pregnant Chinese women. Ann Clin Biochem. 2001;38(4):329–32. · DOI
- Yan YQ, Dong ZL, Dong L, Wang FR, Yang XM, Jin XY, et al. Trimester- and method-specific reference intervals for thyroid tests in pregnant Chinese women: methodology, euthyroid definition and iodine status can influence the setting of reference intervals. Clin Endocrinol. 2011;74(2):262–9. · DOI
- Yuen LY, Chan MHM, Sahota DS, Lit LCW, Ho CS, Ma RCW, et al. Development of gestational age-specific thyroid function test reference intervals in four analytic platforms through multilevel modeling. Thyroid. 2020;30(4):598–608. · DOI
- Liu J, Yu X, Xia M, Cai H, Cheng G, Wu L, et al. Development of gestation-specific reference intervals for thyroid hormones in normal pregnant northeast Chinese women: what is the rational division of gestation stages for establishing reference intervals for pregnancy women? Clin Biochem. 2017;50(6):309–17. · DOI
- Gao X, Li Y, Li J, Liu A, Sun W, Teng W, et al. Gestational TSH and FT4 reference intervals in Chinese women: a systematic review and Meta-analysis. Front Endocrinol (Lausanne). 2018;9:432. · DOI
- Lazarus J, Brown RS, Daumerie C, Hubalewska-Dydejczyk A, Negro R, Vaidya B. European thyroid association guidelines for the management of subclinical hypothyroidism in pregnancy and in children. Eur Thyroid J. 2014;3(2):76–94. · DOI · Paper page
- Shi X, Han C, Li C, Mao J, Wang W, Xie X, et al. Optimal and safe upper limits of iodine intake for early pregnancy in iodine-sufficient regions: a cross-sectional study of 7190 pregnant women in China. J Clin Endocrinol Metab. 2015;100(4):1630–8. · DOI
Cited by
Manyeh, A. K., Odopey, C. T., Ackon, A. N. E., Gmayinaam, V. U., Dzissem, P., Acquah, E., & Immurana, M. (2026) · doi:10.64898/2026.01.13.26344071
Metadata
- Authors
- Turkal, R., Turan, C. A., Elbasan, O., Aytan, S., Çakmak, B., Gözaydınoğlu, B., Takır, D. C., Ünlü, O., Bahramzada, G., Tekin, A. F., Çevlik, T., Büyükbayrak, E. E., Şirikçi, Ö., Gözü, H., & Haklar, G.
- Venue
- BMC Pregnancy and Childbirth
- Published
- 2022-03-31
- Volume
- 22
- Issue
- 1
- ISSN
- 1471-2393
- PMC
- PMC8973886
- Cited by
- 23
- References
- 8
- Language
- en
About these checks
Registry, retraction, Cites and statistics results are computed, not judged, with one exception: a printed reference that no index lists is read once by a model before it counts as a citation error. Claims are extracted by a model and kept only when their quote appears verbatim in the text; each cited source is then checked, with a model’s help, for whether it says what the claim relies on. Those verdicts can be wrong — read the claim’s quote and the cited source before relying on one.
Statistics and arithmetic are recomputed, not judged.
Confidence bands are shown only for fields calibrated on our annotated test set. None is calibrated yet, so no band is shown.
What counts as a claim ›How we measure confidence ›How we check this ›
Are you an author, or do you see a problem with this page? Request a review
Data sources
Bibliographic data: Semantic Scholar, OpenAlex, Crossref.
Contains information from the Semantic Scholar Academic Graph Datasets, made available under the ODC Attribution License (ODC-BY 1.0).
Semantic Scholar’s data is described in: Kinney, R., et al. (2023). The Semantic Scholar Open Data Platform. arXiv:2301.10140.
