

The DOI matches its Crossref record; 87 of the 88 references it cites were found in a registry or an index.
A prospective longitudinal study on the microbiota composition in amyotrophic lateral sclerosis
Open accessAbstract
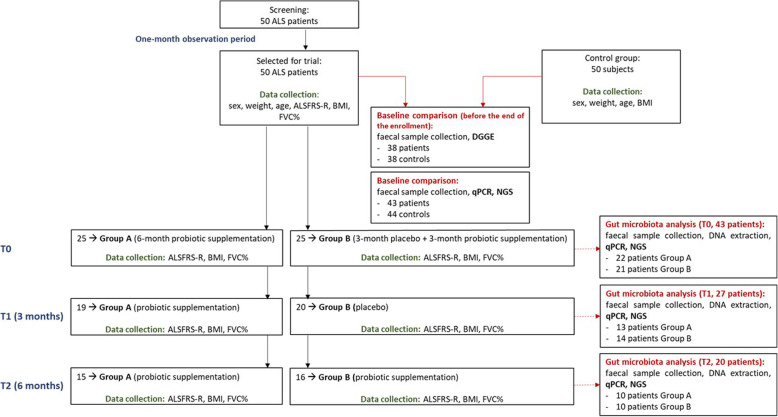
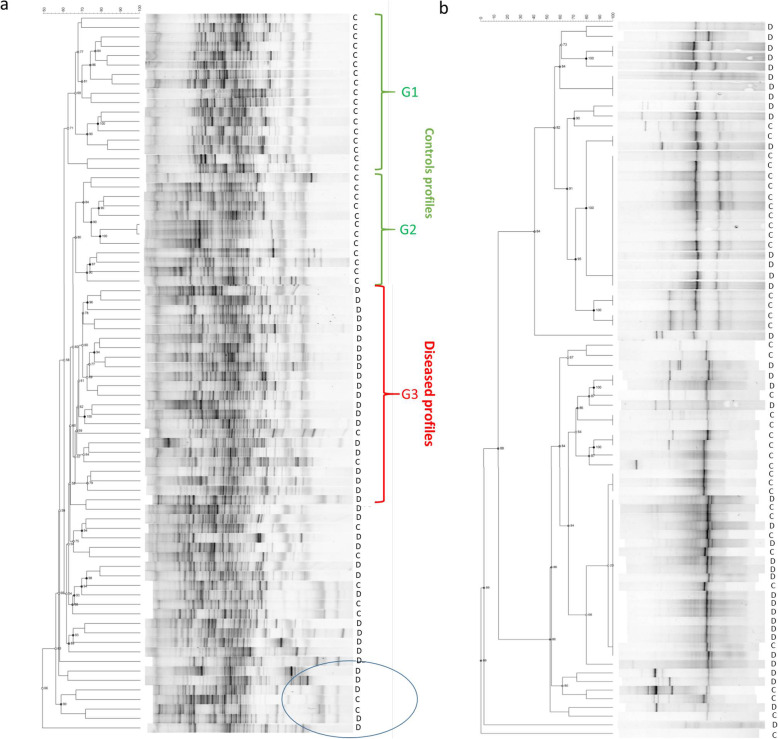
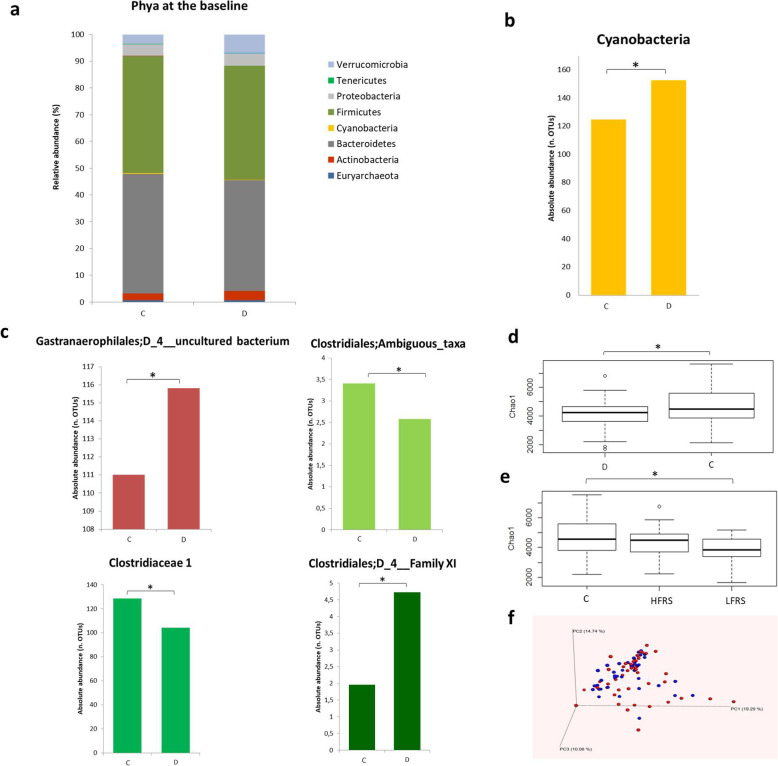
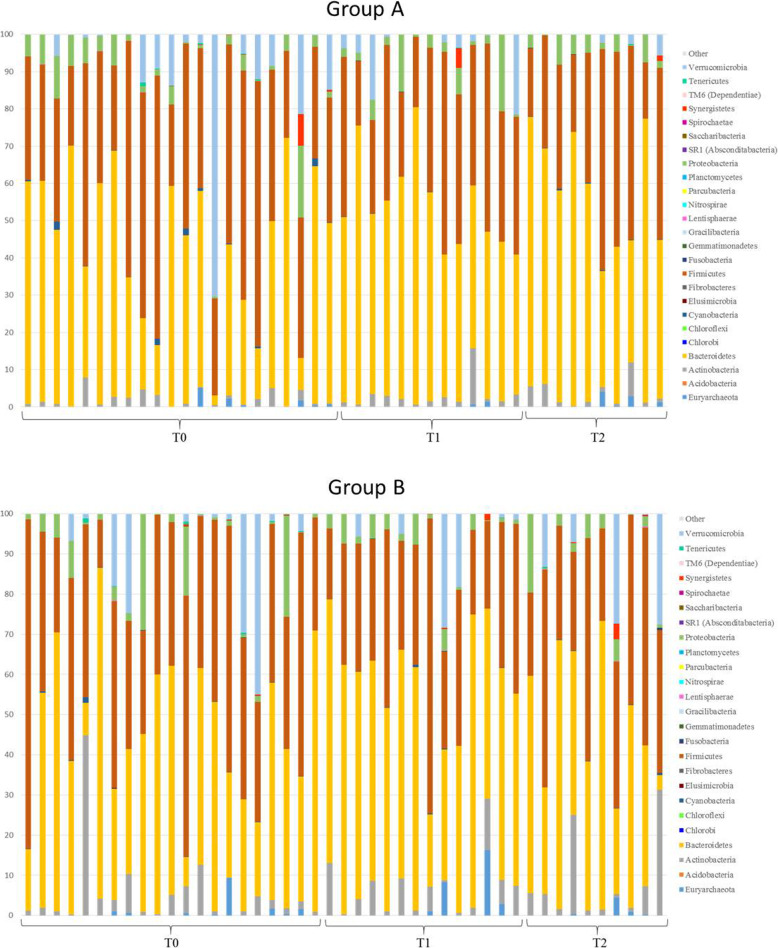
Background: A connection between amyotrophic lateral sclerosis (ALS) and altered gut microbiota composition has previously been reported in animal models. This work is the first prospective longitudinal study addressing the microbiota composition in ALS patients and the impact of a probiotic supplementation on the gut microbiota and disease progression. Methods: Fifty patients and 50 matched controls were enrolled. The microbial profile of stool samples from patients and controls was analyzed via PCR-Denaturing Gradient Gel Electrophoresis, and the main microbial groups quantified via qPCR. The whole microbiota was then analyzed via next generation sequencing after amplification of the V3–V4 region of 16S rDNA. Patients were then randomized to receive probiotic treatment or placebo and followed up for 6 months with ALSFRS-R, BMI, and FVC%. Results: The results demonstrate that the gut microbiota of ALS patients is characterized by some differences with respect to controls, regardless of the disability degree. Moreover, the gut microbiota composition changes during the course of the disease as demonstrated by the significant decrease in the number of observed operational taxonomic unit during the follow-up. Interestingly, an unbalance between potentially protective microbial groups, such as Bacteroidetes, and other with potential neurotoxic or pro-inflammatory activity, such as Cyanobacteria, has been shown. The 6-month probiotic treatment influenced the gut microbial composition; however, it did not bring the biodiversity of intestinal microbiota of patients closer to that of control subjects and no influence on the progression of the disease measured by ALSFRS-R was demonstrated. Conclusions: Our study poses the bases for larger clinical studies to characterize the microbiota changes as a novel ALS biomarker and to test new microbial strategy to ameliorate the health status of the gut. Trial registration: CE 107/14, approved by the Ethics Committee of the “Maggiore della Carità” University Hospital, Italy.
Overview
The claims and statistics of this paper haven’t been checked yet.
Run the check — free, no account needed. It reads the open-access text and checks the sources it cites.
Integrity signals
Registry
Cites
Statistics
Figures
Verification
Claims the paper makes
The claims and statistics of this paper haven’t been checked yet.
Run the check — free, no account needed. It reads the open-access text and checks the sources it cites.
Claims other papers make about this one
Each is checked against this paper’s own text: does it say what the citing paper says it does?
In the citing paper
“Similarly, in a prospective longitudinal study of patients with ALS, Di Gioia et al. (102) found that intestinal flora was restored by probiotic supplementation compared to normal controls.”
From Modulation of the gut–brain axis via the gut microbiota: a new era in treatment of amyotrophic lateral sclerosis (2023) · cites this paper as [102]
Self-check
Percentages, sums and reported differences re-computed from the paper’s own numbers.
The self-check needs the paper’s full text.
Citations
Cites
QIIME allows analysis of high-throughput community sequencing data
Caporaso, J. G., Kuczynski, J., Stombaugh, J., Bittinger, K., Bushman, F. D., Costello, E. K., Fierer, N., Peña, A. G., Goodrich, J. K., Gordon, J. I., et al. (2010) · Nature Methods · doi:10.1038/nmeth.f.303 · Cited by 34,887
The SILVA ribosomal RNA gene database project: improved data processing and web-based tools
Quast, C., Pruesse, E., Yilmaz, P., Gerken, J., Schweer, T., Yarza, P., Peplies, J., & Glöckner, F. O. (2012) · Nucleic Acids Research · doi:10.1093/nar/gks1219 · Cited by 33,055
Search and clustering orders of magnitude faster than BLAST
Edgar, R. C. (2010) · Bioinformatics · doi:10.1093/bioinformatics/btq461 · Cited by 21,098
FLASH: fast length adjustment of short reads to improve genome assemblies
Magoč, T., & Salzberg, S. L. (2011) · Bioinformatics · doi:10.1093/bioinformatics/btr507 · Cited by 15,366
A human gut microbial gene catalogue established by metagenomic sequencing
MetaHIT Consortium, Qin, J., Li, R., Raes, J., Arumugam, M., Burgdorf, K. S., Manichanh, C., Nielsen, T., Pons, N., Levenez, F., et al. (2010) · Nature · doi:10.1038/nature08821 · Cited by 11,624
Mind-altering microorganisms: the impact of the gut microbiota on brain and behaviour
Cryan, J. F., & Dinan, T. G. (2012) · Nature Reviews Neuroscience · doi:10.1038/nrn3346 · Cited by 4,572
Induction of Colonic Regulatory T Cells by Indigenous Clostridium Species
Atarashi, K., Tanoue, T., Shima, T., Imaoka, A., Kuwahara, T., Momose, Y., Cheng, G., Yamasaki, S., Saito, T., Ohba, Y., et al. (2011) · Science · doi:10.1126/science.1198469 · Cited by 3,752
Chimeric 16S rRNA sequence formation and detection in Sanger and 454-pyrosequenced PCR ampliconsPreprint
Haas, B. J., Gevers, D., Earl, A. M., Feldgarden, M., Ward, D. V., Giannoukos, G., Ciulla, D., Tabbaa, D., Highlander, S. K., Sodergren, E. J., et al. (2011) · Genome Research · doi:10.1101/gr.112730.110 · Cited by 3,527
PyNAST: a flexible tool for aligning sequences to a template alignment
Caporaso, J. G., Bittinger, K. L., Bushman, F. D., DeSantis, T. Z., Andersen, G. L., & Knight, R. D. (2009) · Bioinformatics · doi:10.1093/bioinformatics/btp636 · Cited by 3,449
Formation of propionate and butyrate by the human colonic microbiota
Louis, P., & Flint, H. J. (2017) · Environmental Microbiology · doi:10.1111/1462-2920.13589 · Cited by 3,028
Cited by
Sorted by citations
Items 101–150 of 150
Sharpton, S. R., Podlaha, O., Chuang, J.-C., Gindin, Y., Myers, R. P., & Loomba, R. S. (2022) · Therapeutic Advances in Gastroenterology · doi:10.1177/17562848221098243 · Cited by 5
Influence of the Microbiota Through the Gut-Brain Axis in Neurological Diseases
Guarnotta, V., Mandarino, F. V., Fasulo, E., Maida, M. F., Laterza, L., Sferrazza, S., Raimondo, D., & Sinagra, E. (2024) · Integrated science · doi:10.1007/978-3-031-73061-0_20 · Cited by 3
Yang, E. J. (2025) · International Journal of Molecular Sciences · doi:10.3390/ijms26178419 · Cited by 5
Gut microbiota and ALS: cause, consequence or correlation? - a systematic review
Chakraborty, D. K., Roy, T., Ngo, S. T., Al‐Chalabi, A., & Khleifat, A. A. (2026) · Frontiers in Neuroscience · doi:10.3389/fnins.2026.1774417 · Cited by 3
Impaired communication at the neuromotor axis during Degenerative Cervical Myelopathy
Ojeda, J., Vergara, M., Ávila, A., Henríquez, J. P., Fehlings, M. G., & Vidal, P. M. (2024) · Frontiers in Cellular Neuroscience · doi:10.3389/fncel.2023.1316432 · Cited by 3
Guo, Y., Feng, H., Du, L., Gao, Y., & Yu, Z. H. (2025) · Current Microbiology · doi:10.1007/s00284-025-04638-8 · Cited by 2
A new paradigm of bidirectional regulation of the gut–spinal cord axis
Ni, S., Chen, K., Wang, H., Chen, S., Qiu, Y., Wang, T., Mo, F., Wang, S., Li, B., Bai, Y., et al. (2025) · Neural Regeneration Research · doi:10.4103/nrr.nrr-d-25-01016 · Cited by 2
Eissazade, N., Nazemi, L., Ashtiani, B. H., & Moradi-Lakeh, M. (2026) · Brain Communications · doi:10.1093/braincomms/fcag132 · Cited by 2
Contribution of neuroinflammation, resolution, and neuroprotection in neuropsychiatric diseases
Farooqui, A. A. (2021) · Elsevier eBooks · doi:10.1016/b978-0-323-88460-0.00002-3 · Cited by 2
Immunology and microbiome: Implications for motor systems
Mahjoub, Y., & Martino, D. (2023) · Handbook of clinical neurology · doi:10.1016/b978-0-323-98818-6.00001-7 · Cited by 2
A Mendelian Randomization Study: Roles of Gut Microbiota in Sepsis – Who is the Angle?
Bian, Y., Xu, J., Deng, X., & Zhou, S. (2024) · Polish Journal of Microbiology · doi:10.33073/pjm-2024-006 · Cited by 2
Pribac, M., Moțățăianu, A., Andone, S. R., Mardale, E., & Nemeth, S. (2024) · Current Issues in Molecular Biology · doi:10.3390/cimb46050271 · Cited by 3
Zhang, J., He, J., Liao, Y., Xia, X., & Yang, F. (2024) · Gene · doi:10.1016/j.gene.2024.148573 · Cited by 2
The Role of Gut Microbiota-derived Short Chain Fatty Acids in Amyotrophic Lateral Sclerosis
Saadh, M. J., Dhiaa, S. M., Bansal, P., Dabis, H. K., Katyal, A., Saraswat, V., Ibrahim, A. A., Kadem, R. U., & Ubaid, M. (2025) · Current Behavioral Neuroscience Reports · doi:10.1007/s40473-024-00292-9 · Cited by 2
Contribution of neuroinflammation, resolution, and neuroprotection in neurodegenerative diseases
Farooqui, A. A. (2021) · Elsevier eBooks · doi:10.1016/b978-0-323-88460-0.00010-2 · Cited by 2
Large-Scale Meta-Longitudinal Microbiome Data with a Known Batch Factor
Oh, S., & Li, R. W. (2022) · Genes · doi:10.3390/genes13030392 · Cited by 2
Neurodegenerative Diseases and the Gut Microbiota
Cabré, S., O’Riordan, K. J., & Cryan, J. F. (2022) · Progress in inflammation research · doi:10.1007/978-3-030-91051-8_11 · Cited by 2
Nutraceutical interventions for neuroprotection: a comprehensive review
Ghosh, N., Ghosh, J., Ghosh, S., Sinha, K., & Sil, P. C. (2025) · Biochemical Pharmacology · doi:10.1016/j.bcp.2025.117637 · Cited by 2
The Gut Microbiome in Amyotrophic Lateral Sclerosis: Emerging Mechanisms and Therapeutic Potential
Oriquat, G. A., Malathi, H., Maharana, L., Dhyani, A., Al-Hasnaawei, S., Singh‐Chauhan, A., Arora, V., Sharma, J., & Sadeghi-Samarjan, R. (2026) · Molecular Neurobiology · doi:10.1007/s12035-026-05826-8 · Cited by 1
Microbiota as a regulator of brain vulnerability across lifespan and disease contexts
Santerre, M., Shcherbik, N., & Sawaya, B. E. (2026) · Journal of Neuroinflammation · doi:10.1186/s12974-026-03824-0 · Cited by 1
Ma, X., Jiang, Z., Yang, T., Zhang, H., Lu, W., Liu, K., Fan, X., Yang, G., & Wu, S. (2026) · Microbiology Spectrum · doi:10.1128/spectrum.00609-26 · Cited by 1
Using gut neuron health as a predictive indicator of neurodegenerative disease
Langerová, T., & Gregory, J. M. (2026) · Future Neurology · doi:10.1080/14796708.2026.2684938 · Cited by 1
Cionci, N. B., Reggio, M., Baffoni, L., & Gioia, D. D. (2023) · Advances in predictive, preventive and personalised medicine · doi:10.1007/978-3-031-19564-8_8 · Cited by 1
Self-citationUpdate Review of the Relationship Between Gut Microbiota and Neurodegenerative Diseases
Wang, Y., Jing, G., Fu, Y., Li, Y., & Wu, C. (2024) · Diseases & Research · doi:10.54457/dr.202401007 · Cited by 1
Interplay Between Gut-microbiota and Neurodegeneration
Ashique, S., Pal, R., Kumar, S., Verma, B., Kumar, N., Kahwa, I., Farid, A., Mishra, N., Kumar, P., & Taghizadeh‐Hesary, F. (2024) · BENTHAM SCIENCE PUBLISHERS eBooks · doi:10.2174/9789815238754124010009 · Cited by 1
Food, Dietary Supplements and Nutraceuticals in Aging and Neurodegenerative Diseases
Marchi, F. D., & Tondo, G. (2023) · CNS & Neurological Disorders - Drug Targets · doi:10.2174/187152732305231202011902 · Cited by 1
Curli-producing E. coli enhances the disease phenotype in an hSOD1 G93A mouse model of ALSPreprint
Kurlawala, Z. (2021) · Research Square · doi:10.21203/rs.3.rs-506373/v1
Yu, J., Ning, J., Huang, S., Chen, S.-D., Yang, Y., & Dong, Q. (2021) · Research Square · doi:10.21203/rs.3.rs-885681/v1
Aragonés, Á. M., Martínez‐Manzanares, E., & Tapia-Paniagua, S. T. (2022) · Revista Española de Medicina Legal · doi:10.1016/j.reml.2021.09.004
Intestinal Microbiota and Sclerosis Lateral Amyotrophic
Vilar, M. D. D. C., Vale, S. H. D. L., Rosado, E. L., Júnior, M. E. T. D., Brandão‐Neto, J., & Leite-Lais, L. (2022) · REVISTA CIÊNCIAS EM SAÚDE · doi:10.21876/rcshci.v12i1.1223
Vilanova, J. D. C., de Melo, B. R., da Rocha, T. H. L., da Rocha, I. L., Guerra, B. M. M. D., Garcês, T. C. D. C. S., & de Andrade, A. R. O. (2023) · Research Society and Development · doi:10.33448/rsd-v12i5.41454
Yanık, H. D., Akçelik, N., Has, E. G., & Akçelik, M. (2023) · Research Square · doi:10.21203/rs.3.rs-3032986/v1
"The Relevance of the Microbiota in the Treatment of Amyotrophic Lateral Sclerosis"
Ferreira, S. B. (2023) · Biomedical Journal of Scientific & Technical Research · doi:10.26717/bjstr.2023.49.007790
Wang, L., Zhang, Y., Qi, B., Liu, H., Wang, S., Luo, S., Chen, Z., Zhang, M., & Yu, K. (2023) · SSRN Electronic Journal · doi:10.2139/ssrn.4524772
The Scenario of Emerging Gut Microbiome Cross Talks in Brain Aging
Panneerselvam, S., Jayaraman, S., & Rajagopal, P. (2024) · Springer eBooks · doi:10.1007/978-981-99-8803-7_2
The Effect of Probiotics and Microbiota on Nervous System and Mental Illnesses
Hossainpour, H., Khazaei, S., & Mahmoudi, H. (2024) · Central Nervous System Agents in Medicinal Chemistry · doi:10.2174/0118715249315760240905043415
Yanık, H. D., Akçelik, N., Has, E. G., & Akçelik, M. (2024) · Journal of Medical Microbiology · doi:10.1099/jmm.0.001893
Multifactorial microbial networks shape aging and neurodegeneration
Kara, N. Z., Savaliya, J. H., & Blacher, E. (2024) · Elsevier eBooks · doi:10.1016/b978-0-443-18979-1.00002-2
Role of microbiome gut-brain axis in brain disorders
Parashar, S., Kapoor, D. U., Gautam, R. K., & Thakur, A. K. (2025) · Elsevier eBooks · doi:10.1016/b978-0-443-21680-0.00013-4
Lima, R. S., Santos, R. S., Chaves‐Filho, A. B., Trzan, I. F. L., Inague, A., de Faria, R. L., Dantas, L. S., Pinto, I. F. D., de Medeiros, M. H. G., Steiner, A. A., et al. (2025) · bioRxiv (Cold Spring Harbor Laboratory) · doi:10.1101/2025.05.05.650333
Wang, W., Liu, M., Wang, Z., Ma, L., Zhao, Y., Ye, W., & Li, X. (2025) · BMC Neurology · doi:10.1186/s12883-025-04187-4
Attenuating Neurotoxicity Through Fecal Microbiota Transplant: Mechanisms and Therapeutic Potential
Younis, N. K., Alfarttoosi, K. H., Sanghvi, G. V., Roopashree, R., Kashyap, A., Krithiga, T., Taher, W. M., Alwan, M., Jawad, M. J., & Al-Nuaimi, A. M. A. (2025) · Molecular Neurobiology · doi:10.1007/s12035-025-05415-1
Research progress on the role of gut microbiota in skeletal muscle atrophy
Wen-Ya, G. U. O., XIANG, S.-J., ZHANG, X.-L., Yao, L., & Li, Y. (2026) · Shengming kexue · doi:10.3724/cbls.2026011
Yang, E. J. (2026) · Frontiers in Bioscience-Landmark · doi:10.31083/fbl52497
Gut microbiota and brain health: Disease-specific pathways and emerging therapeutic strategies
Oriquat, G., Rizaev, J., Abdulqader, A. F., Kadhim, A. A., Jamuna, K. V., Singhal, D. K., Bainsal, N., & Mansurova, N. (2026) · Multiple Sclerosis and Related Disorders · doi:10.1016/j.msard.2026.107407
Dresel, F. C., Michaelis, M., & Gourlay, C. W. (2026) · International Journal of Cell Biology · doi:10.1155/ijcb/3022967
Microbiota-derived metabolite-GPCR signalling in neurodegeneration
Sharma, A., & Jatana, N. (2026) · Neuroscience · doi:10.1016/j.neuroscience.2026.09.001
Huang, C.-C. S., Sanchez-Santos, C., Martínez-González, L., Gil, C., & Martı́nez, A. (2026) · Expert Opinion on Investigational Drugs · doi:10.1080/13543784.2026.2729512
Microbiome and Diseases: Gut–Brain Axis and Neurological Disorders
de Castilhos, J., & Stein‐Thoeringer, C. K. (2026) · Springer eBooks · doi:10.1007/978-3-032-26410-7_18
The Microbiota-Gut-Brain Axis in Neurological and Neuropsychiatric Disorders: A Literature Review
Brar, H., Do, N., Kelser, C., Pattipati, S. N., & Nalamolu, K. R. (2026) · Cureus · doi:10.7759/cureus.118684
Metadata
- Authors
- Di Gioia, D., Bozzi Cionci, N., Baffoni, L., Amoruso, A., Pane, M., Mogna, L., Gaggìa, F., Lucenti, M. A., Bersano, E., Cantello, R., De Marchi, F., & Mazzini, L.
- Affiliations
- University of Bologna (IT)
- Università degli Studi del Piemonte Orientale “Amedeo Avogadro” (IT)
- Corresponding author
- Mazzini, Letizia
- ORCID
- Venue
- BMC Medicine
- Published
- 2020-06-17
- Volume
- 18
- Issue
- 1
- Pages
- 153-153
- ISSN
- 1741-7015 (ISSN-L)
- PMC
- PMC7298784
- OpenAlex
- W3035761210
- Cited by
- 151
- References
- 88
- Citations by year
- 2026: 16 · 2025: 24 · 2024: 34 · 2023: 27 · 2022: 24 · 2021: 21 · 2020: 5
- FWCI
- 6.24
- Type
- journal article
- Language
- en
- Open access
- gold
- doi.org
- Locations
- BMC Medicine (publishedVersion, cc-by)
- PubMed Central (publishedVersion, cc-by)
- PubMed (publishedVersion)
- Archivio istituzionale della ricerca (Alma Mater Studiorum Università di Bologna) (submittedVersion, cc-by)
- DOAJ (DOAJ: Directory of Open Access Journals) (submittedVersion, cc-by-sa)
- Funders
- Probiotical S.p.A. (--)
- Università degli Studi del Piemonte Orientale (AGING Project for Department of Excellence at the Department of Translational Medicine (DIMET), Università del Piemonte Orientale, Novara, Italy)
- Topics
- Life Sciences › Biochemistry, Genetics and Molecular Biology › Molecular Biology › Gut microbiota and health
- Health Sciences › Medicine › Clinical Neurology › Amyotrophic Lateral Sclerosis Research
- Life Sciences › Agricultural and Biological Sciences › Food Science › Probiotics and Fermented Foods
- Keywords
- amyotrophic lateral sclerosis, gut microbiota, probiotic supplementation, disease progression, Bacteroidetes, cyanobacteria, microbial diversity, ALS biomarkers, 16S rRNA gene sequencing, stool microbiome
- MeSH terms
- Gastrointestinal Microbiome, Adolescent, Adult, Aged, Amyotrophic Lateral Sclerosis, Animals, Female, Humans, Longitudinal Studies, Male, Middle Aged, Prospective Studies, Young Adult
About these checks
Registry, retraction, Cites and statistics results are computed, not judged, with one exception: a printed reference that no index lists is read once by a model before it counts as a citation error. Claims are extracted by a model and kept only when their quote appears verbatim in the text; each cited source is then checked, with a model’s help, for whether it says what the claim relies on. Those verdicts can be wrong — read the claim’s quote and the cited source before relying on one.
Statistics and arithmetic are recomputed, not judged.
Confidence bands are shown only for fields calibrated on our annotated test set. None is calibrated yet, so no band is shown.
What counts as a claim ›How we measure confidence ›How we check this ›
Are you an author, or do you see a problem with this page? Request a review
