

The DOI matches its Crossref record; 3 of the 3 references it cites were found in a registry or an index.
Identification of lipidomic profiles associated with drug-resistant prostate cancer cells
Published version of a preprint
Abstract
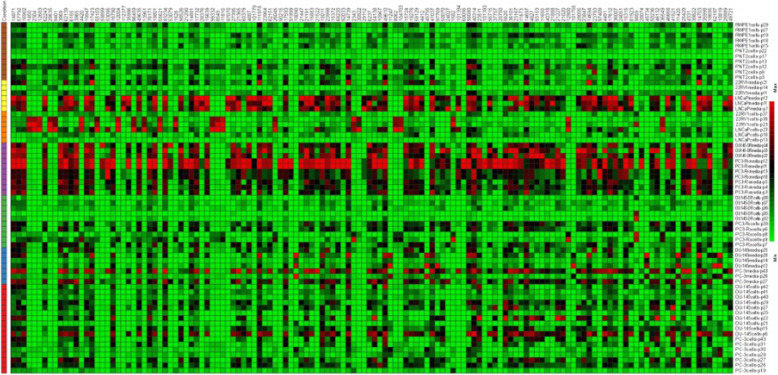
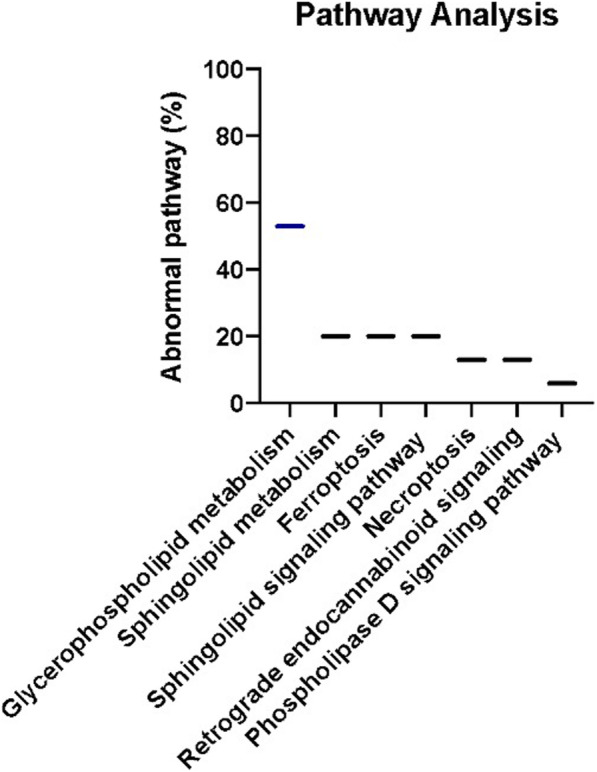
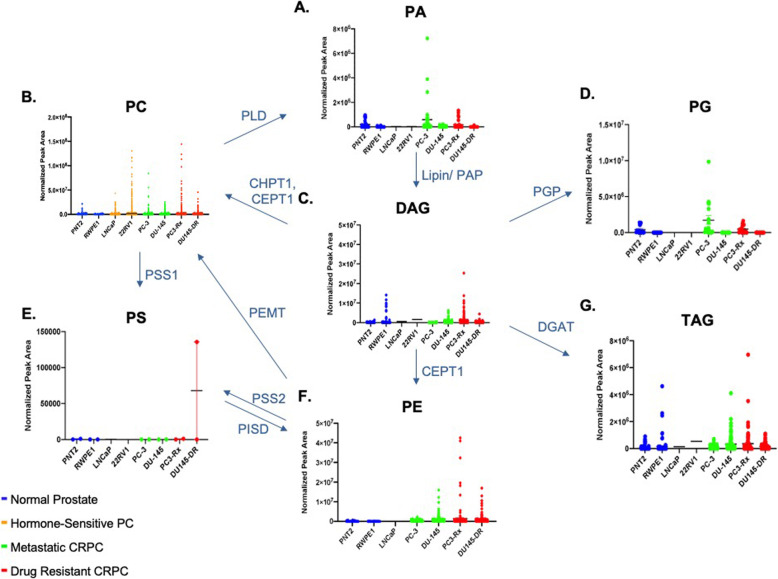
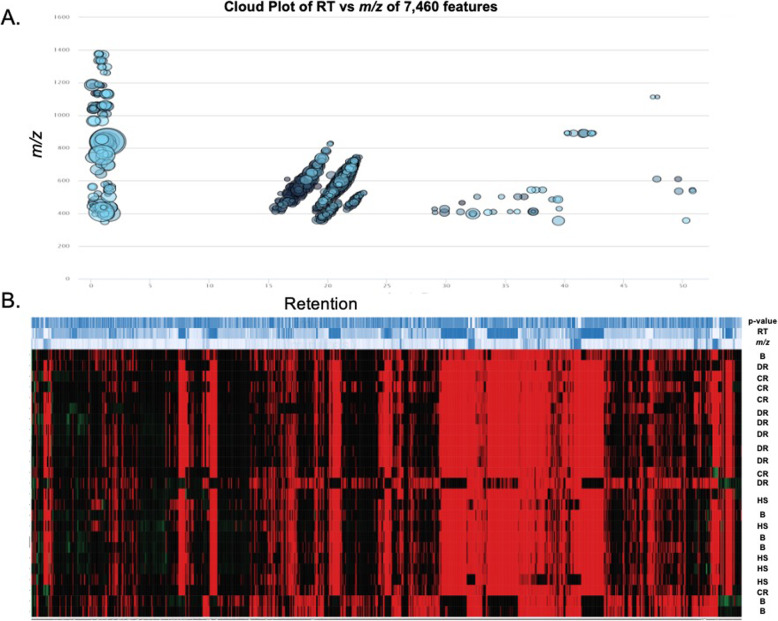
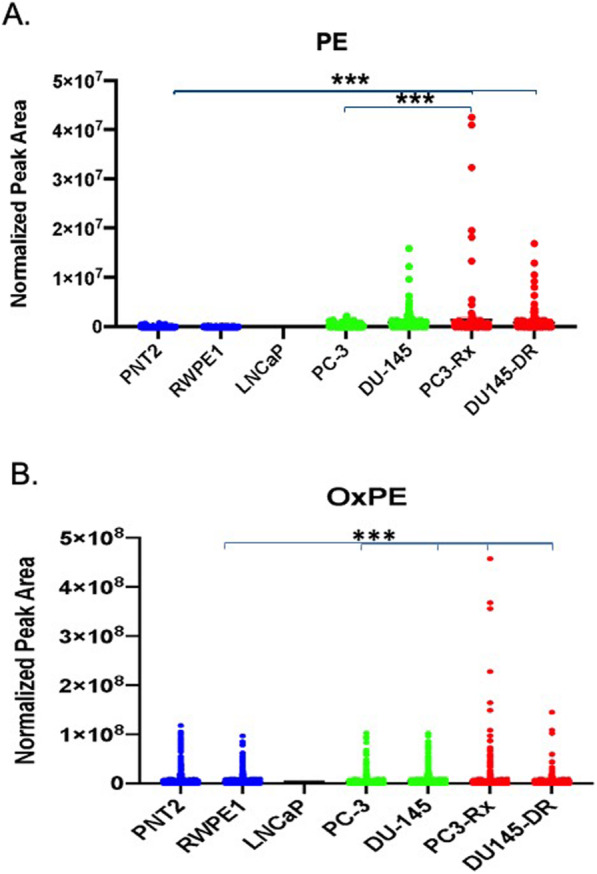
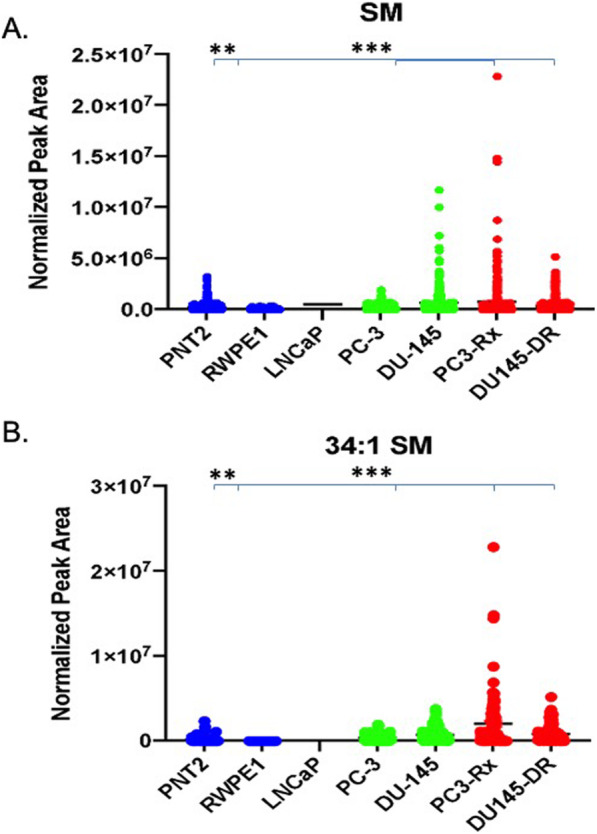
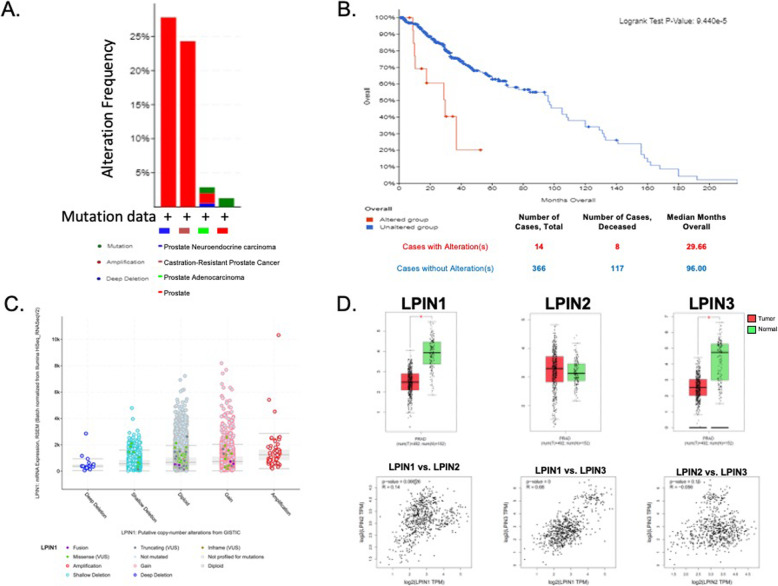
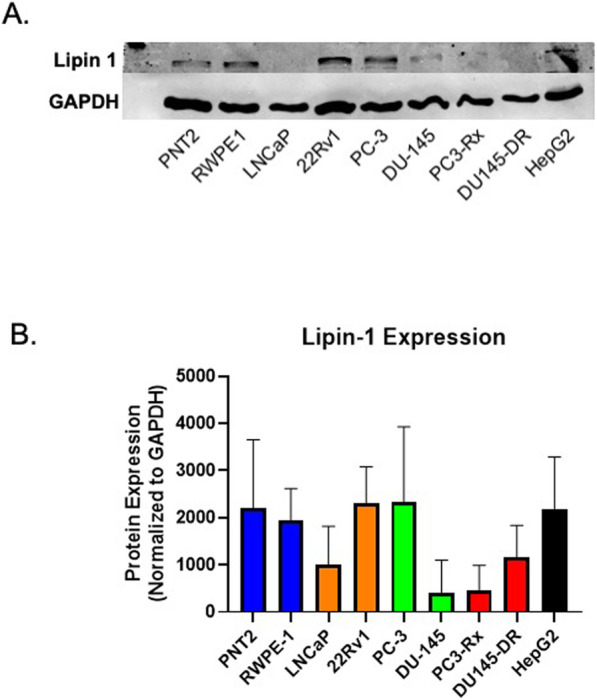
Background: The association of circulating lipids with clinical outcomes of drug-resistant castration-resistant prostate cancer (DR-CRPC) is not fully understood. While it is known that increases in select lipids correlate to decreased survival, neither the mechanisms mediating these alterations nor the correlation of resistance to drug treatments is well characterized. Methods: This gap-in-knowledge was addressed using in vitro models of non-cancerous, hormone-sensitive, CRPC and drug-resistant cell lines combined with quantitative LC-ESI-Orbitrap-MS (LC-ESI-MS/MS) lipidomic analysis and subsequent analysis such as Metaboanalyst and Lipid Pathway Enrichment Analysis (LIPEA). Results: Several lipid regulatory pathways were identified that are associated with Docetaxel resistance in prostate cancer (PCa). These included those controlling glycerophospholipid metabolism, sphingolipid signaling and ferroptosis. In total, 7460 features were identified as being dysregulated between the cell lines studied, and 21 lipid species were significantly altered in drug-resistant cell lines as compared to nonresistant cell lines. Docetaxel resistance cells (PC3-Rx and DU145-DR) had higher levels of phosphatidylcholine (PC), oxidized lipid species, phosphatidylethanolamine (PE), and sphingomyelin (SM) as compared to parent control cells (PC-3 and DU-145). Alterations were also identified in the levels of phosphatidic acid (PA) and diacylglyceride (DAG), whose levels are regulated by Lipin (LPIN), a phosphatidic acid phosphatase that converts PA to DAG. Data derived from cBioPortal demonstrated a population of PCa patients expressing mutations aligning with amplification of LPIN1, LPIN2 and LPIN3 genes. Lipin amplification in these genes correlated to decreased survival in these patients. Lipin-1 mRNA expression also showed a similar trend in PCa patient data. Lipin-1, but not Lipin-2 or − 3, was detected in several prostate cancer cells, and was increased in 22RV1 and PC-3 cell lines. The increased expression of Lipin-1 in these cells correlated with the level of PA. Conclusion: These data identify lipids whose levels may correlate to Docetaxel sensitivity and progression of PCa. The data also suggest a correlation between the expression of Lipin-1 in cells and patients with regards to prostate cancer cell aggressiveness and patient survivability. Ultimately, these data may be useful for identifying markers of lethal and/or metastatic prostate cancer.
Overview
The claims and statistics of this paper haven’t been checked yet.
Run the check — free, no account needed. It reads the open-access text and checks the sources it cites.
Integrity signals
Registry
Cites
Statistics
Figures
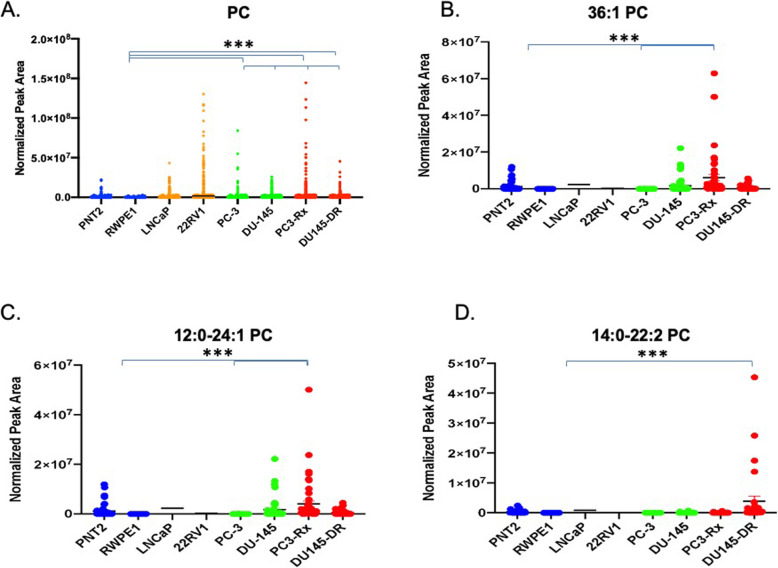
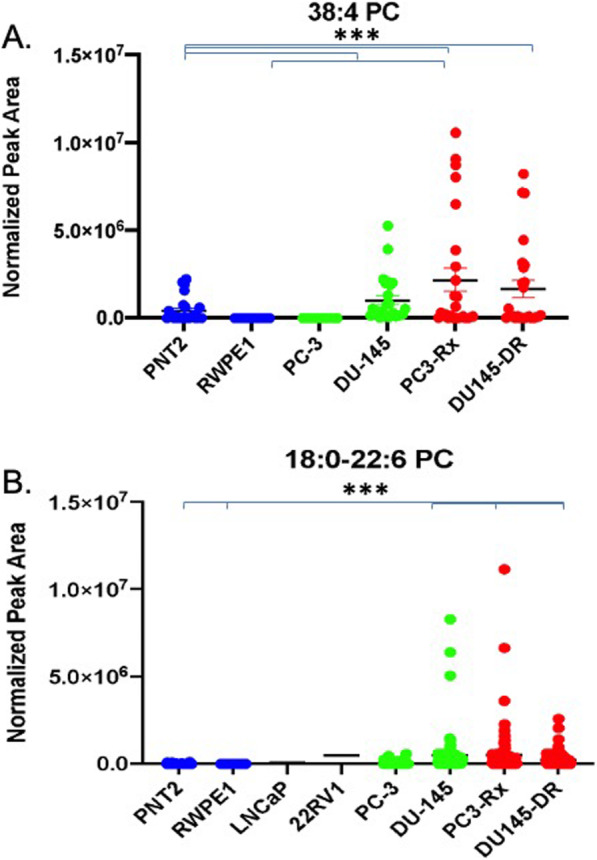
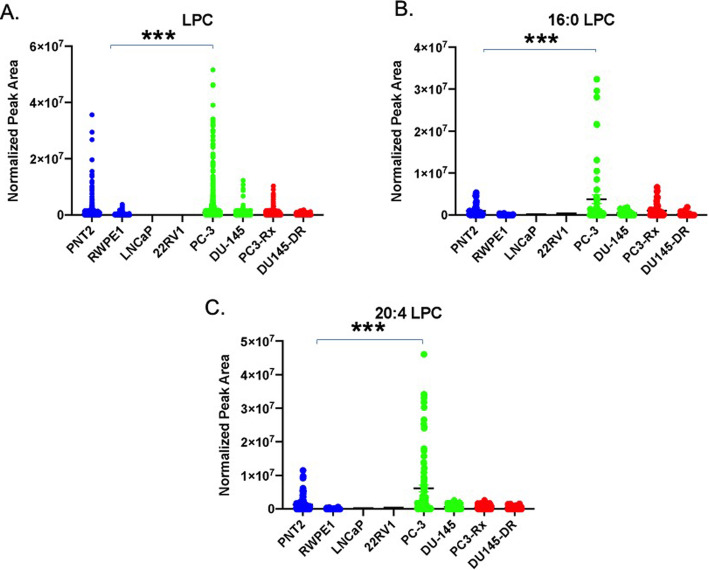
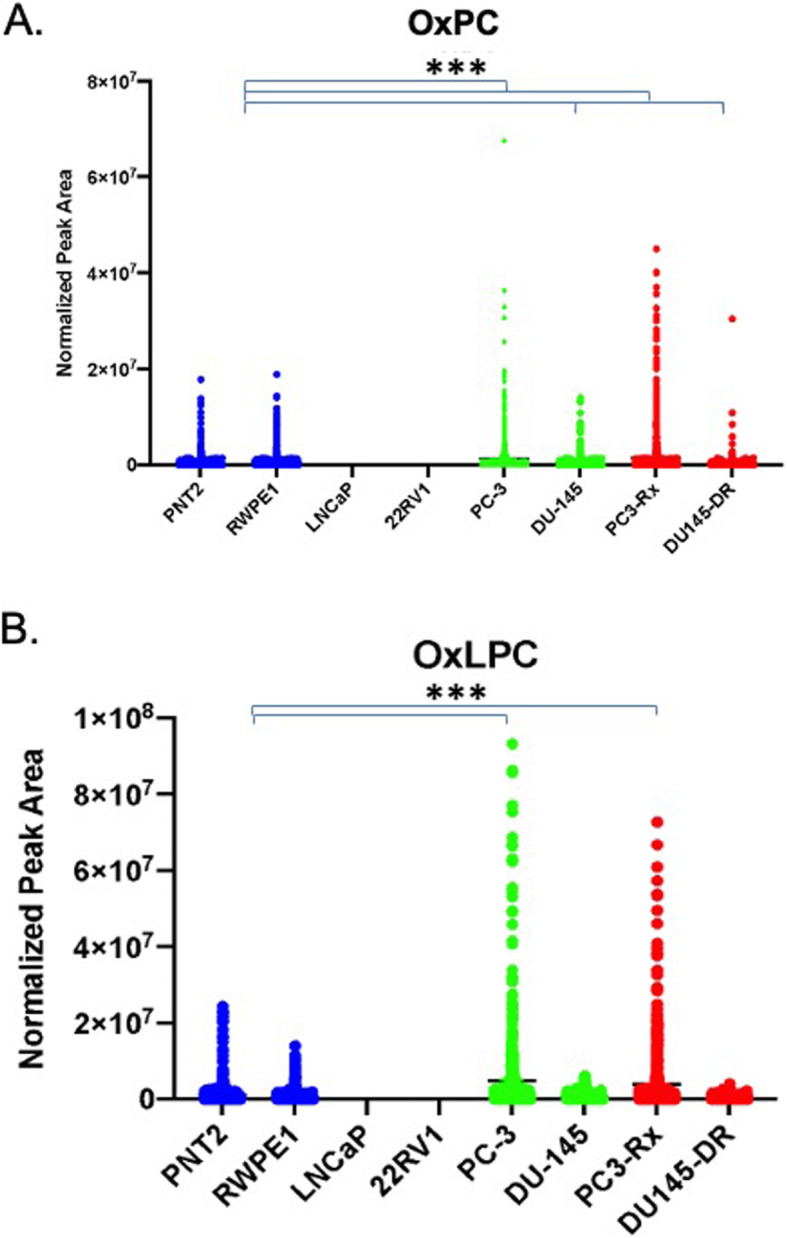
Verification
Claims the paper makes
The claims and statistics of this paper haven’t been checked yet.
Run the check — free, no account needed. It reads the open-access text and checks the sources it cites.
Claims other papers make about this one
Each is checked against this paper’s own text: does it say what the citing paper says it does?
The source backs part of the claim, not all of it — or backs it for a different population, condition or comparison.
In the citing paper
“Furthermore, changes in lipid metabolism have clinical significance in prostate cancer and are highly implicated in its pathogenesis, metastatic potential, and resistance to treatment (40, 41).”
From FACS-assisted single-cell lipidome analysis of phosphatidylcholines and sphingomyelins in cells of different lineages (2023) · cites this paper as [40]
Experimental — accuracy not yet measuredThe cited source says what the claim attributes to it.
In the citing paper
“The relative abundance of PC species detected within PC3, LNCaP, and DU145 prostate cancer cells lines in the present study aligns well with that previously reported (38, 39, 40); however, we could find no publicly available datasets describing the lipidome of PNT1 prostate epithelial cells.”
From FACS-assisted single-cell lipidome analysis of phosphatidylcholines and sphingomyelins in cells of different lineages (2023) · cites this paper as [40]
The cited source says what the claim attributes to it.
In the citing paper
“it is widely reported that PC composition varies between different immortalized prostate cancer cell lines (38, 39, 40).”
From FACS-assisted single-cell lipidome analysis of phosphatidylcholines and sphingomyelins in cells of different lineages (2023) · cites this paper as [40]
In the citing paper
“Acquired docetaxel resistance in prostate cancer cells can also increase overall PC and SM levels as well as the levels of some specific PC species (40).”
From FACS-assisted single-cell lipidome analysis of phosphatidylcholines and sphingomyelins in cells of different lineages (2023) · cites this paper as [40]
In the citing paper
“Firstly, we know that prostate cancer cell lines differ in the abundance of discrete PC species present (38, 39, 40).”
From FACS-assisted single-cell lipidome analysis of phosphatidylcholines and sphingomyelins in cells of different lineages (2023) · cites this paper as [40]
Self-check
Percentages, sums and reported differences re-computed from the paper’s own numbers.
The self-check needs the paper’s full text.
Citations
Cites
A RAPID METHOD OF TOTAL LIPID EXTRACTION AND PURIFICATION
Bligh, E. G., & Dyer, W. J. (1959) · Canadian Journal of Biochemistry and Physiology · doi:10.1139/o59-099 · Cited by 54,751
Fundamentals of Cancer Metabolism
DeBerardinis, R. J., & Chandel, N. S. (2016) · Science Advances · doi:10.1126/sciadv.1600200 · Cited by 3,013
Guo, D., Reinitz, F., Youssef, M., Hong, C., Nathanson, D., Akhavan, D., Kuga, D., Amzajerdi, A. N., Soto, H., Zhu, S., et al. (2011) · Cancer Discovery · doi:10.1158/2159-8290.cd-11-0102 · Cited by 452
Research works printed but not linked: 62
- Chandrasekar T, et al. Mechanisms of resistance in castration-resistant prostate cancer (CRPC). Transl Androl Urol. 2015;4(3):365–80.
- George DJ, Kantoff PW, Lin DW. New and emerging treatments for advanced prostate cancer. Clin Adv Hematol Oncol. 2011;9(6 Suppl 12):1–15.
- Hultsch S, et al. Association of tamoxifen resistance and lipid reprogramming in breast cancer. BMC Cancer. 2018;18(1):850. · DOI
- Cheng C, et al. Glucose-mediated N-glycosylation of SCAP is essential for SREBP-1 activation and tumor growth. Cancer Cell. 2015;28(5):569–81. · DOI
- Guo, D., et al., EGFR signaling through an Akt-SREBP-1–dependent, rapamycin-resistant pathway sensitizes glioblastomas to antilipogenic therapy. Sci. Signal., 2009. 2(101): p. ra82-ra82. · DOI · Paper page
- Acevedo, A., et al., LIPEA: Lipid Pathway Enrichment Analysis. bioRxiv, 2018: p. 274969. · DOI
- Twum-Ampofo J, et al. Metabolic targets for potential prostate cancer therapeutics. Curr Opin Oncol. 2016;28(3):241–7. · DOI
- Ngo DC, et al. Introduction to the molecular basis of cancer metabolism and the Warburg effect. Mol Biol Rep. 2015;42(4):819–23. · DOI
- Medes G, Thomas A, Weinhouse S. Metabolism of neoplastic tissue. IV. A study of lipid synthesis in neoplastic tissue slices in vitro. Cancer Res. 1953;13(1):27–9.
- Ookhtens M, et al. Liver and adipose tissue contributions to newly formed fatty acids in an ascites tumor. Am J Phys. 1984;247(1 Pt 2):R146–53.
- Beloribi-Djefaflia S, Vasseur S, Guillaumond F. Lipid metabolic reprogramming in cancer cells. Oncogenesis. 2016;5(1):e189. · DOI
- DeBerardinis RJ, et al. The biology of Cancer: metabolic reprogramming fuels cell growth and proliferation. Cell Metab. 2008;7(1):11–20. · DOI · Paper page
- Bartlett GR. Phosphorus assay in column chromatography. J Biol Chem. 1959;234(3):466–8. · DOI
- Maes E, et al. Determination of variation parameters as a crucial step in designing TMT-based clinical proteomics experiments. PLoS One. 2015;10(3):e0120115. · DOI
- Kinsey GR, et al. Decreased iPLA2γ expression induces lipid peroxidation and cell death and sensitizes cells to oxidant-induced apoptosis. J Lipid Res. 2008;49(7):1477–87. · DOI
- Zhang L, Peterson BL, Cummings BS. The effect of inhibition of Ca2+−independent phospholipase A2 on chemotherapeutic-induced death and phospholipid profiles in renal cells. Biochem Pharmacol. 2005;70(11):1697–706. · DOI
- Peterson B, et al. Alterations in phospholipid and fatty acid lipid profiles in primary neocortical cells during oxidant-induced cell injury. Chem Biol Interact. 2008;174(3):163–76. · DOI
- Kalli A, et al. Evaluation and optimization of mass spectrometric settings during data-dependent acquisition mode: focus on LTQ-Orbitrap mass analyzers. J Proteome Res. 2013;12(7):3071–86. · DOI
- Pluskal T, et al. MZmine 2: modular framework for processing, visualizing, and analyzing mass spectrometry-based molecular profile data. BMC Bioinformatics. 2010;11:395. · DOI
- Tautenhahn R, et al. XCMS online: a web-based platform to process untargeted metabolomic data. Anal Chem. 2012;84(11):5035–9. · DOI
- Koelmel JP, et al. LipidMatch: an automated workflow for rule-based lipid identification using untargeted high-resolution tandem mass spectrometry data. BMC Bioinformatics. 2017;18(1):331. · DOI
- Koelmel JP, et al. Expanding Lipidome coverage using LC-MS/MS data-dependent acquisition with automated exclusion list generation. J Am Soc Mass Spectrom. 2017;28(5):908–17. · DOI · Paper page
- Chong J, et al. MetaboAnalyst 4.0: towards more transparent and integrative metabolomics analysis. Nucleic Acids Res. 2018;46(W1):W486–w494. · DOI
- Kinsey GR, et al. Decreased iPLA2gamma expression induces lipid peroxidation and cell death and sensitizes cells to oxidant-induced apoptosis. J Lipid Res. 2008;49(7):1477–87. · DOI
- Cerami E, et al. The cBio cancer genomics portal: an open platform for exploring multidimensional cancer genomics data. Cancer Discov. 2012;2(5):401–4. · DOI · Paper page
- Gao J, et al. Integrative analysis of complex cancer genomics and clinical profiles using the cBioPortal. Sci Signal. 2013;6(269):pl1. · DOI · Paper page
- Tang Z, et al. GEPIA2: an enhanced web server for large-scale expression profiling and interactive analysis. Nucleic Acids Res. 2019;47(W1):W556–60. · DOI
- Trygg J, Wold S. Orthogonal projections to latent structures (O-PLS). J Chemom. 2002;16(3):119–28. · DOI
- Trygg J, Holmes E, Lundstedt T. Chemometrics in metabonomics. J Proteome Res. 2007;6(2):469–79. · DOI
- Richman EL, et al. Choline intake and risk of lethal prostate cancer: incidence and survival. Am J Clin Nutr. 2012;96(4):855–63. · DOI · Paper page
- Fernandis AZ, Wenk MR. Membrane lipids as signaling molecules. Curr Opin Lipidol. 2007;18(2):121–8. · DOI
- Brzozowski JS, et al. Lipidomic profiling of extracellular vesicles derived from prostate and prostate cancer cell lines. Lipids Health Dis. 2018;17(1):211. · DOI
- Ponnusamy S, et al. Sphingolipids and cancer: ceramide and sphingosine-1-phosphate in the regulation of cell death and drug resistance. Future Oncol. 2010;6(10):1603–24. · DOI
- van Meer G, Voelker DR, Feigenson GW. Membrane lipids: where they are and how they behave. Nat Rev Mol Cell Biol. 2008;9(2):112–24. · DOI · Paper page
- Dixon SJ, et al. Ferroptosis: an iron-dependent form of nonapoptotic cell death. Cell. 2012;149(5):1060–72. · DOI · Paper page
- Latunde-Dada GO. Ferroptosis: role of lipid peroxidation, iron and ferritinophagy. Biochim Biophys Acta Gen Subj. 2017;1861(8):1893–900. · DOI · Paper page
- Agmon E, et al. Modeling the effects of lipid peroxidation during ferroptosis on membrane properties. Sci Rep. 2018;8(1):5155. · DOI
- Agmon E, Stockwell BR. Lipid homeostasis and regulated cell death. Curr Opin Chem Biol. 2017;39:83–9. · DOI
- Stockwell BR, et al. Ferroptosis: a regulated cell death Nexus linking metabolism, redox biology, and disease. Cell. 2017;171(2):273–85. · DOI · Paper page
- Lin HM, et al. A distinct plasma lipid signature associated with poor prognosis in castration-resistant prostate cancer. Int J Cancer. 2017;141(10):2112–20. · DOI
- Sorvina A, et al. Lipid profiles of prostate cancer cells. Oncotarget. 2018;9(85):35541–52. · DOI · Paper page
- Cheng JC, et al. Radiation-induced acid ceramidase confers prostate cancer resistance and tumor relapse. J Clin Invest. 2013;123(10):4344–58. · DOI
- Ogretmen B, Hannun YA. Biologically active sphingolipids in cancer pathogenesis and treatment. Nat Rev Cancer. 2004;4(8):604–16. · DOI
- Merchant TE, et al. Phospholipid profiles of human colon cancer using 31P magnetic resonance spectroscopy. Int J Color Dis. 1991;6(2):121–6. · DOI
- Perrotti F, et al. Advances in Lipidomics for Cancer biomarkers discovery. Int J Mol Sci. 2016;17(12):1992. · DOI
- Perry DK, Hannun YA. The role of ceramide in cell signaling. Biochim Biophys Acta. 1998;1436(1–2):233–43. · DOI
- Taha TA, Mullen TD, Obeid LM. A house divided: ceramide, sphingosine, and sphingosine-1-phosphate in programmed cell death. Biochim Biophys Acta. 2006;1758(12):2027–36. · DOI
- Wang X-Z, et al. Aberrant sphingolipid signaling is involved in the resistance of prostate Cancer cell lines to chemotherapy. Cancer Res. 1999;59(22):5842–8.
- Schneider G, et al. Bioactive lipids, LPC and LPA, are novel prometastatic factors and their tissue levels increase in response to radio/chemotherapy. Molecular cancer research : MCR. 2014;12(11):1560–73. · DOI
- Okita M, et al. Elevated levels and altered fatty acid composition of plasma lysophosphatidylcholine (lysoPC) in ovarian cancer patients. Int J Cancer. 1997;71(1):31–4. · DOI
- Zhou X, et al. Identification of plasma lipid biomarkers for prostate cancer by lipidomics and bioinformatics. PLoS One. 2012;7(11):e48889. · DOI
- Phuyal S, et al. The ether lipid precursor hexadecylglycerol stimulates the release and changes the composition of exosomes derived from PC-3 cells. J Biol Chem. 2015;290(7):4225–37. · DOI
- Lisec J, et al. Cancer cell lipid class homeostasis is altered under nutrient-deprivation but stable under hypoxia. BMC Cancer. 2019;19(1):501. · DOI
- Burch TC, et al. Comparative Metabolomic and Lipidomic analysis of phenotype stratified prostate cells. PLoS One. 2015;10(8):e0134206. · DOI
- Jung JH, et al. Phospholipids of tumor extracellular vesicles stratify gefitinib-resistant nonsmall cell lung cancer cells from gefitinib-sensitive cells. Proteomics. 2015;15(4):824–35. · DOI
- Bevers EM, Comfurius P, Zwaal RF. Regulatory mechanisms in maintenance and modulation of transmembrane lipid asymmetry: pathophysiological implications. Lupus. 1996;5(5):480–7. · DOI
- Escribá PV. Membrane-lipid therapy: a new approach in molecular medicine. Trends Mol Med. 2006;12(1):34–43. · DOI
- Escriba PV, et al. Membranes: a meeting point for lipids, proteins and therapies. J Cell Mol Med. 2008;12(3):829–75. · DOI · Paper page
- Zhang TY, et al. Management of castrate resistant prostate cancer-recent advances and optimal sequence of treatments. Curr Urol Rep. 2013;14(3):174–83. · DOI
- Pascual F, Carman GM. Phosphatidate phosphatase, a key regulator of lipid homeostasis. Biochim Biophys Acta. 2013;1831(3):514–22. · DOI
- Liu Y. Fatty acid oxidation is a dominant bioenergetic pathway in prostate cancer. Prostate Cancer Prostatic Dis. 2006;9(3):230–4. · DOI
- Brohée L, et al. Lipin-1 regulates cancer cell phenotype and is a potential target to potentiate rapamycin treatment. Oncotarget. 2015;6(13):11264–80. · DOI
Cited by
Sorted by citations
Functional investigations of p53 acetylation enabled by heterobifunctional molecules
Chen, L.-Y., Singha Roy, S. J., Jadhav, A. M., Wang, W. W., Chen, P.-H., Bishop, T., Erb, M. A., & Parker, C. G. (2024) · ACS Chemical Biology · doi:10.1021/acschembio.4c00438 · Cited by 18
Hancock, S. E., Ding, E., Johansson Beves, E., Mitchell, T., & Turner, N. (2023) · Journal of Lipid Research · doi:10.1016/j.jlr.2023.100341 · Cited by 13
Metadata
- Authors
- Ingram, L. M., Finnerty, M. C., Mansoura, M., Chou, C.-W., & Cummings, B. S.
- ORCID
- Cummings, Brian S.
- Venue
- Lipids in Health and Disease
- Published
- 2021-02-17
- Volume
- 20
- Issue
- 1
- ISSN
- 1476-511X
- PMC
- PMC7890620
- Cited by
- 42
- References
- 3
- Language
- en
- Funders
- National Institutes of Health (S10RR028859)
- U.S. Department of Defense (PC150431 GRANT11996600)
About these checks
Registry, retraction, Cites and statistics results are computed, not judged, with one exception: a printed reference that no index lists is read once by a model before it counts as a citation error. Claims are extracted by a model and kept only when their quote appears verbatim in the text; each cited source is then checked, with a model’s help, for whether it says what the claim relies on. Those verdicts can be wrong — read the claim’s quote and the cited source before relying on one.
Statistics and arithmetic are recomputed, not judged.
Confidence bands are shown only for fields calibrated on our annotated test set. None is calibrated yet, so no band is shown.
What counts as a claim ›How we measure confidence ›How we check this ›
Are you an author, or do you see a problem with this page? Request a review
