Cited by 23

The DOI matches its Crossref record; 5 of the 5 references it cites were found in a registry or an index.

MiR-100-5p-rich small extracellular vesicles from activated neuron to aggravate microglial activation and neuronal activity after stroke

Xin, Danqing, Li, Tingting, Zhao, Yijing, Guo, Xiaofan, Gai, Chengcheng, Jiang, Zige, Yu, Shuwen, Cheng, Jiao, Song, Yan, Cheng, Yahong, Luo, Qian, Gu, Bing, Liu, Dexiang, Wang, Zhen·2024·Journal of Nanobiotechnology

Overview

The claims and statistics of this paper haven’t been checked yet.

Run the check — free, no account needed. It reads the open-access text and checks the sources it cites.

A few free checks a day · papers already verified open instantly · results are public

Integrity signals

Registry

Crossref · 10.1186/s12951-024-02782-0

Cites

5 of 5 references verified0 citation errors · 0 not checkable

Statistics

Figures

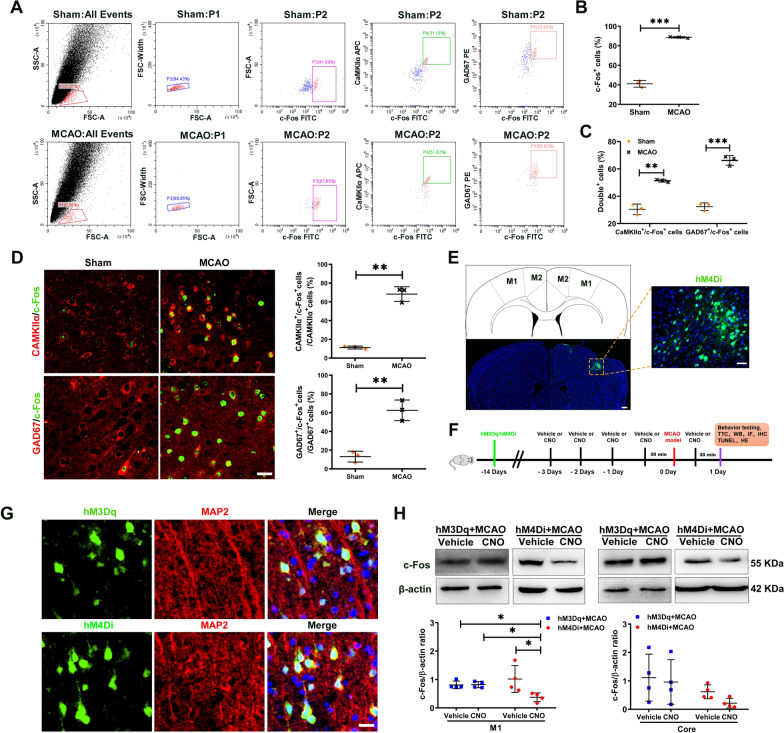
Fig. 1 Chemogenetic inhibition of M1 neuronal activity after ischemic stroke. A An example of FACS sorting of c-Fos+ cells, CaMKIIα+/c-Fos+ neurons and GAD67+/c-Fos+ neurons in M1 at 6 h after stroke. Sorting of c-Fos+ cells are located right (P3). Sorting of CaMKIIα+/c-Fos+ neurons (P4) or GAD67+/c-Fos+ neurons (P5) are located in the top right quadrants, respectively. B Percentage of c-Fos+ cells by FACS. N = 3/group. C Percentage of CaMKIIα+/c-Fos+ neurons and GAD67+/c-Fos+ neurons by FACS. N = 3/group. D Representative images and quantification of CaMKIIα+ or GAD67+ cells colabeled with c-Fos+ cells in M1 of Sham and MCAO mice. N = 3/group. Scale bar = 25 μm. E Top: Schematic shows location of viral vector (AAV9-hSyn-HA-hM4(Gi)-IRES-mCitrine (hM4Di)) injections (green) in M1. Scale bar = 100 μm. Bottom: Representative imaging shows expression of the mCitrine tag around M1. Scale bar = 50 μm. F Experimental design. Two weeks prior to surgery, viral administration was performed under anesthesia. Viral vector contains the DREADDs transgene (hM4Di, AAV9-hSyn-HA-hM3(Dq)-IRES-mCitrine (hM3Dq)). The intraperitoneal (i.p.) injection of clozapine-N-oxide (CNO) (1 mg/kg body weight) or Vehicle was administered in conscious mice for 5 times. CNO or Vehicle (once every 24 h, 3 times in total) was injected intraperitoneally 3 d before MCAO. The fourth injection of CNO or Vehicle was administered at 30 min before MCAO. The last injection of CNO or Vehicle was administered at 23.5 h after MCAO. The chosen doses of CNO did not induce any behavioral signs of seizure activity. At 24 h post-surgery, the tissues were collected for next experiment. G hM4Di or hM3Dq (green, infected cell) in M1, co-localize with MAP2 staining (red) 15 d after virus infection. Scale bar = 25 μm. H Western blot measurements of c-Fos protein expression in M1 and injury core of hM4Di + MCAO mice or hM3Dq + MCAO mice following Vehicle or CNO treatment at 24 h after stroke. The levels of c-Fos protein were quantitated by normalizing to β-actin. N = 4/group. All data are represented as mean ± SD. ** p < 0.01, *** p < 0.001 according to t-test in B-D. * p < 0.05 according to Kruskal–Wallis test in H (in M1). M1 primary motor cortex, M2 secondary motor cortex, TTC 2,3,5-triphenyltetrazolium chloride monohydrate, WB Western blot, IF Immunofluorescence staining, IHC Immunohistochemistry, HE Hematoxylin Eosin
Fig. 1 Chemogenetic inhibition of M1 neuronal activity after ischemic stroke. A An example of FACS sorting of c-Fos+ cells, CaMKIIα+/c-Fos+ neurons and GAD67+/c-Fos+ neurons in M1 at 6 h after stroke. Sorting of c-Fos+ cells are located right (P3). Sorting of CaMKIIα+/c-Fos+ neurons (P4) or GAD67+/c-Fos+ neurons (P5) are located in the top right quadrants, respectively. B Percentage of c-Fos+ cells by FACS. N = 3/group. C Percentage of CaMKIIα+/c-Fos+ neurons and GAD67+/c-Fos+ neurons by FACS. N = 3/group. D Representative images and quantification of CaMKIIα+ or GAD67+ cells colabeled with c-Fos+ cells in M1 of Sham and MCAO mice. N = 3/group. Scale bar = 25 μm. E Top: Schematic shows location of viral vector (AAV9-hSyn-HA-hM4(Gi)-IRES-mCitrine (hM4Di)) injections (green) in M1. Scale bar = 100 μm. Bottom: Representative imaging shows expression of the mCitrine tag around M1. Scale bar = 50 μm. F Experimental design. Two weeks prior to surgery, viral administration was performed under anesthesia. Viral vector contains the DREADDs transgene (hM4Di, AAV9-hSyn-HA-hM3(Dq)-IRES-mCitrine (hM3Dq)). The intraperitoneal (i.p.) injection of clozapine-N-oxide (CNO) (1 mg/kg body weight) or Vehicle was administered in conscious mice for 5 times. CNO or Vehicle (once every 24 h, 3 times in total) was injected intraperitoneally 3 d before MCAO. The fourth injection of CNO or Vehicle was administered at 30 min before MCAO. The last injection of CNO or Vehicle was administered at 23.5 h after MCAO. The chosen doses of CNO did not induce any behavioral signs of seizure activity. At 24 h post-surgery, the tissues were collected for next experiment. G hM4Di or hM3Dq (green, infected cell) in M1, co-localize with MAP2 staining (red) 15 d after virus infection. Scale bar = 25 μm. H Western blot measurements of c-Fos protein expression in M1 and injury core of hM4Di + MCAO mice or hM3Dq + MCAO mice following Vehicle or CNO treatment at 24 h after stroke. The levels of c-Fos protein were quantitated by normalizing to β-actin. N = 4/group. All data are represented as mean ± SD. ** p < 0.01, *** p < 0.001 according to t-test in B-D. * p < 0.05 according to Kruskal–Wallis test in H (in M1). M1 primary motor cortex, M2 secondary motor cortex, TTC 2,3,5-triphenyltetrazolium chloride monohydrate, WB Western blot, IF Immunofluorescence staining, IHC Immunohistochemistry, HE Hematoxylin EosinCC BY-NC-ND · PubMed Central
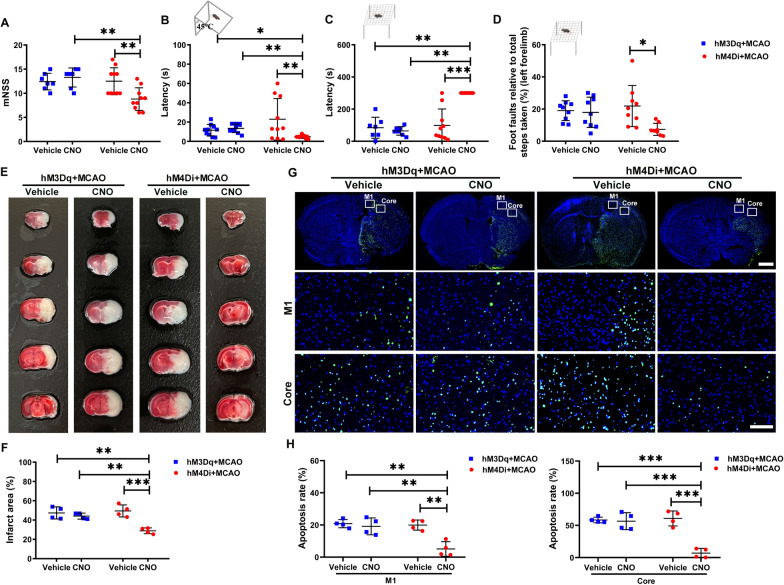
Fig. 2 Decreasing M1 neuronal activity rescued the neurological impairment and brain infarct area after ischemic stroke in mice. Neurological tests, including mNSS A (N = 7 for hM3Dq + MCAO + Vehicle group and hM3Dq + MCAO + CNO group, N = 10 for hM4Di + MCAO + Vehicle group and hM4Di + MCAO + CNO group), negative geotaxis test B (N = 10/group), Kondziella’s inverted screen test C (N = 7 for hM3Dq + MCAO + Vehicle group and hM3Dq + MCAO + CNO group; N = 10 for hM4Di + MCAO + Vehicle group and N = 8 for hM4Di + MCAO + CNO group), and grid-walking test D (N = 9 for hM3Dq + MCAO + Vehicle group, hM3Dq + MCAO + CNO group, and hM4Di + MCAO + Vehicle group, N = 8 for hM4Di + MCAO + CNO group). E Representative TTC staining of brain sections from hM3Dq + MCAO or hM4Di + MCAO mice following Vehicle or CNO treatment, the infarct area is shown in white. F Bar graph shows percentages of infarct area of indicated groups. N = 4/group. G Top: Representative TUNEL staining of brain sections from mice hM3Dq + MCAO or hM4Di + MCAO mice following Vehicle or CNO treatment. Scale bar = 1 mm. Bottom: Magnification of white frames in M1 and injury core. Scale bar = 100 μm. H Bar graph shows percentages of apoptosis rate of indicated groups. N = 4/group. All data are represented as mean ± SD.* p < 0.05, ** p < 0.01, *** p < 0.001 according to Kruskal–Wallis test in A –C. * p < 0.05, ** p < 0.01, *** p < 0.001 according to two-way ANOVA followed by the Bonferroni’s post hoc test in D, F, H
Fig. 2 Decreasing M1 neuronal activity rescued the neurological impairment and brain infarct area after ischemic stroke in mice. Neurological tests, including mNSS A (N = 7 for hM3Dq + MCAO + Vehicle group and hM3Dq + MCAO + CNO group, N = 10 for hM4Di + MCAO + Vehicle group and hM4Di + MCAO + CNO group), negative geotaxis test B (N = 10/group), Kondziella’s inverted screen test C (N = 7 for hM3Dq + MCAO + Vehicle group and hM3Dq + MCAO + CNO group; N = 10 for hM4Di + MCAO + Vehicle group and N = 8 for hM4Di + MCAO + CNO group), and grid-walking test D (N = 9 for hM3Dq + MCAO + Vehicle group, hM3Dq + MCAO + CNO group, and hM4Di + MCAO + Vehicle group, N = 8 for hM4Di + MCAO + CNO group). E Representative TTC staining of brain sections from hM3Dq + MCAO or hM4Di + MCAO mice following Vehicle or CNO treatment, the infarct area is shown in white. F Bar graph shows percentages of infarct area of indicated groups. N = 4/group. G Top: Representative TUNEL staining of brain sections from mice hM3Dq + MCAO or hM4Di + MCAO mice following Vehicle or CNO treatment. Scale bar = 1 mm. Bottom: Magnification of white frames in M1 and injury core. Scale bar = 100 μm. H Bar graph shows percentages of apoptosis rate of indicated groups. N = 4/group. All data are represented as mean ± SD.* p < 0.05, ** p < 0.01, *** p < 0.001 according to Kruskal–Wallis test in A –C. * p < 0.05, ** p < 0.01, *** p < 0.001 according to two-way ANOVA followed by the Bonferroni’s post hoc test in D, F, HCC BY-NC-ND · PubMed Central
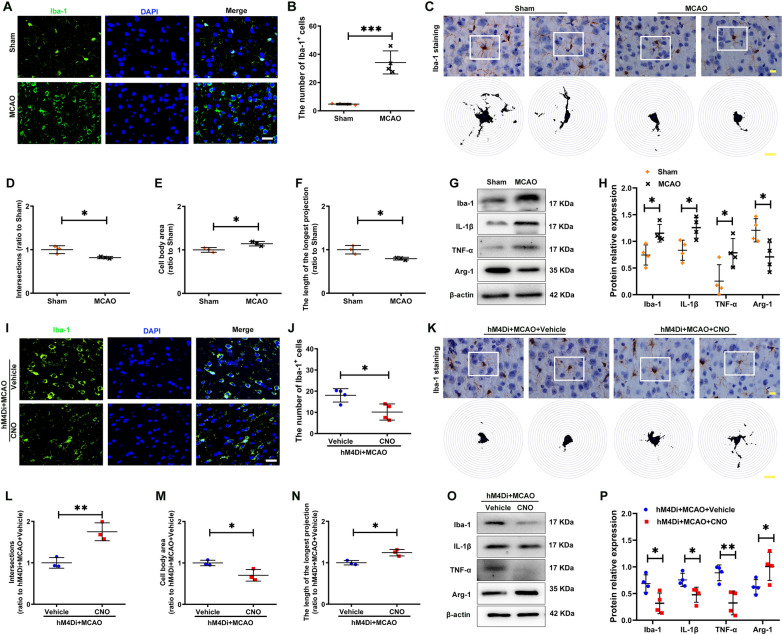
Fig. 3 Decreasing M1 neuronal activity inhibited microglia activation and inflammatory response in M1 of the ischemic brain. A, I Representative immunofluorescent staining for Iba-1 in the M1 of indicated groups, Scale bar = 25 μm. B, J Bar graph shows the number of Iba-1+ cell of indicated groups, N = 4/group. C, K Representative images of Iba1+ microglia and the Sholl analysis, the intersection number per radius over the distance from the cell body was displayed graphically in the curve. Scale bar = 10 μm. D–F, L–N The interactions, cell body area and maximum branch length were analyzed. N = 3/group. G, O Western blot measurements of Iba-1, IL-1β, TNF-α and Arg-1 protein levels in M1 of indicated groups. H, P The levels of Iba-1, IL-1β, TNF-α and Arg-1 were quantitated by normalizing to β-actin. N = 4/group. All data are represented as mean ± SD. * p < 0.05, ** p < 0.01, *** p < 0.001 according to t-test in A, H (IL-1β, TNF-α and Arg-1), D–F, J, L–N and P. * p < 0.05 according to Mann–Whitney U test in H (Iba-1)
Fig. 3 Decreasing M1 neuronal activity inhibited microglia activation and inflammatory response in M1 of the ischemic brain. A, I Representative immunofluorescent staining for Iba-1 in the M1 of indicated groups, Scale bar = 25 μm. B, J Bar graph shows the number of Iba-1+ cell of indicated groups, N = 4/group. C, K Representative images of Iba1+ microglia and the Sholl analysis, the intersection number per radius over the distance from the cell body was displayed graphically in the curve. Scale bar = 10 μm. D–F, L–N The interactions, cell body area and maximum branch length were analyzed. N = 3/group. G, O Western blot measurements of Iba-1, IL-1β, TNF-α and Arg-1 protein levels in M1 of indicated groups. H, P The levels of Iba-1, IL-1β, TNF-α and Arg-1 were quantitated by normalizing to β-actin. N = 4/group. All data are represented as mean ± SD. * p < 0.05, ** p < 0.01, *** p < 0.001 according to t-test in A, H (IL-1β, TNF-α and Arg-1), D–F, J, L–N and P. * p < 0.05 according to Mann–Whitney U test in H (Iba-1)CC BY-NC-ND · PubMed Central
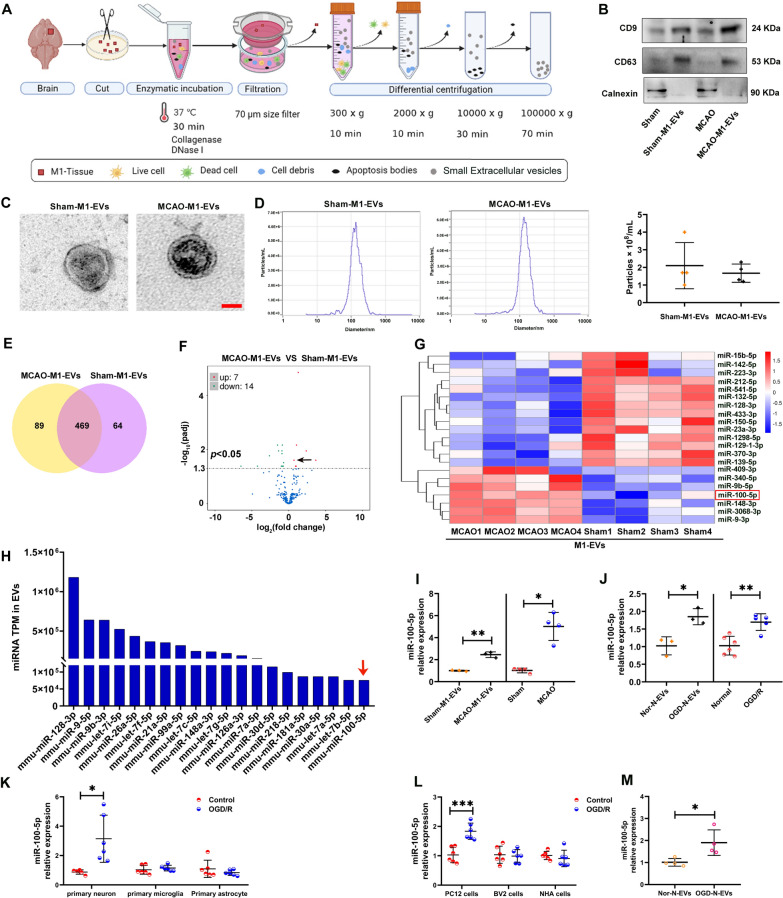
Fig. 4 Neuronal activity altered the expression of EVs-miRNA in M1 following ischemia stroke. A Schematic of the EVs isolation method from the M1 of Sham and MCAO mice (referred to as Sham-M1-EVs and MCAO-M1-EVs). B Western blot analysis of brain lysate and associated EVs (Sham-M1-EVs and MCAO-M1-EVs) for identified specific EVs proteins, as well as common EVs (CD9, CD63) and non‐EVs (calnexin) protein markers. C Transmission electron microscopy (TEM) images of isolated Sham-M1-EVs and MCAO-M1-EVs. Scale bar = 50 nm. D Size distribution of the isolated Sham-M1-EVs and MCAO-M1-EVs determined using ZetaView. The quantity of Sham-M1-EVs group and MCAO-M1-EVs group were measured using ZetaView. N = 3/group. E EVs miRNA abundance analysis by next-generation sequencing. Venn diagrams of the number of miRNA in M1-derived EVs from Sham mice (referred to as Sham-M1-EVs) and MCAO mice (referred to as MCAO-M1-EVs). The number in the center refers to miRNAs with no specific expression in M1-EVs studied. F Volcano plot of differential miRNA expression. The black dots represent the miRNA with no significant difference, the red dots represent the significantly upregulated differential miRNA, and the green dots represent the significantly downregulated differential miRNA. Black arrow indicates miR-100-5p. G Heatmap displaying of differential miRNA expression. MiRNA expression is hierarchically clustered on the y-axis, and M1-EVs from Sham and MCAO mice are hierarchically clustered on the x-axis. High expression based on normalized Ct is shown in red and low expression in blue. H The top 20 abundant miRNA in Sham-M1-EVs and MCAO-M1-EVs are shown. I qRT-PCR measurements of miR-100-5p in Sham-M1-EVs and MCAO-M1-EVs (N = 3 pools within Sham-M1-EVs group, and MCAO-M1-EVs group, 4 brains per pool), and M1 of Sham and MCAO mice (N = 4/group). J qRT-PCR measurements of miR-100-5p in Nor-N-EVs and OGD-N-EVs (N = 3/group), and normal and OGD/R-exposed PC12 cells (N = 6 for Normal group and N = 5 for OGD/R group). K Primary neuron, microglia and astrocytes were exposed to OGD/R, the expression of miR-100-5p in cells were detected by qRT-PCR. N = 5 for Control group in primary neuron and N = 6 for others group. L PC12 cells, BV-2 cells and fetal-derived normal human astrocytes (NHA) were exposed to OGD/R, the expression of miR-100-5p in cells were detected by qRT-PCR. N = 6/group. M BV-2 cells were incubated with OGD-N-EVs or OGD-N-EVs for 24 h, the expression of miR-100-5p in cells were detected by qRT-PCR. N = 4/group. All data are represented as mean ± SD. * p < 0.05, ** p < 0.01, *** p < 0.001 according to t-test in I (left), J, K (primary neuron) and L. * p < 0.05 according to Mann-Whitney U test in I (right) and M.
Fig. 4 Neuronal activity altered the expression of EVs-miRNA in M1 following ischemia stroke. A Schematic of the EVs isolation method from the M1 of Sham and MCAO mice (referred to as Sham-M1-EVs and MCAO-M1-EVs). B Western blot analysis of brain lysate and associated EVs (Sham-M1-EVs and MCAO-M1-EVs) for identified specific EVs proteins, as well as common EVs (CD9, CD63) and non‐EVs (calnexin) protein markers. C Transmission electron microscopy (TEM) images of isolated Sham-M1-EVs and MCAO-M1-EVs. Scale bar = 50 nm. D Size distribution of the isolated Sham-M1-EVs and MCAO-M1-EVs determined using ZetaView. The quantity of Sham-M1-EVs group and MCAO-M1-EVs group were measured using ZetaView. N = 3/group. E EVs miRNA abundance analysis by next-generation sequencing. Venn diagrams of the number of miRNA in M1-derived EVs from Sham mice (referred to as Sham-M1-EVs) and MCAO mice (referred to as MCAO-M1-EVs). The number in the center refers to miRNAs with no specific expression in M1-EVs studied. F Volcano plot of differential miRNA expression. The black dots represent the miRNA with no significant difference, the red dots represent the significantly upregulated differential miRNA, and the green dots represent the significantly downregulated differential miRNA. Black arrow indicates miR-100-5p. G Heatmap displaying of differential miRNA expression. MiRNA expression is hierarchically clustered on the y-axis, and M1-EVs from Sham and MCAO mice are hierarchically clustered on the x-axis. High expression based on normalized Ct is shown in red and low expression in blue. H The top 20 abundant miRNA in Sham-M1-EVs and MCAO-M1-EVs are shown. I qRT-PCR measurements of miR-100-5p in Sham-M1-EVs and MCAO-M1-EVs (N = 3 pools within Sham-M1-EVs group, and MCAO-M1-EVs group, 4 brains per pool), and M1 of Sham and MCAO mice (N = 4/group). J qRT-PCR measurements of miR-100-5p in Nor-N-EVs and OGD-N-EVs (N = 3/group), and normal and OGD/R-exposed PC12 cells (N = 6 for Normal group and N = 5 for OGD/R group). K Primary neuron, microglia and astrocytes were exposed to OGD/R, the expression of miR-100-5p in cells were detected by qRT-PCR. N = 5 for Control group in primary neuron and N = 6 for others group. L PC12 cells, BV-2 cells and fetal-derived normal human astrocytes (NHA) were exposed to OGD/R, the expression of miR-100-5p in cells were detected by qRT-PCR. N = 6/group. M BV-2 cells were incubated with OGD-N-EVs or OGD-N-EVs for 24 h, the expression of miR-100-5p in cells were detected by qRT-PCR. N = 4/group. All data are represented as mean ± SD. * p < 0.05, ** p < 0.01, *** p < 0.001 according to t-test in I (left), J, K (primary neuron) and L. * p < 0.05 according to Mann-Whitney U test in I (right) and M.CC BY-NC-ND · PubMed Central
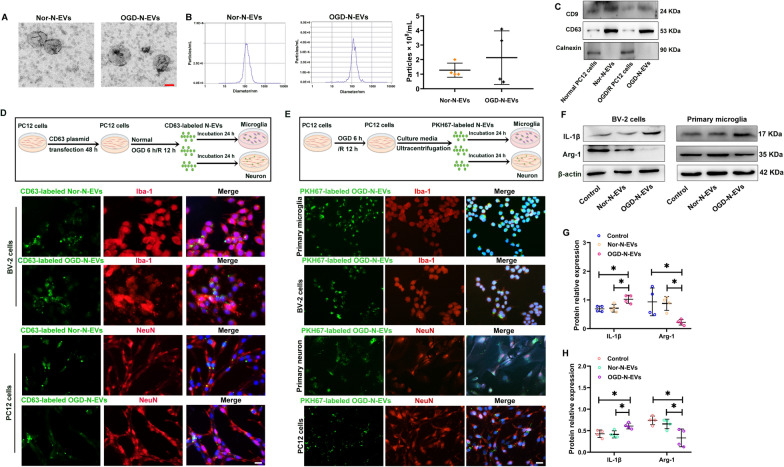
Fig. 5 Neuronal activity-releasing EVs led to microglia activation in vitro. A TEM images of EVs from normal PC12 cells (referred to as Nor-N-EVs) and OGD/R-exposed PC12 cells (referred to as OGD-N-EVs). Scale bar = 50 nm. B The Size distribution and quantity of the isolated Nor-N-EVs and OGD-N-EVs were determined using ZetaView. N = 3/group. C Western blot analysis of Nor-N-EVs and OGD-N-EVs for identified specific EVs proteins, as well as common EVs (CD9, CD63) and non-EVs (Calnexin) protein markers. D Top: An in vitro experiment illustration for CD63 labeled EVs. Bottom: CD63 plasmid was transfected with PC12 cells for 48 h and then exposed OGD/R or not, finally collected EVs (referred to as CD63-labeled OGD-N-EVs and CD63-labeled Nor-N-EVs). The collected EVs incubated with BV-2 cells or PC12 cells for 24 h. Then staining with Iba-1 (red) or NeuN (red) and DAPI (blue). Scale bar = 20 μm. E Top: An in vitro experiment illustration for PKH67-labeled OGD-N-EVs. Bottom: PKH67-labeled OGD-N-EVs were engulfed by Iba-1 labeled primary microglia and BV-2 cells at 24 h following EVs treatment. PKH67-labeled OGD-N-EVs were engulfed by NeuN labeled primary neuron and PC12 cells at 24 h following EVs treatment. Scale bar = 50 μm. F Western blot measurements of IL-1β and Arg-1 protein of BV-2 cells and primary microglia 24 h following Nor-N-EVs and OGD-N-EVs treatment. G The levels of IL-1β and Arg-1 of BV-2 cells were quantitated by normalizing to β-actin. N = 4/group. H The levels of IL-1β and Arg-1 of primary microglia were quantitated by normalizing to β-actin. N = 4/group. All data are represented as mean ± SD. * p < 0.05 according to one-way ANOVA followed by Bonferroni’s post hoc test
Fig. 5 Neuronal activity-releasing EVs led to microglia activation in vitro. A TEM images of EVs from normal PC12 cells (referred to as Nor-N-EVs) and OGD/R-exposed PC12 cells (referred to as OGD-N-EVs). Scale bar = 50 nm. B The Size distribution and quantity of the isolated Nor-N-EVs and OGD-N-EVs were determined using ZetaView. N = 3/group. C Western blot analysis of Nor-N-EVs and OGD-N-EVs for identified specific EVs proteins, as well as common EVs (CD9, CD63) and non-EVs (Calnexin) protein markers. D Top: An in vitro experiment illustration for CD63 labeled EVs. Bottom: CD63 plasmid was transfected with PC12 cells for 48 h and then exposed OGD/R or not, finally collected EVs (referred to as CD63-labeled OGD-N-EVs and CD63-labeled Nor-N-EVs). The collected EVs incubated with BV-2 cells or PC12 cells for 24 h. Then staining with Iba-1 (red) or NeuN (red) and DAPI (blue). Scale bar = 20 μm. E Top: An in vitro experiment illustration for PKH67-labeled OGD-N-EVs. Bottom: PKH67-labeled OGD-N-EVs were engulfed by Iba-1 labeled primary microglia and BV-2 cells at 24 h following EVs treatment. PKH67-labeled OGD-N-EVs were engulfed by NeuN labeled primary neuron and PC12 cells at 24 h following EVs treatment. Scale bar = 50 μm. F Western blot measurements of IL-1β and Arg-1 protein of BV-2 cells and primary microglia 24 h following Nor-N-EVs and OGD-N-EVs treatment. G The levels of IL-1β and Arg-1 of BV-2 cells were quantitated by normalizing to β-actin. N = 4/group. H The levels of IL-1β and Arg-1 of primary microglia were quantitated by normalizing to β-actin. N = 4/group. All data are represented as mean ± SD. * p < 0.05 according to one-way ANOVA followed by Bonferroni’s post hoc testCC BY-NC-ND · PubMed Central
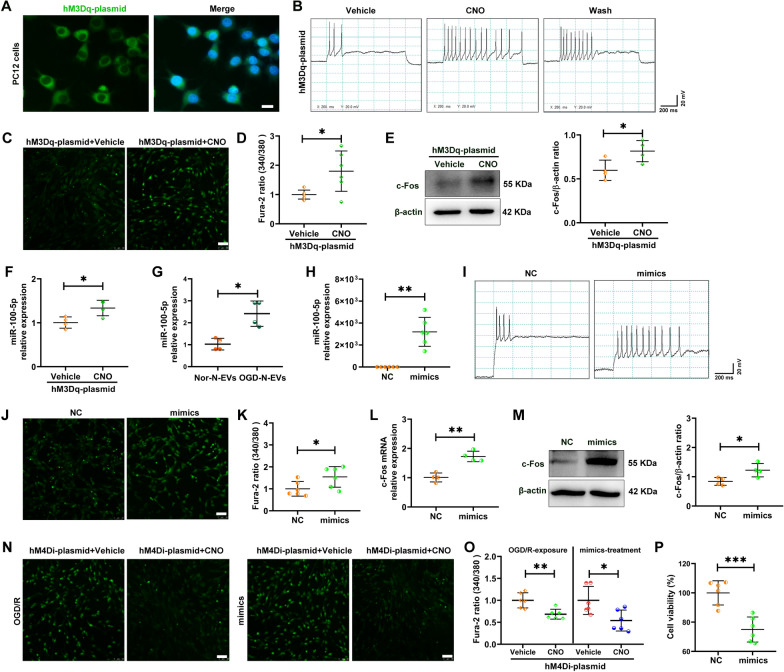
Fig. 6 MiR-100-5p showed positive feedback of neuronal activity. A PC12 cells were transfected with hM3Dq plasmid for 48 h, then fixed and taken the images. Scale bar = 20 μm. B Primary neuron were transfected with the hM3Dq plasmid for 48 h, then 10 μM CNO was added to cell cultures, and the firing of action currents in primary neurons was recorded. C After PC12 cells were transfected with hM3Dq plasmid for 48 h, 3 μM CNO or the Vehicle control was added to detect calcium imaging by confocal microscopy. Scale bar = 50 μm. D After PC12 cells were transfected with hM3Dq plasmid for 48 h, 3 μM CNO or the Vehicle control was added to detect the intracellular Ca2+ changes by microplate reader. N = 6/group. E The level of c-Fos was measured 48 h following hM3Dq plasmid transfection with western blot. The levels of c-Fos were quantitated by normalizing to β-actin. N = 4/group. F The level of miR-100-5p in cells from hM3Dq plasmid transfection with PC12 cells. N = 4/group. G PC12 cells were incubated with OGD-N-EVs or OGD-N-EVs for 24 h, the expression of miR-100-5p in PC12 cells were detected by qRT-PCR. N = 4/group. H The level of miR-100-5p in cells from miR-100-5p mimics (mimics) treatment with PC12 cells. I Primary neuron was transfected with the mimics or NC for 48 h, and the firing of action currents in primary neurons was recorded. N = 6/group. J After PC12 cells were transfected with miR-100-5p mimics (mimics) for 48 h, calcium imaging was detected by confocal microscopy. Scale bar = 50 μm. K Ca2+ concentrations in PC12 cells were measured 48 h following miR-100-5p mimics (mimics) treatment with a microplate reader. N = 6/group. L The level of c-Fos mRNA was measured at 24 h following miR-100-5p mimics (mimics) treatment by qRT-PCR. N = 4/group. M The level of c-Fos was measured 48 h following miR-100-5p mimics (mimics) treatment with western blot. The levels of c-Fos were quantitated by normalizing to β-actin. N = 4/group. N After PC12 cells were transfected with hM4Di plasmid with/without OGD/R-exposure or miR-100-5p mimics (mimics) treatment, and then the calcium imaging was detected by confocal microscopy. Scale bar = 50 μm. O PC12 cells were transfected with hM4Di plasmid with/without OGD/R-exposure or miR-100-5p mimics (mimics) treatment, and then measured Ca2+ concentrations by a microplate reader. N = 6/group. P CCK8 measurements of PC12 cell viability following 50 nM of miR-100-5p mimics (mimics) and its negative control (NC) treatment. N = 6/group. All data are represented as mean ± SD. * p < 0.05, ** p < 0.01, *** p < 0.001 according to t-test
Fig. 6 MiR-100-5p showed positive feedback of neuronal activity. A PC12 cells were transfected with hM3Dq plasmid for 48 h, then fixed and taken the images. Scale bar = 20 μm. B Primary neuron were transfected with the hM3Dq plasmid for 48 h, then 10 μM CNO was added to cell cultures, and the firing of action currents in primary neurons was recorded. C After PC12 cells were transfected with hM3Dq plasmid for 48 h, 3 μM CNO or the Vehicle control was added to detect calcium imaging by confocal microscopy. Scale bar = 50 μm. D After PC12 cells were transfected with hM3Dq plasmid for 48 h, 3 μM CNO or the Vehicle control was added to detect the intracellular Ca2+ changes by microplate reader. N = 6/group. E The level of c-Fos was measured 48 h following hM3Dq plasmid transfection with western blot. The levels of c-Fos were quantitated by normalizing to β-actin. N = 4/group. F The level of miR-100-5p in cells from hM3Dq plasmid transfection with PC12 cells. N = 4/group. G PC12 cells were incubated with OGD-N-EVs or OGD-N-EVs for 24 h, the expression of miR-100-5p in PC12 cells were detected by qRT-PCR. N = 4/group. H The level of miR-100-5p in cells from miR-100-5p mimics (mimics) treatment with PC12 cells. I Primary neuron was transfected with the mimics or NC for 48 h, and the firing of action currents in primary neurons was recorded. N = 6/group. J After PC12 cells were transfected with miR-100-5p mimics (mimics) for 48 h, calcium imaging was detected by confocal microscopy. Scale bar = 50 μm. K Ca2+ concentrations in PC12 cells were measured 48 h following miR-100-5p mimics (mimics) treatment with a microplate reader. N = 6/group. L The level of c-Fos mRNA was measured at 24 h following miR-100-5p mimics (mimics) treatment by qRT-PCR. N = 4/group. M The level of c-Fos was measured 48 h following miR-100-5p mimics (mimics) treatment with western blot. The levels of c-Fos were quantitated by normalizing to β-actin. N = 4/group. N After PC12 cells were transfected with hM4Di plasmid with/without OGD/R-exposure or miR-100-5p mimics (mimics) treatment, and then the calcium imaging was detected by confocal microscopy. Scale bar = 50 μm. O PC12 cells were transfected with hM4Di plasmid with/without OGD/R-exposure or miR-100-5p mimics (mimics) treatment, and then measured Ca2+ concentrations by a microplate reader. N = 6/group. P CCK8 measurements of PC12 cell viability following 50 nM of miR-100-5p mimics (mimics) and its negative control (NC) treatment. N = 6/group. All data are represented as mean ± SD. * p < 0.05, ** p < 0.01, *** p < 0.001 according to t-testCC BY-NC-ND · PubMed Central
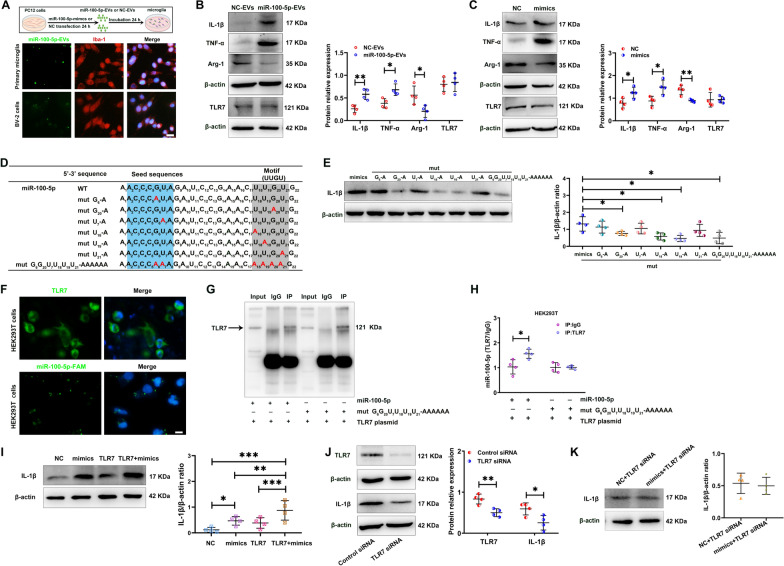
Fig. 7 MiR-100-5p activated innate immune response and neurotoxicity via its U18U19G20-containing motif and direct association with TLR7. A Top: Experimental design, PC12 cells were transfected with 50 nM NC or miR-100-5p mimics for 24 h, and collected EVs (referred as NC-EVs and miR-100-5p-EVs). Bottom: Primary microglia and BV-2 cells were incubated with miR-100-5p-EVs (5-Carboxyfluorescein, FAM) (green) for 24 h. Cells were then fixed and stained with Iba-1 (red). Scale bar = 25 μm. B Western blot measurements of IL-1β, TNF-α, Arg-1 and TLR7 protein of BV-2 cells following NC-EVsand miR-100-5p-EVs treatment for 24 h. N = 4/group. C Western blot measurements of IL-1β, TNF-α, Arg-1 and TLR7 protein of BV-2 cells following 50 nM miR-100-5p mimics (mimics) and its negative control (NC) treatment for 48 h. The levels of IL-1β, TNF-α, Arg-1 and TLR7 were quantitated by normalizing to β-actin. N = 4/group. D Nucleotide sequences of miR-100-5p and its various U/A and or G/A mutants. The U18U19G20U21 motif sequence is highlighted in gray shade. The seed sequences are highlighted in blue shade. U/A and or G/A mutants are in red. E Western blot measurements of IL-1β protein of BV-2 cells following 50 nM of miR-100-5p or its various U/A and or G/A mutants treatment. N = 4/group. F HEK293T cells were transfected with TLR7 plasmid (green) and with/without miR-100-5p-FAM (green). Scale bar = 20 μm. G Representative immunoprecipitation (IP) using anti-IgG or anti-TLR7 antibody in HEK293T cells followed by western blot for TLR7. H qRT-PCR analysis of miR-100-5p associated with TLR7. N = 4/group. I Western blot measurements of IL-1β of HEK293T cells following 50 nM of miR-100-5p mimics (mimics) with/without TLR7 plasmid (2 µg/mL) transfection. The levels of IL-1β were quantitated by normalizing to β-actin. N = 4/group. J Expression of TLR7 in BV-2 cells was knocked down via siRNA technology. TLR7 and IL-1β protein was measured with western blot. The levels of TLR7 and IL-1β were quantitated by normalizing to β-actin. N = 4/group. K BV-2 cells were transfected with TLR7 siRNA (50 nM) and miR-100-5p mimics (mimics) (50 nM) or its negative control (NC) for 48 h. The levels of IL-1β were investigated by western blot. The levels of IL-1β were quantitated by normalizing to β-actin. N = 4/group. All data are represented as mean ± SD. * p < 0.05, ** p < 0.01 according to t-test in B, C, E, H, J and K. * p < 0.05, ** p < 0.01, *** p < 0.001 according to one-way ANOVA followed by Bonferroni’s post hoc test in I
Fig. 7 MiR-100-5p activated innate immune response and neurotoxicity via its U18U19G20-containing motif and direct association with TLR7. A Top: Experimental design, PC12 cells were transfected with 50 nM NC or miR-100-5p mimics for 24 h, and collected EVs (referred as NC-EVs and miR-100-5p-EVs). Bottom: Primary microglia and BV-2 cells were incubated with miR-100-5p-EVs (5-Carboxyfluorescein, FAM) (green) for 24 h. Cells were then fixed and stained with Iba-1 (red). Scale bar = 25 μm. B Western blot measurements of IL-1β, TNF-α, Arg-1 and TLR7 protein of BV-2 cells following NC-EVsand miR-100-5p-EVs treatment for 24 h. N = 4/group. C Western blot measurements of IL-1β, TNF-α, Arg-1 and TLR7 protein of BV-2 cells following 50 nM miR-100-5p mimics (mimics) and its negative control (NC) treatment for 48 h. The levels of IL-1β, TNF-α, Arg-1 and TLR7 were quantitated by normalizing to β-actin. N = 4/group. D Nucleotide sequences of miR-100-5p and its various U/A and or G/A mutants. The U18U19G20U21 motif sequence is highlighted in gray shade. The seed sequences are highlighted in blue shade. U/A and or G/A mutants are in red. E Western blot measurements of IL-1β protein of BV-2 cells following 50 nM of miR-100-5p or its various U/A and or G/A mutants treatment. N = 4/group. F HEK293T cells were transfected with TLR7 plasmid (green) and with/without miR-100-5p-FAM (green). Scale bar = 20 μm. G Representative immunoprecipitation (IP) using anti-IgG or anti-TLR7 antibody in HEK293T cells followed by western blot for TLR7. H qRT-PCR analysis of miR-100-5p associated with TLR7. N = 4/group. I Western blot measurements of IL-1β of HEK293T cells following 50 nM of miR-100-5p mimics (mimics) with/without TLR7 plasmid (2 µg/mL) transfection. The levels of IL-1β were quantitated by normalizing to β-actin. N = 4/group. J Expression of TLR7 in BV-2 cells was knocked down via siRNA technology. TLR7 and IL-1β protein was measured with western blot. The levels of TLR7 and IL-1β were quantitated by normalizing to β-actin. N = 4/group. K BV-2 cells were transfected with TLR7 siRNA (50 nM) and miR-100-5p mimics (mimics) (50 nM) or its negative control (NC) for 48 h. The levels of IL-1β were investigated by western blot. The levels of IL-1β were quantitated by normalizing to β-actin. N = 4/group. All data are represented as mean ± SD. * p < 0.05, ** p < 0.01 according to t-test in B, C, E, H, J and K. * p < 0.05, ** p < 0.01, *** p < 0.001 according to one-way ANOVA followed by Bonferroni’s post hoc test in ICC BY-NC-ND · PubMed Central
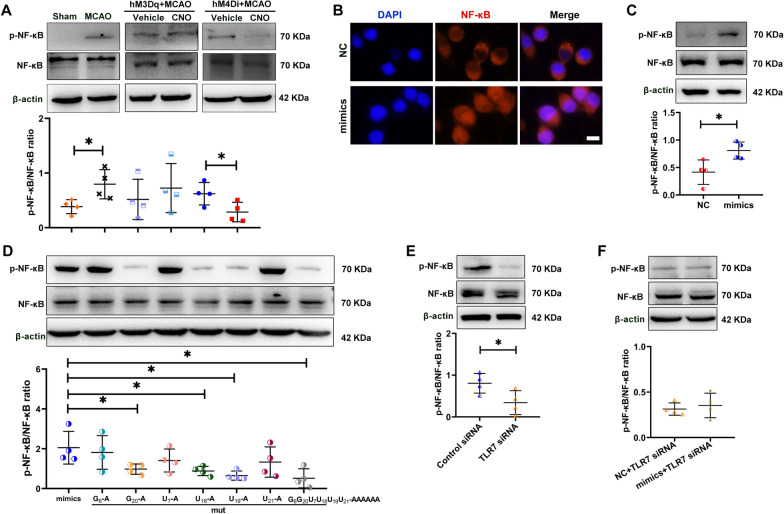
Fig. 8 MiR-100-5p activated NF-κB via TLR7 signaling. A Western blot measurements of NF-κB and phosphorylated NF-κB (p-NF-κB) levels in the M1 of each group. N = 4/group. B BV-2 cells were treated with 50 nM of miR-100-5p mimics (mimics) and its negative control (NC) for 48 h, then stained with NF-κB (red) and DAPI (blue). Scale bar = 20 μm. C BV-2 cells were treated with 50 nM of miR-100-5p mimics (mimics) and its negative control (NC) for 48 h. Then cells were lysed and tested for NF-κB and p-NF-κB. N = 4/group. D BV-2 cells were treated with 50 nM of miR-100-5p mimics (mimics) and its mutant for 48 h, cells were lysed and tested for NF-κB and p-NF-κB. N = 4/group. E Expression of TLR7 in BV-2 cells was knocked down via siRNA technology. Then, NF-κB and p-NF-κB protein were measured with western blot. The levels of NF-κB and p-NF-κB was quantitated by normalizing to β-actin. N = 4/group. F BV-2 cells were transfected with TLR7 siRNA (50 nM) and miR-100-5p mimics (mimics) (50 nM) or its negative control (NC) for 48 h. The levels of NF-κB and p-NF-κB were quantitated by normalizing to β-actin. N = 4/group. All data are represented as mean ± SD. * p < 0.05 according to t-test except D (mimics vs mut U19-A). * p < 0.05 according to Mann–Whitney U test in D (mimics vs mut U19-A)
Fig. 8 MiR-100-5p activated NF-κB via TLR7 signaling. A Western blot measurements of NF-κB and phosphorylated NF-κB (p-NF-κB) levels in the M1 of each group. N = 4/group. B BV-2 cells were treated with 50 nM of miR-100-5p mimics (mimics) and its negative control (NC) for 48 h, then stained with NF-κB (red) and DAPI (blue). Scale bar = 20 μm. C BV-2 cells were treated with 50 nM of miR-100-5p mimics (mimics) and its negative control (NC) for 48 h. Then cells were lysed and tested for NF-κB and p-NF-κB. N = 4/group. D BV-2 cells were treated with 50 nM of miR-100-5p mimics (mimics) and its mutant for 48 h, cells were lysed and tested for NF-κB and p-NF-κB. N = 4/group. E Expression of TLR7 in BV-2 cells was knocked down via siRNA technology. Then, NF-κB and p-NF-κB protein were measured with western blot. The levels of NF-κB and p-NF-κB was quantitated by normalizing to β-actin. N = 4/group. F BV-2 cells were transfected with TLR7 siRNA (50 nM) and miR-100-5p mimics (mimics) (50 nM) or its negative control (NC) for 48 h. The levels of NF-κB and p-NF-κB were quantitated by normalizing to β-actin. N = 4/group. All data are represented as mean ± SD. * p < 0.05 according to t-test except D (mimics vs mut U19-A). * p < 0.05 according to Mann–Whitney U test in D (mimics vs mut U19-A)CC BY-NC-ND · PubMed Central
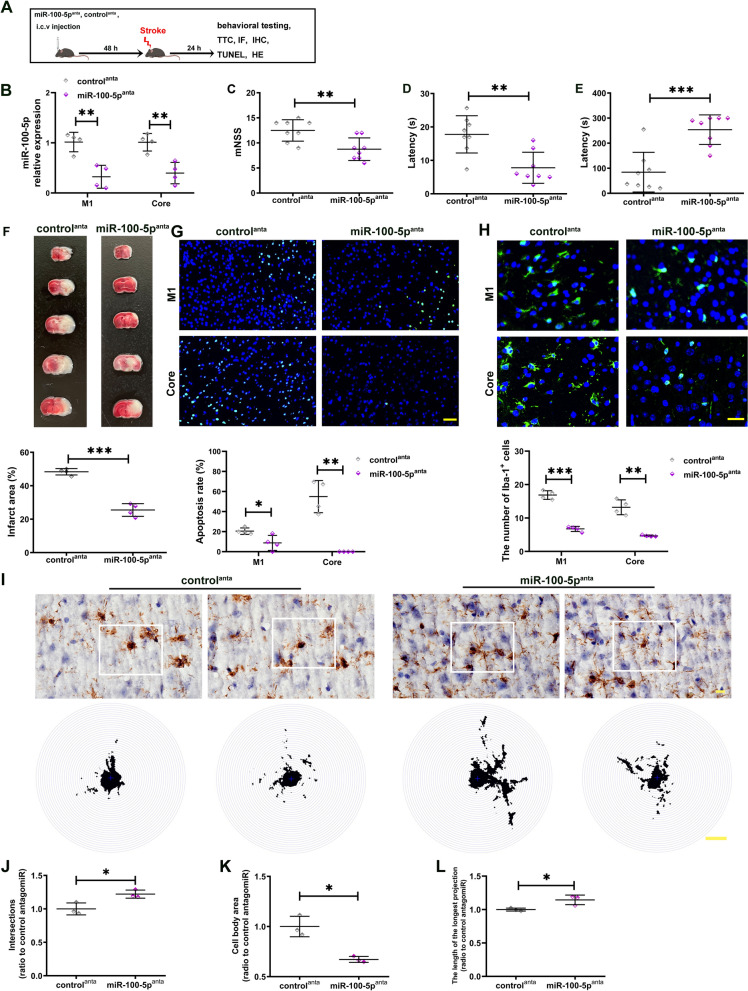
Fig. 9 Knockdown of miR-100-5p by antagomiR could partially prevented stroke via reducing inflammation and improving organ function. A Experimental design. The mice were administered with miR-100-5p antagomiR (miR-100-5panta) (100 pmol) or the control antagomiR (controlanta) via unilateral stereotaxic microinjection into intracerebroventricular 48 h prior to MCAO. Twenty-four hours after MCAO, the mice were behavioral studies, infarction, inflammation and apoptosis examination. i.c.v: intracerebroventricular. B Twenty-four hours after MCAO, miR-100-5p abundance was measured in M1 and core with qRT-PCR. N = 4/group. Neurological tests, including mNSS C, negative geotaxis test D, and Kondziella’s inverted screen test E were performed in MCAO mice following miR-100-5panta (100 pmol) or controlanta pre-treatment. N = 8/group. F Representative TTC staining of brain sections from MCAO mice following miR-100-5panta or controlanta pre-treatment, the infarct area is shown in white. Bar graph shows percentages of infarct area of indicated groups. N = 4/group. G Representative TUNEL staining of brain sections from MCAO mice following miR-100-5panta or controlanta pre-treatment. Scale bar = 50 μm. Bar graph shows percentages of apoptosis rate of indicated groups. N = 4/group. H Iba-1 staining of brain sections from MCAO mice following miR-100-5panta or controlanta pre-treatment. Scale bar = 25 μm. Bar graph shows the number of Iba-1+ cell of indicated groups. N = 4/group. I Representative images of Iba1+ microglia and the Sholl analysis, the intersection number per radius over the distance from the cell body was displayed graphically in the curve. Scale bar = 10 μm. J–L The interactions, cell body area and maximum branch length were analyzed. N = 3/group. All data are represented as mean ± SD. * p < 0.05, ** p < 0.01, *** p < 0.001 according to t-test except E. ** p < 0.01 according to Mann–Whitney U test in E
Fig. 9 Knockdown of miR-100-5p by antagomiR could partially prevented stroke via reducing inflammation and improving organ function. A Experimental design. The mice were administered with miR-100-5p antagomiR (miR-100-5panta) (100 pmol) or the control antagomiR (controlanta) via unilateral stereotaxic microinjection into intracerebroventricular 48 h prior to MCAO. Twenty-four hours after MCAO, the mice were behavioral studies, infarction, inflammation and apoptosis examination. i.c.v: intracerebroventricular. B Twenty-four hours after MCAO, miR-100-5p abundance was measured in M1 and core with qRT-PCR. N = 4/group. Neurological tests, including mNSS C, negative geotaxis test D, and Kondziella’s inverted screen test E were performed in MCAO mice following miR-100-5panta (100 pmol) or controlanta pre-treatment. N = 8/group. F Representative TTC staining of brain sections from MCAO mice following miR-100-5panta or controlanta pre-treatment, the infarct area is shown in white. Bar graph shows percentages of infarct area of indicated groups. N = 4/group. G Representative TUNEL staining of brain sections from MCAO mice following miR-100-5panta or controlanta pre-treatment. Scale bar = 50 μm. Bar graph shows percentages of apoptosis rate of indicated groups. N = 4/group. H Iba-1 staining of brain sections from MCAO mice following miR-100-5panta or controlanta pre-treatment. Scale bar = 25 μm. Bar graph shows the number of Iba-1+ cell of indicated groups. N = 4/group. I Representative images of Iba1+ microglia and the Sholl analysis, the intersection number per radius over the distance from the cell body was displayed graphically in the curve. Scale bar = 10 μm. J–L The interactions, cell body area and maximum branch length were analyzed. N = 3/group. All data are represented as mean ± SD. * p < 0.05, ** p < 0.01, *** p < 0.001 according to t-test except E. ** p < 0.01 according to Mann–Whitney U test in ECC BY-NC-ND · PubMed Central

Verification

Claims the paper makes

The claims and statistics of this paper haven’t been checked yet.

Run the check — free, no account needed. It reads the open-access text and checks the sources it cites.

A few free checks a day · papers already verified open instantly · results are public

Claims other papers make about this one

Each is checked against this paper’s own text: does it say what the citing paper says it does?

Self-check

Percentages, sums and reported differences re-computed from the paper’s own numbers.

The self-check needs the paper’s full text.

Citations

Cites

Research works printed but not linked: 73

  1. George PM, Steinberg GK. Novel stroke therapeutics: unraveling stroke pathophysiology and its impact on clinical treatments. Neuron. 2015;87:297–309. · DOI
  2. Hartings JA, Rolli ML, Lu X-CM, Tortella FC. Delayed secondary phase of peri-infarct depolarizations after focal cerebral ischemia: relation to infarct growth and neuroprotection. J Neurosci. 2003;23:11602–10. · DOI
  3. Chamorro Á, Dirnagl U, Urra X, Planas AM. Neuroprotection in acute stroke: targeting excitotoxicity, oxidative and nitrosative stress, and inflammation. Lancet Neurol. 2016;15:869–81. · DOI · Paper page
  4. von Bornstädt D, Houben T, Seidel JL, Zheng Y, Dilekoz E, Qin T, et al. Supply-demand mismatch transients in susceptible peri-infarct hot zones explain the origins of spreading injury depolarizations. Neuron. 2015;85:1117–31. · DOI
  5. Hossmann KA. Periinfarct depolarizations. Cerebrovasc Brain Metab Rev. 1996;8:195–208.
  6. Xia X, Chen J, Ren H, Zhou C, Zhang Q, Cheng H, et al. Gypenoside pretreatment alleviates the cerebral ischemia injury via inhibiting the microglia-mediated neuroinflammation. Mol Neurobiol. 2023. https://doi.org/10.1007/s12035-023-03624-0. · DOI
  7. Wang Y-C, Galeffi F, Wang W, Li X, Lu L, Sheng H, et al. Chemogenetics-mediated acute inhibition of excitatory neuronal activity improves stroke outcome. Exp Neurol. 2020;326: 113206. · DOI
  8. Caracciolo L, Marosi M, Mazzitelli J, Latifi S, Sano Y, Galvan L, et al. CREB controls cortical circuit plasticity and functional recovery after stroke. Nat Commun. 2018;9:2250. · DOI
  9. Carmichael ST. Emergent properties of neural repair: elemental biology to therapeutic concepts. Ann Neurol. 2016;79:895–906. · DOI
  10. Di Pino G, Pellegrino G, Assenza G, Capone F, Ferreri F, Formica D, et al. Modulation of brain plasticity in stroke: a novel model for neurorehabilitation. Nat Rev Neurol. 2014;10:597–608. · DOI
  11. Rivera-Urbina GN, Batsikadze G, Molero-Chamizo A, Paulus W, Kuo M-F, Nitsche MA. Parietal transcranial direct current stimulation modulates primary motor cortex excitability. Eur J Neurosci. 2015;41:845–55. · DOI
  12. Hu K-H, Li Y-A, Jia W, Wu G-Y, Sun L, Wang S-R, et al. Chemogenetic activation of glutamatergic neurons in the motor cortex promotes functional recovery after ischemic stroke in rats. Behav Brain Res. 2019;359:81–8. · DOI
  13. Cheng MY, Wang EH, Woodson WJ, Wang S, Sun G, Lee AG, et al. Optogenetic neuronal stimulation promotes functional recovery after stroke. Proc Natl Acad Sci U S A. 2014;111:12913–8. · DOI
  14. Théry C, Witwer KW, Aikawa E, Alcaraz MJ, Anderson JD, Andriantsitohaina R, et al. Minimal information for studies of extracellular vesicles 2018 (MISEV2018): a position statement of the international society for extracellular vesicles and update of the MISEV2014 guidelines. J Extracell Vesicles. 2018;7:1535750. · DOI · Paper page
  15. Jia Y, Yu L, Ma T, Xu W, Qian H, Sun Y, et al. Small extracellular vesicles isolation and separation: current techniques, pending questions and clinical applications. Theranostics. 2022;12:6548–75. · DOI
  16. Mathieu M, Martin-Jaular L, Lavieu G, Théry C. Specificities of secretion and uptake of exosomes and other extracellular vesicles for cell-to-cell communication. Nat Cell Biol. 2019;21:9–17. · DOI
  17. Deng Z, Wang J, Xiao Y, Li F, Niu L, Liu X, et al. Ultrasound-mediated augmented exosome release from astrocytes alleviates amyloid-β-induced neurotoxicity. Theranostics. 2021;11:4351–62. · DOI
  18. Chiang C-S, Fu S-J, Hsu C-L, Jeng C-J, Tang C-Y, Huang Y-S, et al. Neuronal exosomes secreted under oxygen-glucose deprivation/reperfusion presenting differentially expressed mirnas and affecting neuronal survival and neurite outgrowth. Neuromolecular Med. 2021;23:404–15. · DOI
  19. Wilton DK, Dissing-Olesen L, Stevens B. Neuron-glia signaling in synapse elimination. Annu Rev Neurosci. 2019;42:107–27. · DOI · Paper page
  20. Frühbeis C, Fröhlich D, Kuo WP, Amphornrat J, Thilemann S, Saab AS, et al. Neurotransmitter-triggered transfer of exosomes mediates oligodendrocyte-neuron communication. PLoS Biol. 2013;11: e1001604. · DOI · Paper page
  21. Yin Z, Han Z, Hu T, Zhang S, Ge X, Huang S, et al. Neuron-derived exosomes with high miR-21-5p expression promoted polarization of M1 microglia in culture. Brain Behav Immun. 2020;83:270–82. · DOI · Paper page
  22. Jiang D, Gong F, Ge X, Lv C, Huang C, Feng S, et al. Neuron-derived exosomes-transmitted miR-124-3p protect traumatically injured spinal cord by suppressing the activation of neurotoxic microglia and astrocytes. J Nanobiotechnology. 2020;18:105. · DOI · Paper page
  23. Peng H, Harvey BT, Richards CI, Nixon K. Neuron-derived extracellular vesicles modulate microglia activation and function. Biology (Basel). 2021;10:948.
  24. Han M, Cao Y, Xue H, Chu X, Li T, Xin D, et al. Neuroprotective effect of mesenchymal stromal cell-derived extracellular vesicles against cerebral ischemia-reperfusion-induced neural functional injury: a pivotal role for AMPK and JAK2/STAT3/NF-κB Signaling pathway modulation. Drug Des Devel Ther. 2020;14:2865–76. · DOI
  25. Kim H, Seo JS, Lee S-Y, Ha K-T, Choi BT, Shin Y-I, et al. AIM2 inflammasome contributes to brain injury and chronic post-stroke cognitive impairment in mice. Brain Behav Immun. 2020;87:765–76. · DOI
  26. Chen J, Sanberg PR, Li Y, Wang L, Lu M, Willing AE, et al. Intravenous administration of human umbilical cord blood reduces behavioral deficits after stroke in rats. Stroke. 2001;32:2682–8. · DOI
  27. Ridder K, Sevko A, Heide J, Dams M, Rupp A-K, Macas J, et al. Extracellular vesicle-mediated transfer of functional RNA in the tumor microenvironment. Oncoimmunology. 2015;4: e1008371. · DOI
  28. Tian Y, Gong M, Hu Y, Liu H, Zhang W, Zhang M, et al. Quality and efficiency assessment of six extracellular vesicle isolation methods by nano-flow cytometry. J Extracell Vesicles. 2020;9:1697028. · DOI · Paper page
  29. Xin D, Li T, Chu X, Ke H, Liu D, Wang Z. MSCs-extracellular vesicles attenuated neuroinflammation, synapse damage and microglial phagocytosis after hypoxia-ischemia injury by preventing osteopontin expression. Pharmacol Res. 2021;164: 105322. · DOI
  30. Brewer HB, Ronan R, Meng M, Bishop C. Isolation and characterization of apolipoproteins A-I, A-II, and A-IV. Methods Enzymol. 1986;128:223–46. · DOI
  31. Rubio FJ, Li X, Liu Q-R, Cimbro R, Hope BT. Fluorescence activated cell sorting (FACS) and gene expression analysis of Fos-expressing neurons from fresh and frozen rat brain tissue. J Vis Exp. 2016. https://doi.org/10.3791/54358-v. · DOI
  32. Rubio FJ, Liu Q-R, Li X, Cruz FC, Leão RM, Warren BL, et al. Context-induced reinstatement of methamphetamine seeking is associated with unique molecular alterations in Fos-expressing dorsolateral striatum neurons. J Neurosci. 2015;35:5625–39. · DOI
  33. Slepko N, Levi G. Progressive activation of adult microglial cells in vitro. Glia. 1996;16:241–6. · DOI
  34. Wallach T, Mossmann ZJ, Szczepek M, Wetzel M, Machado R, Raden M, et al. MicroRNA-100-5p and microRNA-298-5p released from apoptotic cortical neurons are endogenous Toll-like receptor 7/8 ligands that contribute to neurodegeneration. Mol Neurodegener. 2021;16:80. · DOI · Paper page
  35. Lehmann SM, Krüger C, Park B, Derkow K, Rosenberger K, Baumgart J, et al. An unconventional role for miRNA: let-7 activates Toll-like receptor 7 and causes neurodegeneration. Nat Neurosci. 2012;15:827–35. · DOI · Paper page
  36. Zhang Z, Ohto U, Shibata T, Taoka M, Yamauchi Y, Sato R, et al. Structural analyses of toll-like receptor 7 reveal detailed rna sequence specificity and recognition mechanism of agonistic ligands. Cell Rep. 2018;25:3371-3381.e5. · DOI
  37. Nazmi A, Mukherjee S, Kundu K, Dutta K, Mahadevan A, Shankar SK, et al. TLR7 is a key regulator of innate immunity against Japanese encephalitis virus infection. Neurobiol Dis. 2014;69:235–47. · DOI
  38. Eng H-L, Hsu Y-Y, Lin T-M. Differences in TLR7/8 activation between monocytes and macrophages. Biochem Biophys Res Commun. 2018;497:319–25. · DOI
  39. Ahn JH, Song M, Kim H, Lee T-K, Park CW, Park YE, et al. Differential regional infarction, neuronal loss and gliosis in the gerbil cerebral hemisphere following 30 min of unilateral common carotid artery occlusion. Metab Brain Dis. 2019;34:223–33. · DOI
  40. Park JH, Cho JH, Ahn JH, Choi SY, Lee T-K, Lee J-C, et al. Neuronal loss and gliosis in the rat striatum subjected to 15 and 30 minutes of middle cerebral artery occlusion. Metab Brain Dis. 2018;33:775–84. · DOI
  41. Lefaucheur J-P, André-Obadia N, Antal A, Ayache SS, Baeken C, Benninger DH, et al. Evidence-based guidelines on the therapeutic use of repetitive transcranial magnetic stimulation (rTMS). Clin Neurophysiol. 2014;125:2150–206. · DOI · Paper page
  42. Levy RM, Harvey RL, Kissela BM, Winstein CJ, Lutsep HL, Parrish TB, et al. Epidural electrical stimulation for stroke rehabilitation: results of the prospective, multicenter, randomized single-blinded everest trial. Neurorehabil Neural Repair. 2016;30:107–19. · DOI
  43. Roque C, Pinto N, Vaz Patto M, Baltazar G. Astrocytes contribute to the neuronal recovery promoted by high-frequency repetitive magnetic stimulation in in vitro models of ischemia. J Neurosci Res. 2021;99:1414–32. · DOI
  44. Gava-Junior G, Ferreira SA, Roque C, Mendes-Oliveira J, Serrenho I, Pinto N, et al. High-frequency repetitive magnetic stimulation rescues ischemia-injured neurons through modulation of glial-derived neurotrophic factor present in the astrocyte’s secretome. J Neurochem. 2023;164:813–28. · DOI
  45. Lee S, Toda T, Kiyama H, Yamashita T. Weakened rate-dependent depression of Hoffmann’s reflex and increased motoneuron hyperactivity after motor cortical infarction in mice. Cell Death Dis. 2014;5: e1007. · DOI
  46. Zhang H, Li L, Xu G-Y, Mei Y-W, Zhang J-J, Murong S-X, et al. Changes of c-fos, malondialdehyde and lactate in brain tissue after global cerebral ischemia under different brain temperatures. J Huazhong Univ Sci Technolog Med Sci. 2014;34:354–8. · DOI
  47. Uemura Y, Kowall NW, Moskowitz MA. Focal ischemia in rats causes time-dependent expression of c-fos protein immunoreactivity in widespread regions of ipsilateral cortex. Brain Res. 1991;552:99–105. · DOI
  48. Estus S, Zaks WJ, Freeman RS, Gruda M, Bravo R, Johnson EM. Altered gene expression in neurons during programmed cell death: identification of c-jun as necessary for neuronal apoptosis. J Cell Biol. 1994;127:1717–27. · DOI
  49. Estus S, Tucker HM, van Rooyen C, Wright S, Brigham EF, Wogulis M, et al. Aggregated amyloid-beta protein induces cortical neuronal apoptosis and concomitant “apoptotic” pattern of gene induction. J Neurosci. 1997;17:7736–45. · DOI
  50. Hoffman GE, Smith MS, Verbalis JG. c-Fos and related immediate early gene products as markers of activity in neuroendocrine systems. Front Neuroendocrinol. 1993;14:173–213. · DOI · Paper page
  51. Kovács KJ. Measurement of immediate-early gene activation- c-fos and beyond. J Neuroendocrinol. 2008;20:665–72. · DOI · Paper page
  52. Cho J, Ryu S, Lee S, Kim J, Park J-Y, Kwon H-S, et al. Clozapine-induced chemogenetic neuromodulation rescues post-stroke deficits after chronic capsular infarct. Transl Stroke Res. 2023;14:499–512. · DOI
  53. Norris GT, Smirnov I, Filiano AJ, Shadowen HM, Cody KR, Thompson JA, et al. Neuronal integrity and complement control synaptic material clearance by microglia after CNS injury. J Exp Med. 2018;215:1789–801. · DOI · Paper page
  54. Frühbeis C, Fröhlich D, Kuo WP, Krämer-Albers E-M. Extracellular vesicles as mediators of neuron-glia communication. Front Cell Neurosci. 2013;7:182. · DOI
  55. Antonucci F, Turola E, Riganti L, Caleo M, Gabrielli M, Perrotta C, et al. Microvesicles released from microglia stimulate synaptic activity via enhanced sphingolipid metabolism. EMBO J. 2012;31:1231–40. · DOI · Paper page
  56. Mueller AC, Sun D, Dutta A. The miR-99 family regulates the DNA damage response through its target SNF2H. Oncogene. 2013;32:1164–72. · DOI
  57. Ye X, Luo H, Chen Y, Wu Q, Xiong Y, Zhu J, et al. MicroRNAs 99b–5p/100-5p regulated by endoplasmic reticulum stress are involved in abeta-induced pathologies. Front Aging Neurosci. 2015;7:210. · DOI
  58. Gao H, Yu Z, Li Y, Wang X. miR-100-5p in human umbilical cord mesenchymal stem cell-derived exosomes mediates eosinophilic inflammation to alleviate atherosclerosis via the FZD5/Wnt/β-catenin pathway. Acta Biochim Biophys Sin (Shanghai). 2021;53:1166–76. · DOI
  59. Li N, Gao Z, Zhao L, Du B, Ma B, Nian H, et al. MSC-derived small extracellular vesicles attenuate autoimmune dacryoadenitis by promoting M2 macrophage polarization and inducing tregs via miR-100-5p. Front Immunol. 2022;13: 888949. · DOI
  60. Luo P, Jiang C, Ji P, Wang M, Xu J. Exosomes of stem cells from human exfoliated deciduous teeth as an anti-inflammatory agent in temporomandibular joint chondrocytes via miR-100-5p/mTOR. Stem Cell Res Ther. 2019;10:216. · DOI
  61. Li K, Yan G, Huang H, Zheng M, Ma K, Cui X, et al. Anti-inflammatory and immunomodulatory effects of the extracellular vesicles derived from human umbilical cord mesenchymal stem cells on osteoarthritis via M2 macrophages. J Nanobiotechnology. 2022;20:38. · DOI
  62. Otero-Ortega L, Alonso-López E, Pérez-Mato M, Laso-García F, Gómez-de Frutos MC, Diekhorst L, et al. Circulating extracellular vesicle proteins and microrna profiles in subcortical and cortical-subcortical ischaemic stroke. Biomedicines. 2021;9:786. · DOI
  63. Heil F, Hemmi H, Hochrein H, Ampenberger F, Kirschning C, Akira S, et al. Species-specific recognition of single-stranded RNA via toll-like receptor 7 and 8. Science. 2004;303:1526–9. · DOI · Paper page
  64. Wang S, Yang Y, Suen A, Zhu J, Williams B, Hu J, et al. Role of extracellular microRNA-146a-5p in host innate immunity and bacterial sepsis. Iscience. 2021;24:103441. · DOI
  65. Fabbri M, Paone A, Calore F, Galli R, Gaudio E, Santhanam R, et al. MicroRNAs bind to Toll-like receptors to induce prometastatic inflammatory response. Proc Natl Acad Sci U S A. 2012;109:E2110-2116. · DOI · Paper page
  66. Liu H-Y, Hong Y-F, Huang C-M, Chen C-Y, Huang T-N, Hsueh Y-P. TLR7 negatively regulates dendrite outgrowth through the Myd88-c-Fos-IL-6 pathway. J Neurosci. 2013;33:11479–93. · DOI · Paper page
  67. Sun S, Rao NL, Venable J, Thurmond R, Karlsson L. TLR7/9 antagonists as therapeutics for immune-mediated inflammatory disorders. Inflamm Allergy Drug Targets. 2007;6:223–35. · DOI
  68. Dixit V, Mak TW. NF-kappaB signaling Many roads lead to madrid. Cell. 2002;111:615–9. · DOI
  69. Tang J, Cheng X, Yi S, Zhang Y, Tang Z, Zhong Y, et al. Euphorbia factor L2 ameliorates the progression of K/BxN serum-induced arthritis by blocking TLR7 mediated IRAK4/IKKβ/IRF5 and NF-kB signaling pathways. Front Pharmacol. 2021;12: 773592. · DOI
  70. Wang J, Zhang J, Ye Y, Xu Q, Li Y, Feng S, et al. Peripheral organ injury after stroke. Front Immunol. 2022;13: 901209. · DOI
  71. Kerr N, de Rivero Vaccari JP, Dietrich WD, Keane RW. Neural-respiratory inflammasome axis in traumatic brain injury. Exp Neurol. 2020;323: 113080. · DOI
  72. Kerr NA, de Rivero Vaccari JP, Abbassi S, Kaur H, Zambrano R, Wu S, et al. Traumatic brain injury-induced acute lung injury: evidence for activation and inhibition of a neural-respiratory-inflammasome axis. J Neurotrauma. 2018;35:2067–76. · DOI
  73. Xu Q, Ye Y, Wang Z, Zhu H, Li Y, Wang J, et al. NLRP3 knockout protects against lung injury induced by cerebral ischemia-reperfusion. Oxid Med Cell Longev. 2022;2022:6260102.

Cited by

Sorted by citations

See all 23

Metadata

Authors
Xin, D., Li, T., Zhao, Y., Guo, X., Gai, C., Jiang, Z., Yu, S., Cheng, J., Song, Y., Cheng, Y., Luo, Q., Gu, B., Liu, D., & Wang, Z.
Venue
Journal of Nanobiotechnology
Published
2024-09-03
Volume
22
Issue
1
ISSN
1477-3155
Cited by
23
References
5
Language
en
Funders
National Natural Science Foundation of China (82271327)

About these checks

Registry, retraction, Cites and statistics results are computed, not judged, with one exception: a printed reference that no index lists is read once by a model before it counts as a citation error. Claims are extracted by a model and kept only when their quote appears verbatim in the text; each cited source is then checked, with a model’s help, for whether it says what the claim relies on. Those verdicts can be wrong — read the claim’s quote and the cited source before relying on one.

Statistics and arithmetic are recomputed, not judged.

Confidence bands are shown only for fields calibrated on our annotated test set. None is calibrated yet, so no band is shown.

What counts as a claim ›How we measure confidence ›How we check this ›

Are you an author, or do you see a problem with this page? Request a review