Student or educator? Sign up with your school email and get 6 months of Pro free.
Cited by 54

The DOI matches its Crossref record; 66 of the 66 references it cites were found in a registry or an index.

The combination of CXCL9, CXCL10 and CXCL11 levels during primary HIV infection predicts HIV disease progression

Yin, Xiaowan, Wang, Zhuo, Wu, Tong, Ma, Meichen, Zhang, Zining, Chu, Zhenxing, Hu, Qinghai, Ding, Haibo, Han, Xiaoxu, Xu, Junjie, Shang, Hong, Jiang, Yongjun·2019·Journal of Translational Medicine

Abstract

Background: Chemokines are small chemotactic cytokines involved in inflammation, cell migration, and immune regulation in both physiological and pathological contexts. Here, we investigated the profile of chemokines during primary HIV infection (PHI). Methods: Fifty-four participants with blood samples before and during HIV infection and clinical information available were selected from an HIV-negative man who have sex with men (MSM) prospective cohort. Thirty chemokines and 10 cytokines were measured pre- and post-HIV infection in the same individuals using a Bio-Plex Pro™ Human Chemokine Panel. Results: Levels of 18 chemokines/cytokines changed significantly during PHI relative to pre-HIV infection levels; 14 were up-regulated and 4 down-regulated. Among them, CXCL9, CXCL10, and CXCL11 were the most prominently raised. Levels of CXCL9 and CXCL10 were much higher in the high-set point group (log viral load (lgVL) ≥ 4.5) than those in the low-set point group (lgVL < 4.5) and levels of CXCL9, CXCL10, and CXCL11 were higher in the low-CD4 + T-cell count group (CD4 + T-cell count ≥ 500). A formula to predict HIV disease progression using a combination panel comprising CXCL9, CXCL10, and CXCL11 was developed, where risk score = 0.007 × CXCL9 + 0.004 × CXCL10 − 0.033 × CXCL11 − 1.724, with risk score values higher than the cutoff threshold (0.5211) indicating more rapid HIV disease progression. Conclusions: A panel of plasma CXCL9, CXCL10, and CXCL11 measured during primary HIV-1 infection could predict long-term HIV disease prognosis in an MSM group and has potential as a novel biomarker in the clinic.

Overview

The claims and statistics of this paper haven’t been checked yet.

Run the check — free, no account needed. It reads the open-access text and checks the sources it cites.

A few free checks a day · papers already verified open instantly · results are public

Integrity signals

Registry

Crossref · 10.1186/s12967-019-02172-3

Cites

66 of 66 references verified0 citation errors · 0 not checkable

Statistics

Figures

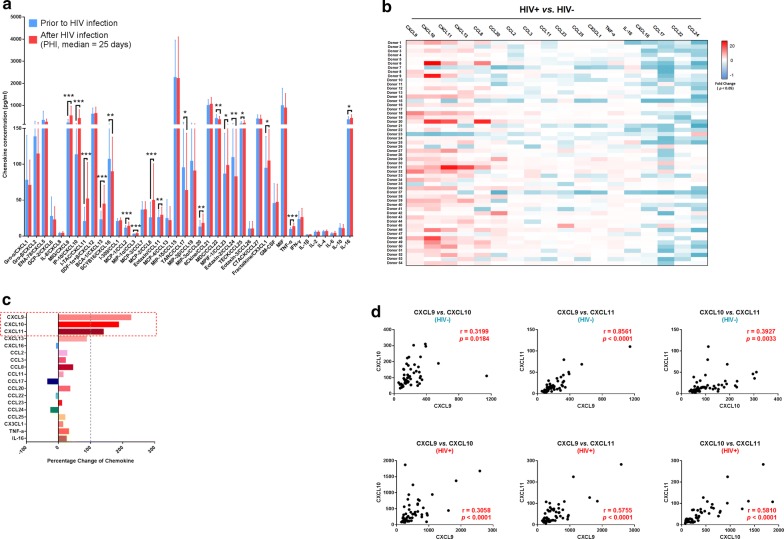
Fig. 1 Alterations in the levels of 40 plasma chemokines/cytokines pre- and post-HIV infection. a Comparison of the levels of 40 chemokines/cytokines pre- and post-HIV infection in the same individuals (n = 54). Graphs represent median ± interquartile range. The nonparametric Wilcoxon matched pairs test was used for evaluation of the significance of differences between groups. b Heat map showing the fold-change values of 18 chemokines/cytokines with levels significantly changed in each individual during HIV infection. White, non-significant fold-change in chemokine/cytokine levels between the two time points (HIV− and HIV+). Blue and red, significantly decreased or increased fold-change in chemokine/cytokine levels between the two time points (HIV− and HIV+), respectively. The darker and more saturated the color, the greater the extent of the fold-change. c Percentage change in the 18 chemokines/cytokines with significantly altered levels: CXCL9, CXCL10, CXCL11, CXCL13, CXCL16, CCL2, CCL3, CCL8, CCL11, CCL17, CCL20, CCL22, CCL23, CCL24, CCL25, CX3CL1, TNF-α, and IL-16. d Correlation analysis of plasma CXCL9, CXCL10, and CXCL11 levels in HIV− and HIV+ samples. Pearson’s correlation coefficient values between chemokines are shown. *p < 0.05, **p < 0.01, ***p < 0.001, ****p < 0.0001
Fig. 1 Alterations in the levels of 40 plasma chemokines/cytokines pre- and post-HIV infection. a Comparison of the levels of 40 chemokines/cytokines pre- and post-HIV infection in the same individuals (n = 54). Graphs represent median ± interquartile range. The nonparametric Wilcoxon matched pairs test was used for evaluation of the significance of differences between groups. b Heat map showing the fold-change values of 18 chemokines/cytokines with levels significantly changed in each individual during HIV infection. White, non-significant fold-change in chemokine/cytokine levels between the two time points (HIV− and HIV+). Blue and red, significantly decreased or increased fold-change in chemokine/cytokine levels between the two time points (HIV− and HIV+), respectively. The darker and more saturated the color, the greater the extent of the fold-change. c Percentage change in the 18 chemokines/cytokines with significantly altered levels: CXCL9, CXCL10, CXCL11, CXCL13, CXCL16, CCL2, CCL3, CCL8, CCL11, CCL17, CCL20, CCL22, CCL23, CCL24, CCL25, CX3CL1, TNF-α, and IL-16. d Correlation analysis of plasma CXCL9, CXCL10, and CXCL11 levels in HIV− and HIV+ samples. Pearson’s correlation coefficient values between chemokines are shown. *p < 0.05, **p < 0.01, ***p < 0.001, ****p < 0.0001CC BY · PubMed Central
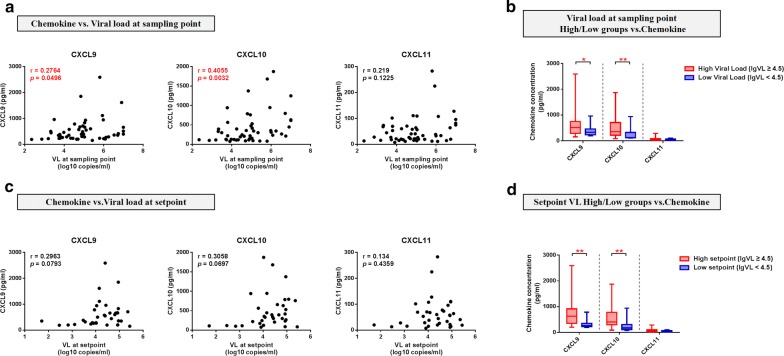
Fig. 2 Plasma CXCL9, CXCL10, and CXCL11 levels during PHI were correlated with viral load. a Analysis of correlations between plasma CXCL9 (r = 0.2764, p = 0.0496), CXCL10 (r = 0.4055, p = 0.0032), and CXCL11 (r = 0.219, p = 0.1225) levels in HIV+ samples and VL at the same sampling point (n = 51). b Comparisons of CXCL9, CXCL10, and CXCL11 levels between VL-high (n = 33) and VL-low (n = 18) groups at the sampling point (CXCL9, p = 0.0381; CXCL10, p = 0.0079; CXCL11, p = 0.1161). c Analysis of the correlations between plasma CXCL9 (r = 0.2963, p = 0.0793), CXCL10 (r = 0.3058, p = 0.0697), and CXCL11 (r = 0.134, p = 0.4359) levels at the HIV+ point and VL at set-point (n = 35). d Comparisons of CXCL9, CXCL10, and CXCL11 levels between the VL-high (n = 24) and VL-low (n = 11) groups at set-point (CXCL9, p = 0.0035; CXCL10, p = 0.0052; CXCL11, p = 0.0896). Spearman correlation analysis was used to estimate the level of correlation. A nonparametric Mann–Whitney U test was used to compare between-group distributions; *p < 0.05, **p < 0.01, ***p < 0.001, ****p < 0.0001
Fig. 2 Plasma CXCL9, CXCL10, and CXCL11 levels during PHI were correlated with viral load. a Analysis of correlations between plasma CXCL9 (r = 0.2764, p = 0.0496), CXCL10 (r = 0.4055, p = 0.0032), and CXCL11 (r = 0.219, p = 0.1225) levels in HIV+ samples and VL at the same sampling point (n = 51). b Comparisons of CXCL9, CXCL10, and CXCL11 levels between VL-high (n = 33) and VL-low (n = 18) groups at the sampling point (CXCL9, p = 0.0381; CXCL10, p = 0.0079; CXCL11, p = 0.1161). c Analysis of the correlations between plasma CXCL9 (r = 0.2963, p = 0.0793), CXCL10 (r = 0.3058, p = 0.0697), and CXCL11 (r = 0.134, p = 0.4359) levels at the HIV+ point and VL at set-point (n = 35). d Comparisons of CXCL9, CXCL10, and CXCL11 levels between the VL-high (n = 24) and VL-low (n = 11) groups at set-point (CXCL9, p = 0.0035; CXCL10, p = 0.0052; CXCL11, p = 0.0896). Spearman correlation analysis was used to estimate the level of correlation. A nonparametric Mann–Whitney U test was used to compare between-group distributions; *p < 0.05, **p < 0.01, ***p < 0.001, ****p < 0.0001CC BY · PubMed Central
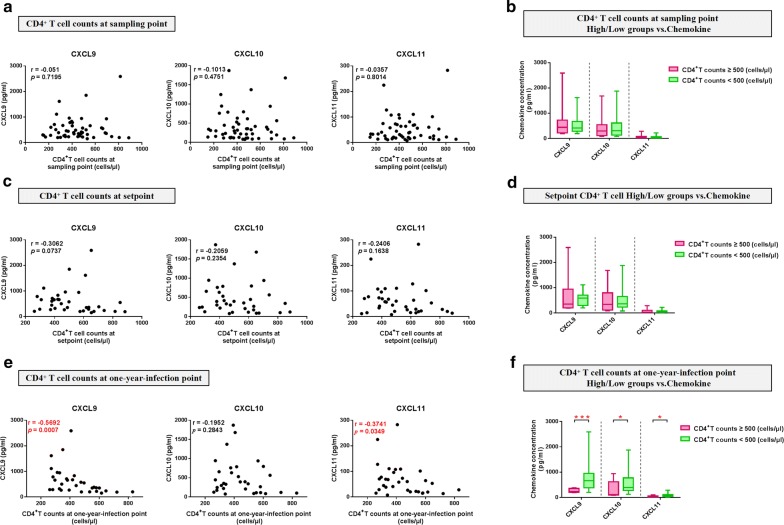
Fig. 3 Plasma CXCL9, CXCL10 and CXCL11 levels during PHI are correlated with CD4+ T-cell counts. a Analysis of correlations between plasma CXCL9 (r = − 0.051, p = 0.7195), CXCL10 (r = − 0.1013, p = 0.4751), and CXCL11 (r = -0.0357, p = 0.8014) levels at the HIV+ point and CD4+ T-cell count at the same sampling point (n = 52). b Comparisons of CXCL9, CXCL10, and CXCL11 levels between the CD4+-high (n = 16) and CD4+-low (n = 36) groups at the sampling point (CXCL9, p = 0.9448; CXCL10, p = 0.7407; CXCL11, p = 0.9893). c Analysis of the correlations between plasma CXCL9 (r = − 0.3062, p = 0.0737), CXCL10 (r = − 0.2059, p = 0.2354), and CXCL11 (r = − 0.2406, p = 0.1638) levels at the HIV+ point and CD4+ T-cell count at set-point (n = 35). d Comparisons of CXCL9, CXCL10, and CXCL11 levels between the CD4+-high (n = 16) and CD4+-low (n = 19) groups at set-point (CXCL9, p = 0.1662; CXCL10, p = 0.5256; CXCL11, p = 0.3317). e Analysis of the correlations between plasma CXCL9 (r = − 0.5692, p = 0.0007), CXCL10 (r = -0.1952, p = 0.2843), and CXCL11 (r = − 0.3741, p = 0.0349) levels at the HIV+ point and CD4+ T-cell count at 1-year-infection (n = 32). f Comparisons of CXCL9, CXCL10, and CXCL11 levels between the CD4+-high (n = 10) and CD4+-low (n = 22) groups at 1-year-infection (CXCL9, p = 0.0008; CXCL10, p = 0.0242; CXCL11, p = 0.0106)
Fig. 3 Plasma CXCL9, CXCL10 and CXCL11 levels during PHI are correlated with CD4+ T-cell counts. a Analysis of correlations between plasma CXCL9 (r = − 0.051, p = 0.7195), CXCL10 (r = − 0.1013, p = 0.4751), and CXCL11 (r = -0.0357, p = 0.8014) levels at the HIV+ point and CD4+ T-cell count at the same sampling point (n = 52). b Comparisons of CXCL9, CXCL10, and CXCL11 levels between the CD4+-high (n = 16) and CD4+-low (n = 36) groups at the sampling point (CXCL9, p = 0.9448; CXCL10, p = 0.7407; CXCL11, p = 0.9893). c Analysis of the correlations between plasma CXCL9 (r = − 0.3062, p = 0.0737), CXCL10 (r = − 0.2059, p = 0.2354), and CXCL11 (r = − 0.2406, p = 0.1638) levels at the HIV+ point and CD4+ T-cell count at set-point (n = 35). d Comparisons of CXCL9, CXCL10, and CXCL11 levels between the CD4+-high (n = 16) and CD4+-low (n = 19) groups at set-point (CXCL9, p = 0.1662; CXCL10, p = 0.5256; CXCL11, p = 0.3317). e Analysis of the correlations between plasma CXCL9 (r = − 0.5692, p = 0.0007), CXCL10 (r = -0.1952, p = 0.2843), and CXCL11 (r = − 0.3741, p = 0.0349) levels at the HIV+ point and CD4+ T-cell count at 1-year-infection (n = 32). f Comparisons of CXCL9, CXCL10, and CXCL11 levels between the CD4+-high (n = 10) and CD4+-low (n = 22) groups at 1-year-infection (CXCL9, p = 0.0008; CXCL10, p = 0.0242; CXCL11, p = 0.0106)CC BY · PubMed Central
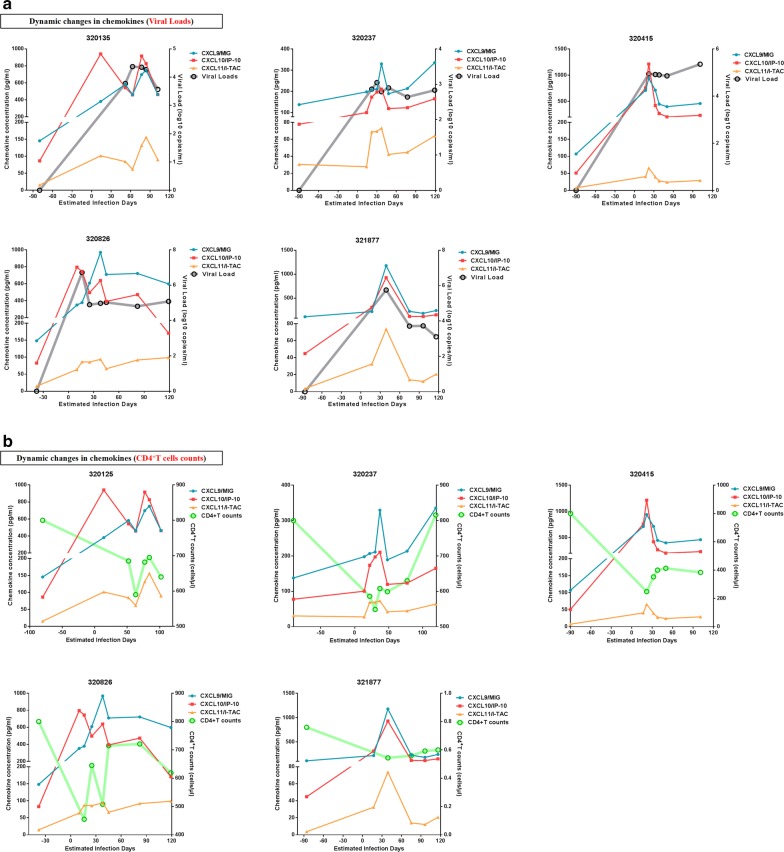
Fig. 4 Dynamic changes in plasma CXCL9, CXCL10, and CXCL11 levels during PHI. a Dynamic changes in plasma CXCL9, CXCL10, CXCL11, and viral load during PHI in five participants. Blue, red, yellow, and gray lines represent CXCL9, CXCL10, CXCL11, and viral load, respectively. b Dynamic changes in plasma CXCL9, CXCL10, CXCL11, and CD4+ T-cell count during PHI in five participants. Blue, red, yellow, and green lines represent CXCL9, CXCL10, CXCL11, and CD4+ T-cell count, respectively
Fig. 4 Dynamic changes in plasma CXCL9, CXCL10, and CXCL11 levels during PHI. a Dynamic changes in plasma CXCL9, CXCL10, CXCL11, and viral load during PHI in five participants. Blue, red, yellow, and gray lines represent CXCL9, CXCL10, CXCL11, and viral load, respectively. b Dynamic changes in plasma CXCL9, CXCL10, CXCL11, and CD4+ T-cell count during PHI in five participants. Blue, red, yellow, and green lines represent CXCL9, CXCL10, CXCL11, and CD4+ T-cell count, respectivelyCC BY · PubMed Central
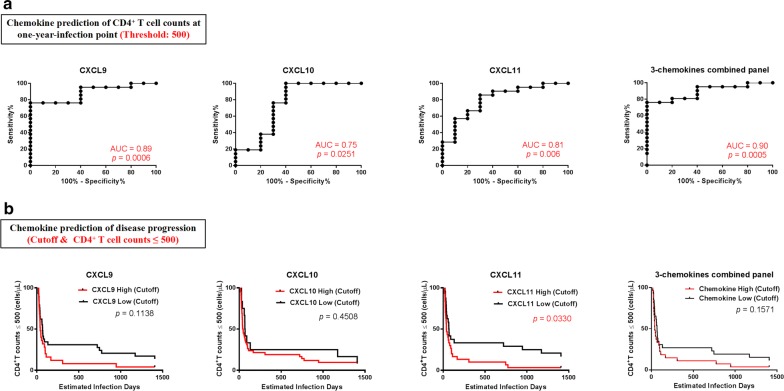
Fig. 5 Value of CXCL9, CXCL10, and CXCL11 levels for predicting HIV CD4+ T-cell count. a ROC curves for CXCL9, CXCL10, CXCL11, and a combination panel of three chemokines, in predicting CD4+ T-cell count at 1-year-infection. AUC values were used to evaluate CD4+ T-cell count at 1-year-infection and the point with the maximum sum of sensitivity plus specificity was defined as the cutoff value. b Kaplan–Meier curves for CXCL9, CXCL10, CXCL11, and the combination panel of three chemokines. Patients were divided into high expressers (above the cutoff value) and low expressers (below the cutoff value), according to the cutoff value for chemokine expression. CD4+ T-cell count reaching ≤ 500 cells/μL was considered as the end point for follow-up. p values for curves provided on graphs
Fig. 5 Value of CXCL9, CXCL10, and CXCL11 levels for predicting HIV CD4+ T-cell count. a ROC curves for CXCL9, CXCL10, CXCL11, and a combination panel of three chemokines, in predicting CD4+ T-cell count at 1-year-infection. AUC values were used to evaluate CD4+ T-cell count at 1-year-infection and the point with the maximum sum of sensitivity plus specificity was defined as the cutoff value. b Kaplan–Meier curves for CXCL9, CXCL10, CXCL11, and the combination panel of three chemokines. Patients were divided into high expressers (above the cutoff value) and low expressers (below the cutoff value), according to the cutoff value for chemokine expression. CD4+ T-cell count reaching ≤ 500 cells/μL was considered as the end point for follow-up. p values for curves provided on graphsCC BY · PubMed Central
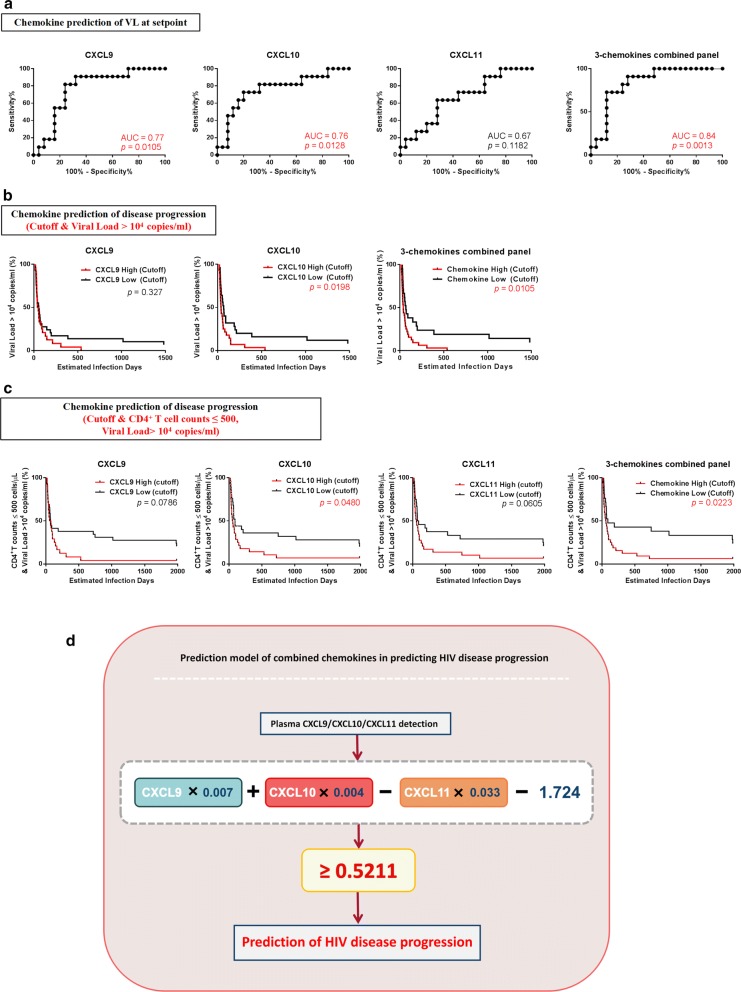
Fig. 6 Value of CXCL9, CXCL10, and CXCL11 for predicting HIV viral load and disease progression. a ROC curves for CXCL9, CXCL10, CXCL11, and the combination panel of three chemokines to evaluate their use for predicting viral load at set-point. AUC was used to evaluate viral load at set-point and the point with the maximum sum of sensitivity plus specificity was defined as the cutoff value. b Kaplan–Meier curves for CXCL9, CXCL10, CXCL11, and the combination panel of three chemokines. According to the cutoff value for chemokine expression levels, patients were divided into high expressers (above the cutoff value) and low expressers (below the cutoff value). Viral load reaching > 104 copies/mL was considered the end point of follow-up. p values for curves provided on graphs. c Kaplan–Meier curves for CXCL9, CXCL10, CXCL11, and the combination panel of three chemokines. According to the cutoff value of chemokine expression, patients were divided into high expressers (above the cutoff value) and low expressers (below the cutoff value). Viral load reaching > 104 copies/mL and CD4+ T-cell count reaching ≤ 500 cells/μL was considered the end point for follow-up. p values for curves provided on graphs. d Schematic and formula of the combined-chemokine-predictive model for HIV disease progression
Fig. 6 Value of CXCL9, CXCL10, and CXCL11 for predicting HIV viral load and disease progression. a ROC curves for CXCL9, CXCL10, CXCL11, and the combination panel of three chemokines to evaluate their use for predicting viral load at set-point. AUC was used to evaluate viral load at set-point and the point with the maximum sum of sensitivity plus specificity was defined as the cutoff value. b Kaplan–Meier curves for CXCL9, CXCL10, CXCL11, and the combination panel of three chemokines. According to the cutoff value for chemokine expression levels, patients were divided into high expressers (above the cutoff value) and low expressers (below the cutoff value). Viral load reaching > 104 copies/mL was considered the end point of follow-up. p values for curves provided on graphs. c Kaplan–Meier curves for CXCL9, CXCL10, CXCL11, and the combination panel of three chemokines. According to the cutoff value of chemokine expression, patients were divided into high expressers (above the cutoff value) and low expressers (below the cutoff value). Viral load reaching > 104 copies/mL and CD4+ T-cell count reaching ≤ 500 cells/μL was considered the end point for follow-up. p values for curves provided on graphs. d Schematic and formula of the combined-chemokine-predictive model for HIV disease progressionCC BY · PubMed Central

Verification

Claims the paper makes

The claims and statistics of this paper haven’t been checked yet.

Run the check — free, no account needed. It reads the open-access text and checks the sources it cites.

A few free checks a day · papers already verified open instantly · results are public

Claims other papers make about this one

Each is checked against this paper’s own text: does it say what the citing paper says it does?

Self-check

Percentages, sums and reported differences re-computed from the paper’s own numbers.

The self-check needs the paper’s full text.

Citations

Cites

Show all 66 references

Cited by

Metadata

Authors
Yin, X., Wang, Z., Wu, T., Ma, M., Zhang, Z., Chu, Z., Hu, Q., Ding, H., Han, X., Xu, J., Shang, H., & Jiang, Y.
Venue
Journal of Translational Medicine
Published
2019-12
Volume
17
Issue
1
ISSN
1479-5876
Cited by
54
References
66
Language
en
Licence
Funders
Mega Projects of National Science Research for the 13th Five-Year Plan (2017ZX10201101)

About these checks

Registry, retraction, Cites and statistics results are computed, not judged, with one exception: a printed reference that no index lists is read once by a model before it counts as a citation error. Claims are extracted by a model and kept only when their quote appears verbatim in the text; each cited source is then checked, with a model’s help, for whether it says what the claim relies on. Those verdicts can be wrong — read the claim’s quote and the cited source before relying on one.

Statistics and arithmetic are recomputed, not judged.

Confidence bands are shown only for fields calibrated on our annotated test set. None is calibrated yet, so no band is shown.

What counts as a claim ›How we measure confidence ›How we check this ›

Are you an author, or do you see a problem with this page? Request a review

Data sources

Bibliographic data: Semantic Scholar, OpenAlex, Crossref.

Contains information from the Semantic Scholar Academic Graph Datasets, made available under the ODC Attribution License (ODC-BY 1.0).

Semantic Scholar’s data is described in: Kinney, R., et al. (2023). The Semantic Scholar Open Data Platform. arXiv:2301.10140.