

The DOI matches its Crossref record; 468 of the 468 references it cites were found in a registry or an index.
Hypoxia and the phenomenon of immune exclusion
Open accessAbstract
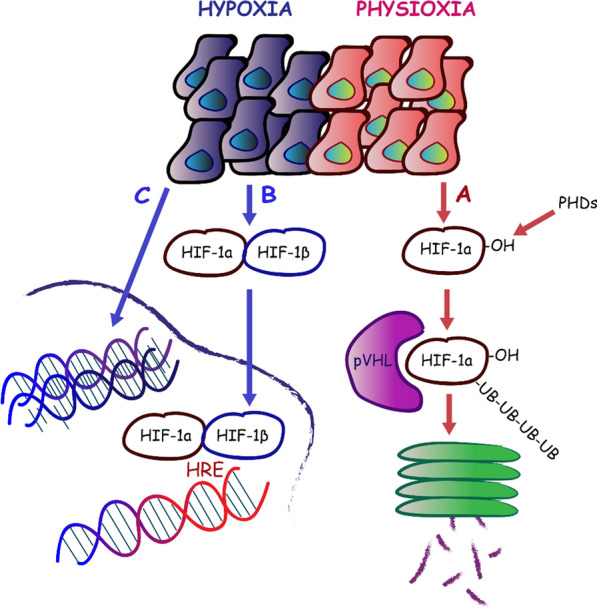
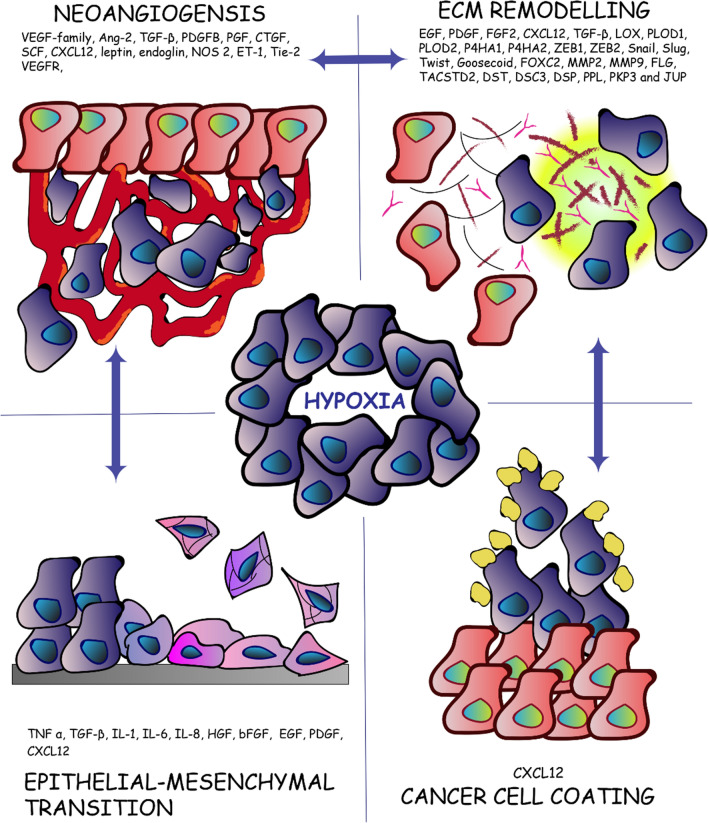
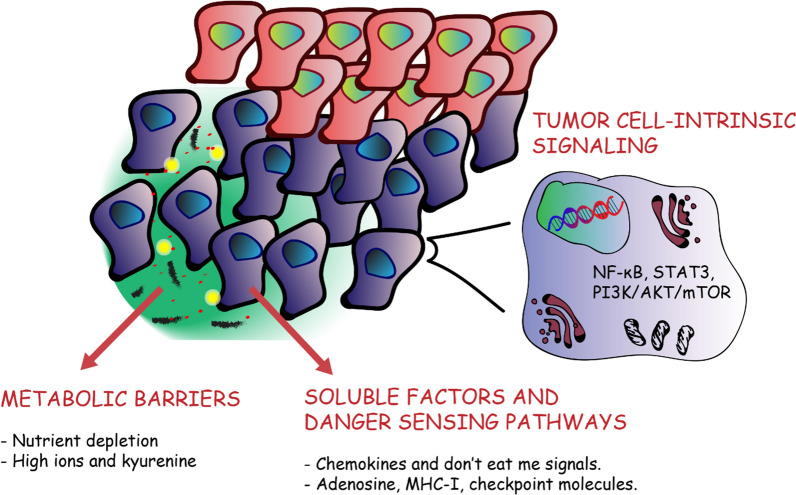
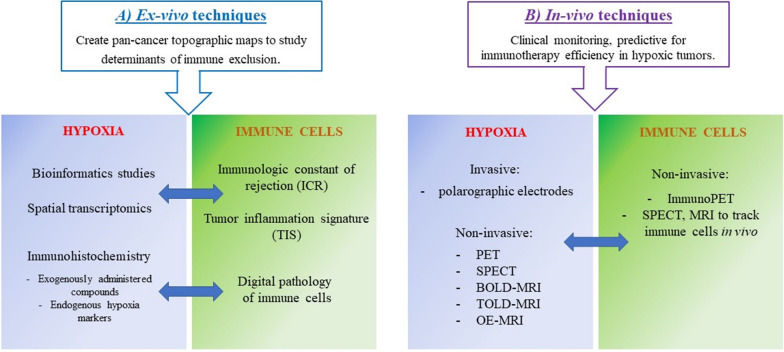
Over the last few years, cancer immunotherapy experienced tremendous developments and it is nowadays considered a promising strategy against many types of cancer. However, the exclusion of lymphocytes from the tumor nest is a common phenomenon that limits the efficiency of immunotherapy in solid tumors. Despite several mechanisms proposed during the years to explain the immune excluded phenotype, at present, there is no integrated understanding about the role played by different models of immune exclusion in human cancers. Hypoxia is a hallmark of most solid tumors and, being a multifaceted and complex condition, shapes in a unique way the tumor microenvironment, affecting gene transcription and chromatin remodeling. In this review, we speculate about an upstream role for hypoxia as a common biological determinant of immune exclusion in solid tumors. We also discuss the current state of ex vivo and in vivo imaging of hypoxic determinants in relation to T cell distribution that could mechanisms of immune exclusion and discover functional-morphological tumor features that could support clinical monitoring.
Overview
The claims and statistics of this paper haven’t been checked yet.
Run the check — free, no account needed. It reads the open-access text and checks the sources it cites.
Integrity signals
Registry
Cites
Statistics
Figures
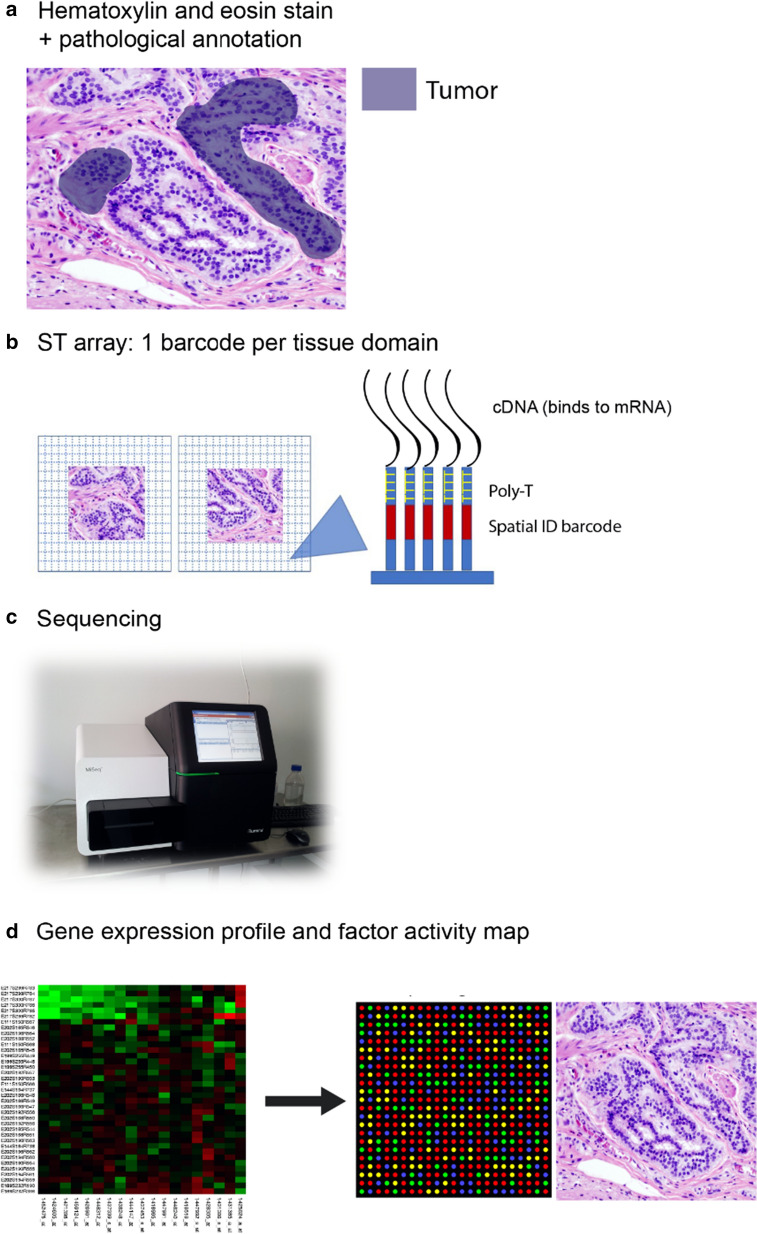
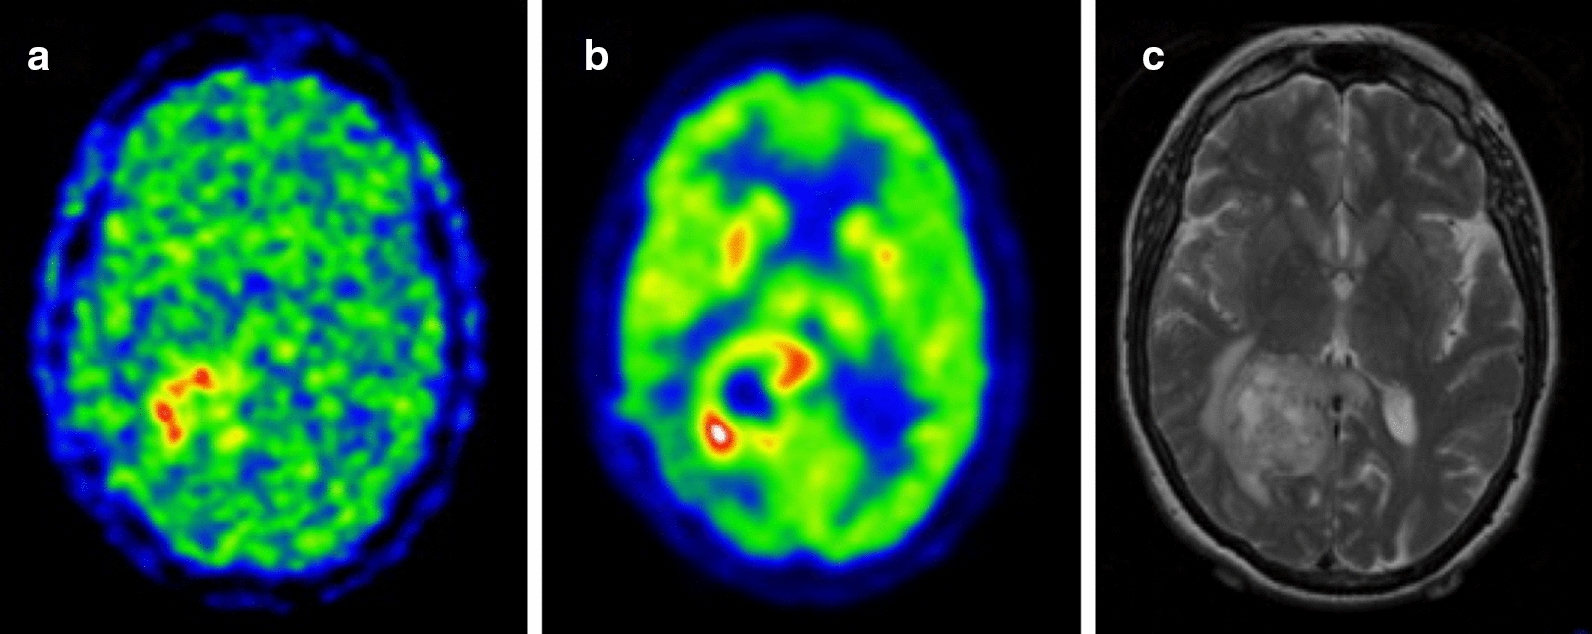
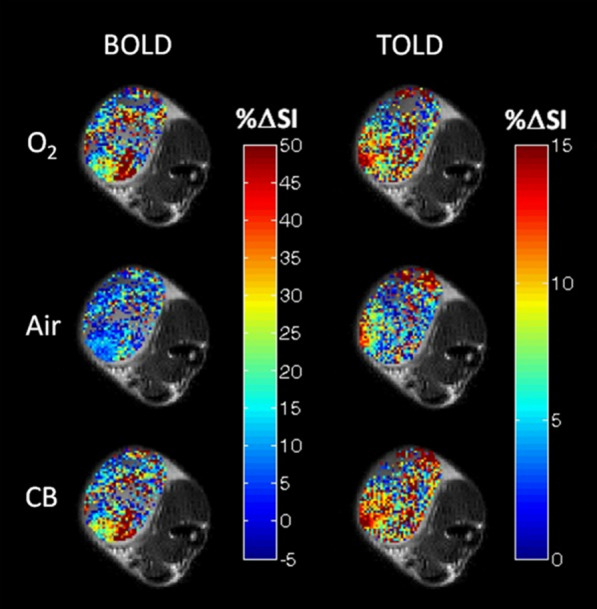
Verification
Claims the paper makes
The claims and statistics of this paper haven’t been checked yet.
Run the check — free, no account needed. It reads the open-access text and checks the sources it cites.
Claims other papers make about this one
Each is checked against this paper’s own text: does it say what the citing paper says it does?
In the citing paper
“Hypoxia is a hallmark of most solid tumors and a common trait of TME that is associated with cancer progression and metastasis8–10.”
In the citing paper
“clinical studies have consistently demonstrated that hypoxia is associated with immune exclusion and resistance to immune checkpoint blockade therapy10,20,21,51.”
Self-check
Percentages, sums and reported differences re-computed from the paper’s own numbers.
The self-check needs the paper’s full text.
Citations
Cites
2 retracted
RETRACTED: Collagen Prolyl Hydroxylases Are Essential for Breast Cancer Metastasis
Gilkes, D. M., Chaturvedi, P., Bajpai, S., Wong, C. C., Wei, H., Pitcairn, S., Hubbi, M. E., Wirtz, D., & Semenza, G. L. (2013) · Cancer Research · doi:10.1158/0008-5472.can-12-3963 · Cited by 296
RetractedProcollagen lysyl hydroxylase 2 is essential for hypoxia-induced breast cancer metastasis
Gilkes, D. M., Bajpai, S., Wong, C. C., Chaturvedi, P., Hubbi, M. E., Wirtz, D., & Semenza, G. L. (2013) · Molecular Cancer Research · doi:10.1158/1541-7786.mcr-12-0629 · Cited by 252
RetractedPD-1 and PD-L1 Immune Checkpoint Blockade to Treat Breast Cancer
Hartkopf, A. D., Taran, F., Wallwiener, M., Walter, C. B., Krämer, B., Grischke, E., & Brucker, S. Y. (2016) · Breast Care · doi:10.1159/000453569 · Cited by 30,989
Improved Survival with Ipilimumab in Patients with Metastatic Melanoma
Hodi, F. S., O'Day, S. J., McDermott, D. F., Weber, R. W., Sosman, J. A., Haanen, J. B., Gonzalez, R., Robert, C., Schadendorf, D., Hassel, J. C., et al. (2010) · New England Journal of Medicine · doi:10.1056/nejmoa1003466 · Cited by 15,155
Safety and activity of anti-PD-L1 antibody in patients with advanced cancer
Brahmer, J. R., Tykodi, S. S., Chow, L. Q. M., Hwu, W.-J., Topalian, S. L., Hwu, P., Drake, C. G., Camacho, L. H., Kauh, J., Odunsi, K., et al. (2012) · New England Journal of Medicine · doi:10.1056/nejmoa1200694 · Cited by 7,945
Mutational landscape determines sensitivity to PD-1 blockade in non–small cell lung cancer
Rizvi, N. A., Hellmann, M. D., Snyder, A., Kvistborg, P., Makarov, V., Havel, J. J., Lee, W., Yuan, J., Wong, P., Ho, T. S., et al. (2015) · Science · doi:10.1126/science.aaa1348 · Cited by 7,802
Molecular Mechanisms of Stress-Responsive Changes in Collagen and Elastin Networks in Skin
Aziz, J., Shezali, H., Radzi, Z., Yahya, N. A., Abu Kassim, N. H., Czernuszka, J., & Rahman, M. T. (2016) · Skin Pharmacology and Physiology · doi:10.1159/000447017 · Cited by 7,323
Mismatch repair deficiency predicts response of solid tumors to PD-1 blockade
Le, D. T., Durham, J. N., Smith, K. N., Wang, H., Bartlett, B. R., Aulakh, L. K., Lu, S., Kemberling, H., Wilt, C., Luber, B. S., et al. (2017) · Science · doi:10.1126/science.aan6733 · Cited by 6,645
Type, Density, and Location of Immune Cells Within Human Colorectal Tumors Predict Clinical Outcome
Galon, J., Costes, A., Sanchez-Cabo, F., Kirilovsky, A., Mlecnik, B., Lagorce-Pagès, C., Tosolini, M., Camus, M., Berger, A., Wind, P., et al. (2006) · Science · doi:10.1126/science.1129139 · Cited by 6,516
Wang, G. L., Jiang, B. H., Rue, E. A., & Semenza, G. L. (1995) · Proceedings of the National Academy of Sciences · doi:10.1073/pnas.92.12.5510 · Cited by 6,212
Research works printed but not linked: 2
- Wang Z, et al. Transglutaminase-2 of pancreatic cancer cells assembles a CXCL12-keratin 19-coat that mediates the resistance to immunotherapy. bioRxiv, 2019;2:776419.
- Zhang Z, et al. PI3K/Akt and HIF1 signaling pathway in hypoxiaischemia (Review). Mol Med Rep. 2018;18(4):3547–54.
Cited by
Sorted by citations
Hypoxia as a driver of resistance to immunotherapy
Kopecka, J., Salaroglio, I. C., Pérez-Ruiz, E., Sarmento‐Ribeiro, A. B., Saponara, S., Rivas, J. D. L., & Riganti, C. (2021) · Drug Resistance Updates · doi:10.1016/j.drup.2021.100787 · Cited by 264
Ma, S., Zhao, Y., Lee, W. C., Ong, L.-T., Lee, P. L., Jiang, Z., Oguz, G., Niu, Z., Liu, M., Goh, J. Y., et al. (2022) · Nature Communications · doi:10.1038/s41467-022-31764-9 · Cited by 200
Hypoxia: The Cornerstone of Glioblastoma
Doménech, M., Hernández, A., Plaja, A., Martinez‐Balibrea, E., & Balañá, C. (2021) · International Journal of Molecular Sciences · doi:10.3390/ijms222212608 · Cited by 187
Role of hypoxia in the tumor microenvironment and targeted therapy
Chen, G., Wu, K., Li, H., Xia, D., & He, T. (2022) · Frontiers in Oncology · doi:10.3389/fonc.2022.961637 · Cited by 148
Fu, Z., Mowday, A. M., Smaill, J. B., Hermans, I. F., & Patterson, A. V. (2021) · Cells · doi:10.3390/cells10051006 · Cited by 133
Metadata
- Authors
- Pietrobon, V., & Marincola, F. M.
- Affiliations
- Refuge Biotechnologies (United States) (US)
- Corresponding author
- Pietrobon, Violena
- Venue
- Journal of Translational Medicine
- Published
- 2021-01-06
- Volume
- 19
- Issue
- 1
- Pages
- 9-9
- ISSN
- 1479-5876 (ISSN-L)
- PMC
- PMC7788724
- OpenAlex
- W3120650952
- Cited by
- 119
- References
- 467
- Citations by year
- 2026: 21 · 2025: 17 · 2024: 23 · 2023: 22 · 2022: 23 · 2021: 13
- FWCI
- 2.45
- Type
- journal article
- Language
- en
- Open access
- gold
- doi.org
- Locations
- Journal of Translational Medicine (publishedVersion, cc-by)
- Europe PMC (PubMed Central) (publishedVersion, other-oa)
- PubMed Central (publishedVersion, cc-by)
- PubMed (publishedVersion)
- DOAJ (DOAJ: Directory of Open Access Journals) (submittedVersion, cc-by-sa)
- Topics
- Health Sciences › Medicine › Oncology › Cancer Immunotherapy and Biomarkers
- Life Sciences › Biochemistry, Genetics and Molecular Biology › Cancer Research › Cancer, Hypoxia, and Metabolism
- Life Sciences › Immunology and Microbiology › Immunology › Immune cells in cancer
- Keywords
- tumor hypoxia, immune exclusion, solid tumors, tumor microenvironment, cancer immunotherapy, T cell distribution, chromatin remodeling, gene transcription, hypoxia imaging
- MeSH terms
- Hypoxia, Humans, Immunotherapy, Neoplasms, T-Lymphocytes, Cell Hypoxia, Tumor Microenvironment
About these checks
Registry, retraction, Cites and statistics results are computed, not judged, with one exception: a printed reference that no index lists is read once by a model before it counts as a citation error. Claims are extracted by a model and kept only when their quote appears verbatim in the text; each cited source is then checked, with a model’s help, for whether it says what the claim relies on. Those verdicts can be wrong — read the claim’s quote and the cited source before relying on one.
Statistics and arithmetic are recomputed, not judged.
Confidence bands are shown only for fields calibrated on our annotated test set. None is calibrated yet, so no band is shown.
What counts as a claim ›How we measure confidence ›How we check this ›
Are you an author, or do you see a problem with this page? Request a review
