Student or educator? Sign up with your school email and get 6 months of Pro free.
Cited by 80

The DOI matches its Crossref record; 76 of the 76 references it cites were found in a registry or an index.

Mesenchymal stem cells alleviate the early brain injury of subarachnoid hemorrhage partly by suppression of Notch1-dependent neuroinflammation: involvement of Botch

Liu, Wenchao, Li, Ran, Yin, Jian, Guo, Shenquan, Chen, Yunchang, Fan, Haiyan, Li, Gancheng, Li, Zhenjun, Li, Xifeng, Zhang, Xin, He, Xuying, Duan, Chuanzhi·2019·Journal of Neuroinflammation

Abstract

BACKGROUND: Activated microglia-mediated neuroinflammation has been regarded as an underlying key player in the pathogenesis of subarachnoid hemorrhage (SAH)-induced early brain injury (EBI). The therapeutic potential of bone marrow mesenchymal stem cells (BMSCs) transplantation has been demonstrated in several brain injury models and is thought to involve modulation of the inflammatory response. The present study investigated the salutary effects of BMSCs on EBI after SAH and the potential mechanism mediated by Notch1 signaling pathway inhibition. METHODS: cells) were transplanted intravenously into rats, and N-[N-(3,5-difluorophenacetyl-L-alanyl)]-S-phenylglycine t-butyl ester (DAPT), a Notch1 activation inhibitor, and Notch1 small interfering RNA (siRNA) were injected intracerebroventricularly. The effects of BMSCs on EBI were assayed by neurological score, brain water content (BWC), blood-brain barrier (BBB) permeability, magnetic resonance imaging, hematoxylin and eosin staining, and Fluoro-Jade C staining. Immunofluorescence and immunohistochemistry staining, Western blotting, and quantitative real-time polymerase chain reaction were used to analyze various proteins and transcript levels. Pro-inflammatory cytokines were measured by enzyme-linked immunosorbent assay. RESULTS: BMSCs treatment mitigated the neurobehavioral dysfunction, BWC and BBB disruption associated with EBI after SAH, reduced ionized calcium binding adapter molecule 1 and cluster of differentiation 68 staining and interleukin (IL)-1 beta, IL-6 and tumor necrosis factor alpha expression in the left hemisphere but concurrently increased IL-10 expression. DAPT or Notch1 siRNA administration reduced Notch1 signaling pathway activation following SAH, ameliorated neurobehavioral impairments, and BBB disruption; increased BWC and neuronal degeneration; and inhibited activation of microglia and production of pro-inflammatory factors. The augmentation of Notch1 signal pathway agents and phosphorylation of nuclear factor-κB after SAH were suppressed by BMSCs but the levels of Botch were upregulated in the ipsilateral hemisphere. Botch knockdown in BMSCs abrogated the protective effects of BMSCs treatment on EBI and the suppressive effects of BMSCs on Notch1 expression. CONCLUSIONS: BMSCs treatment alleviated neurobehavioral impairments and the inflammatory response in EBI after SAH; these effects may be attributed to Botch upregulation in brain tissue, which subsequently inhibited the Notch1 signaling pathway.

Overview

The claims and statistics of this paper haven’t been checked yet.

Run the check — free, no account needed. It reads the open-access text and checks the sources it cites.

A few free checks a day · papers already verified open instantly · results are public

Integrity signals

Registry

Crossref · 10.1186/s12974-019-1396-5

Cites

76 of 76 references verified0 citation errors · 0 not checkable

Statistics

Figures

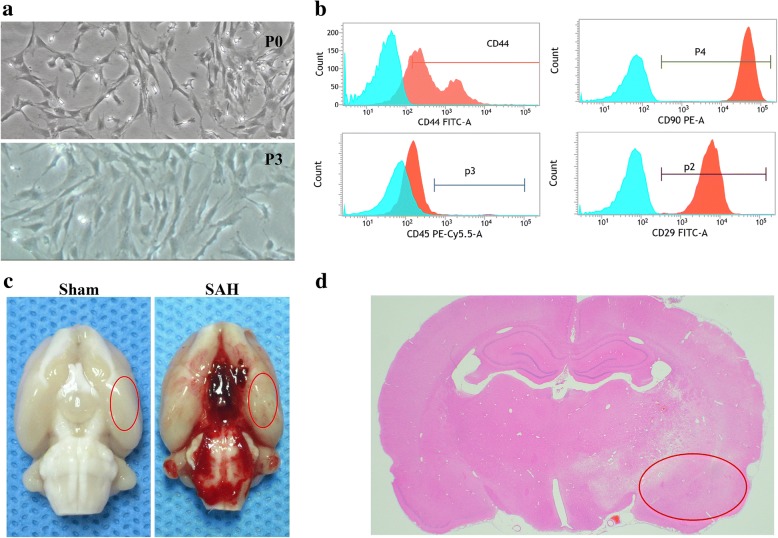
Fig. 1 Identification of rat BMSCs and representative image of subarachnoid hemorrhage (SAH) model. Representative micrographs of BMSCs cultured at passage 0 (P0) and passage 3 (P3) (a). Flow cytometry analysis indicating positive BMSCs markers (CD29, CD44, CD90) and a negative marker (CD45) (b). Representative picture of brains from the Sham and SAH groups (c). A schematic indicating the optimal brain region for immunochemistry staining, qRT-PCR and western blotting (red circle) (d). CD, cluster of differentiation
Fig. 1 Identification of rat BMSCs and representative image of subarachnoid hemorrhage (SAH) model. Representative micrographs of BMSCs cultured at passage 0 (P0) and passage 3 (P3) (a). Flow cytometry analysis indicating positive BMSCs markers (CD29, CD44, CD90) and a negative marker (CD45) (b). Representative picture of brains from the Sham and SAH groups (c). A schematic indicating the optimal brain region for immunochemistry staining, qRT-PCR and western blotting (red circle) (d). CD, cluster of differentiationCC BY · PubMed Central
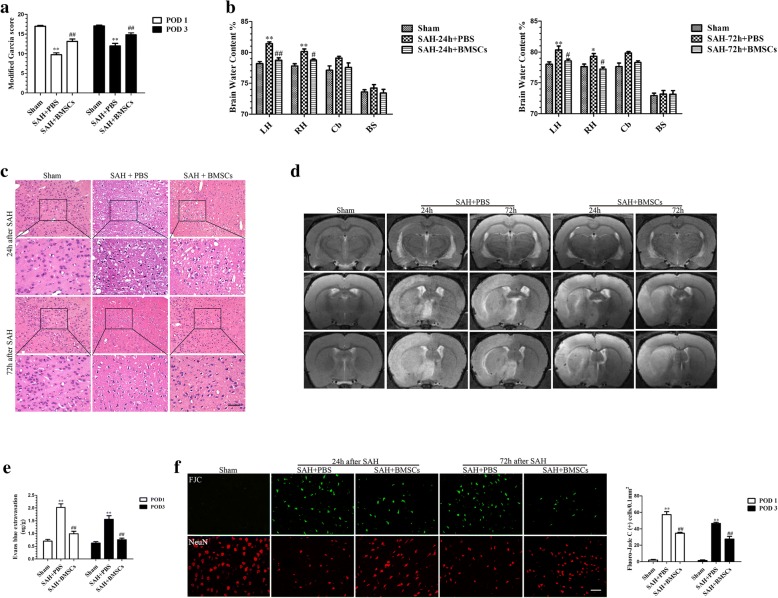
Fig. 2 The effect of BMSCs transplantation on neurological function, brain edema, BBB disruption and neuronal degeneration after SAH. BMSCs treatment significantly improved neurological function (a) (n = 12/group) and reduced BWC both at 24 and 72 h post-SAH (b) (n = 6/group). Representative images of H&E staining (c) and T2-weighted MRI images (d) showing alterations in lesion volume after BMSCs treatment. The quantification of Evans Blue dye extravasation (e) (n = 6/group). Typical Fluoro-Jade C (FJC) and NeuN (neuronal marker) staining images and quantitative analysis of FJC-positive cells from the injured hemisphere (f) (n = 6/group). Data are expressed as the mean ± SEM. *P < 0.05, **P < 0.01 versus Sham, #P < 0.05, ##P < 0.01 versus SAH + PBS group. Scale bar = 50 μm. BS brain stem, Cb cerebellum, LH left hemisphere, RH right hemisphere, POD post-operative day
Fig. 2 The effect of BMSCs transplantation on neurological function, brain edema, BBB disruption and neuronal degeneration after SAH. BMSCs treatment significantly improved neurological function (a) (n = 12/group) and reduced BWC both at 24 and 72 h post-SAH (b) (n = 6/group). Representative images of H&E staining (c) and T2-weighted MRI images (d) showing alterations in lesion volume after BMSCs treatment. The quantification of Evans Blue dye extravasation (e) (n = 6/group). Typical Fluoro-Jade C (FJC) and NeuN (neuronal marker) staining images and quantitative analysis of FJC-positive cells from the injured hemisphere (f) (n = 6/group). Data are expressed as the mean ± SEM. *P < 0.05, **P < 0.01 versus Sham, #P < 0.05, ##P < 0.01 versus SAH + PBS group. Scale bar = 50 μm. BS brain stem, Cb cerebellum, LH left hemisphere, RH right hemisphere, POD post-operative dayCC BY · PubMed Central
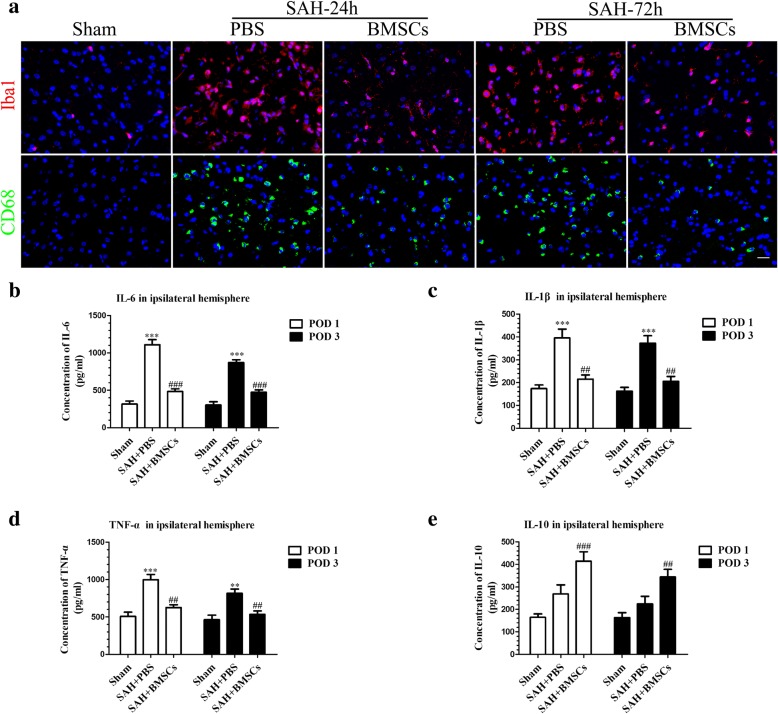
Fig. 3 BMSCs treatment suppressed microglial activation and downregulated production of inflammatory cytokines IL-6, IL-1β, and TNF-α at 24 and 72 h post-SAH. Representative images of ionized calcium binding adapter molecule1 (Iba1)- and CD68-positive cells in the Sham, SAH + PBS, and SAH + BMSCs groups (a). BMSCs treatment decreased the expression of pro-inflammatory cytokines, IL-6 (b), IL-1β (c), and TNF-α (d) but elevated the expression of anti-inflammatory cytokine, IL-10 (e) in brain tissue both at 24 and 72 h post-SAH; n = 6 in each group; data are expressed as the mean ± SEM. **P < 0.01, ***P < 0.001 versus Sham, ##P < 0.01,###P < 0.001 versus SAH + PBS group. Scale bar = 50 μm
Fig. 3 BMSCs treatment suppressed microglial activation and downregulated production of inflammatory cytokines IL-6, IL-1β, and TNF-α at 24 and 72 h post-SAH. Representative images of ionized calcium binding adapter molecule1 (Iba1)- and CD68-positive cells in the Sham, SAH + PBS, and SAH + BMSCs groups (a). BMSCs treatment decreased the expression of pro-inflammatory cytokines, IL-6 (b), IL-1β (c), and TNF-α (d) but elevated the expression of anti-inflammatory cytokine, IL-10 (e) in brain tissue both at 24 and 72 h post-SAH; n = 6 in each group; data are expressed as the mean ± SEM. **P < 0.01, ***P < 0.001 versus Sham, ##P < 0.01,###P < 0.001 versus SAH + PBS group. Scale bar = 50 μmCC BY · PubMed Central
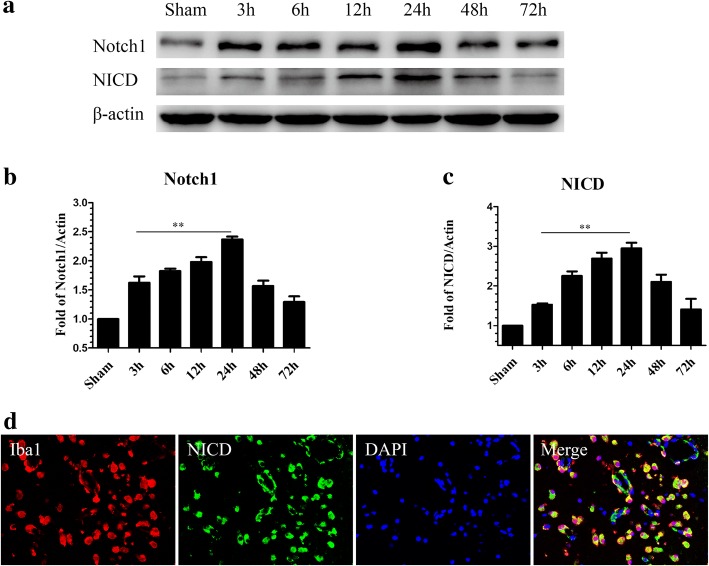
Fig. 4 Time course of Notch1 and NICD expression in the left cortex after SAH. Representative images of Western blot data showing that endogenous Notch1 and NICD began to increase at 3 h and reached their highest expression at 24 h post-SAH (a). Quantification of Notch1 (b) and NICD (c) expression in the left cerebral cortex after SAH; n = 6 in each group; data are expressed as the mean ± SEM. **P < 0.01 versus Sham. Representative images of double immunofluorescence staining for NICD and Iba1 showing the co-localization of NICD with Iba1-positive microglia (d) in the left cerebral cortex at 24 h post-SAH. Scale bar = 50 μm. NICD Notch1 intracellular receptor domain
Fig. 4 Time course of Notch1 and NICD expression in the left cortex after SAH. Representative images of Western blot data showing that endogenous Notch1 and NICD began to increase at 3 h and reached their highest expression at 24 h post-SAH (a). Quantification of Notch1 (b) and NICD (c) expression in the left cerebral cortex after SAH; n = 6 in each group; data are expressed as the mean ± SEM. **P < 0.01 versus Sham. Representative images of double immunofluorescence staining for NICD and Iba1 showing the co-localization of NICD with Iba1-positive microglia (d) in the left cerebral cortex at 24 h post-SAH. Scale bar = 50 μm. NICD Notch1 intracellular receptor domainCC BY · PubMed Central
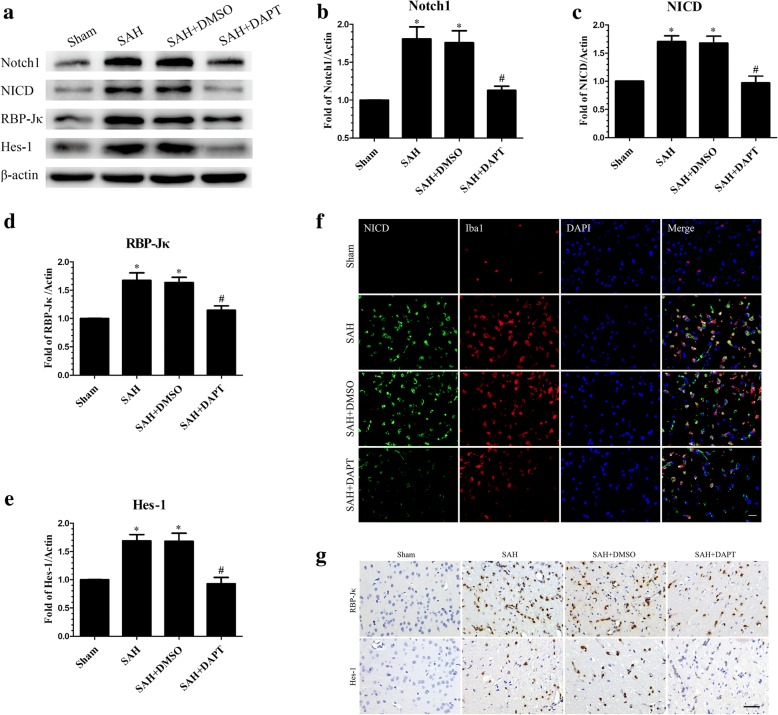
Fig. 5 N-[N-(3,5-difluorophenacetyl-l-alanyl)]-S-phenylglycine t-butyl ester (DAPT) inhibited the protein expression of molecules in Notch1 pathway. Western blotting showing DAPT significantly reduced the expression of Notch1, NICD, RBP-Jκ, and Hes-1 (a), with quantitative analysis of Notch1 (b), NICD (c), RBP-Jκ (d), and Hes-1 (e) levels in left hemisphere at 24 h post-SAH; n = 6 in each group; data are expressed as the mean ± SEM. *P < 0.05 versus Sham, #P < 0.05 versus SAH + DMSO group. Representative microphotographs of immunofluorescence staining for NICD and Iba1 (f), and immunohistochemistry staining for RBP-Jκ and Hes-1 (g) in the left cerebral cortex at 24 h post-SAH. Scale bar = 50 μm. RBP-Jκ: Recombining binding protein suppressor of hairless; Hes-1: Hes family basic helix loop helix transcription factor 1
Fig. 5 N-[N-(3,5-difluorophenacetyl-l-alanyl)]-S-phenylglycine t-butyl ester (DAPT) inhibited the protein expression of molecules in Notch1 pathway. Western blotting showing DAPT significantly reduced the expression of Notch1, NICD, RBP-Jκ, and Hes-1 (a), with quantitative analysis of Notch1 (b), NICD (c), RBP-Jκ (d), and Hes-1 (e) levels in left hemisphere at 24 h post-SAH; n = 6 in each group; data are expressed as the mean ± SEM. *P < 0.05 versus Sham, #P < 0.05 versus SAH + DMSO group. Representative microphotographs of immunofluorescence staining for NICD and Iba1 (f), and immunohistochemistry staining for RBP-Jκ and Hes-1 (g) in the left cerebral cortex at 24 h post-SAH. Scale bar = 50 μm. RBP-Jκ: Recombining binding protein suppressor of hairless; Hes-1: Hes family basic helix loop helix transcription factor 1CC BY · PubMed Central
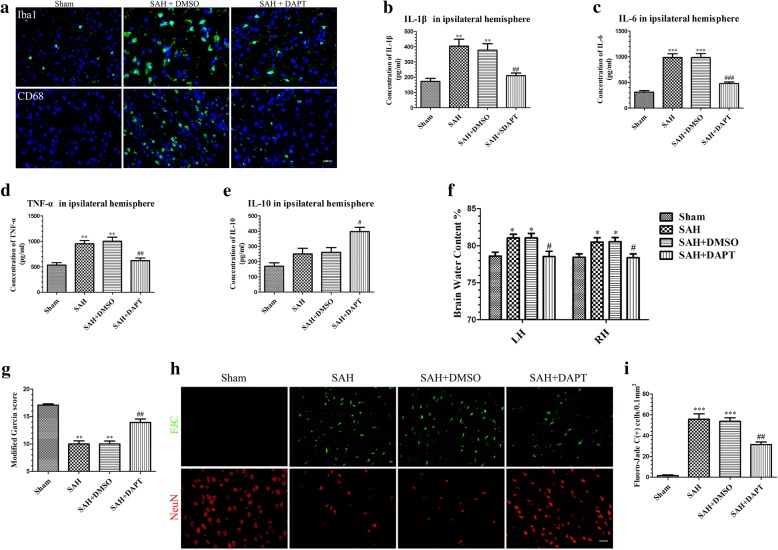
Fig. 6 Effects of DAPT on microglial activation, inflammatory factors production, brain edema, neurobehavioral deficits, and neuronal degeneration in SAH rats. Representative images of Iba1- and CD68-positive microglia in the Sham, SAH + DMSO, and SAH + DAPT groups (a). ELISA results indicating the levels of the pro-inflammatory factors IL-1β (b), IL-6 (c), and TNF-α (d) and the anti-inflammatory factor IL-10 (e) in the ipsilateral cerebral tissue at 24 h post-SAH; n = 6 in each group. DAPT treatment markedly reduced BWC (f) (n = 6/group) in the left hemisphere and increased modified Garcia score (g) (n = 12/group). Representative FJC and NeuN staining images (h) and quantitative analysis of FJC-positive cells (i) (n = 6/group) in the left cortex after SAH with DAPT or DMSO treatment. Data are expressed as the mean ± SEM. *P < 0.05, **P < 0.01, ***P < 0.001 versus Sham, #P < 0.05, ##P < 0.01, ###P < 0.001 versus SAH + DMSO group. Scale bar = 50 μm
Fig. 6 Effects of DAPT on microglial activation, inflammatory factors production, brain edema, neurobehavioral deficits, and neuronal degeneration in SAH rats. Representative images of Iba1- and CD68-positive microglia in the Sham, SAH + DMSO, and SAH + DAPT groups (a). ELISA results indicating the levels of the pro-inflammatory factors IL-1β (b), IL-6 (c), and TNF-α (d) and the anti-inflammatory factor IL-10 (e) in the ipsilateral cerebral tissue at 24 h post-SAH; n = 6 in each group. DAPT treatment markedly reduced BWC (f) (n = 6/group) in the left hemisphere and increased modified Garcia score (g) (n = 12/group). Representative FJC and NeuN staining images (h) and quantitative analysis of FJC-positive cells (i) (n = 6/group) in the left cortex after SAH with DAPT or DMSO treatment. Data are expressed as the mean ± SEM. *P < 0.05, **P < 0.01, ***P < 0.001 versus Sham, #P < 0.05, ##P < 0.01, ###P < 0.001 versus SAH + DMSO group. Scale bar = 50 μmCC BY · PubMed Central
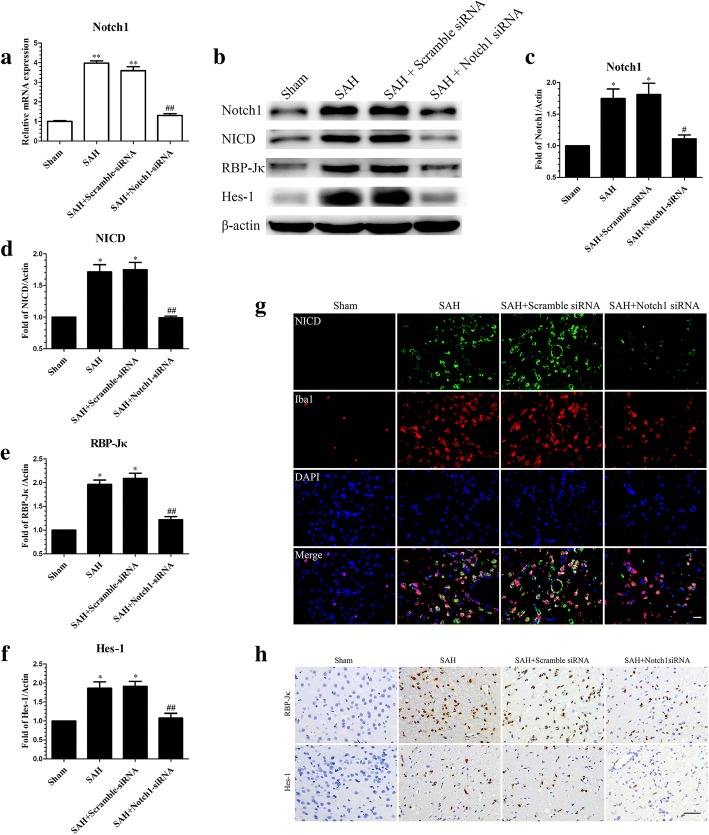
Fig. 7 Effects of Notch1 siRNA on the expression of molecules in the Notch1 pathway at 24 h post-SAH. The qRT-PCR analysis of the efficiency of siRNA-mediated knockdown of Notch1 in ipsilateral cerebral cortex (a); n = 3 in each group; data are expressed as the mean ± SEM **P < 0.01 versus Sham, ##P < 0.01 versus SAH + Scramble siRNA group. The protein levels of Notch1 pathway-related agents were assessed by Western blot (b) and quantification of Notch1 (c), NICD (d), RBP-Jκ (e), and Hes-1 (f) at 24 h post-SAH; n = 6 in each group; data are expressed as the mean ± SEM. *P < 0.05 versus Sham, #P < 0.05, ##P < 0.01 versus SAH + Scramble siRNA group. Representative images of NICD- and Iba1-positive cells (g) and immunohistochemistry staining for RBP-Jκ and Hes-1 (h) showing that Notch1 siRNA reduced the levels of NICD, RBP-Jκ and Hes-1 in ipsilateral cerebral cortex. Scale bar = 50 μm
Fig. 7 Effects of Notch1 siRNA on the expression of molecules in the Notch1 pathway at 24 h post-SAH. The qRT-PCR analysis of the efficiency of siRNA-mediated knockdown of Notch1 in ipsilateral cerebral cortex (a); n = 3 in each group; data are expressed as the mean ± SEM **P < 0.01 versus Sham, ##P < 0.01 versus SAH + Scramble siRNA group. The protein levels of Notch1 pathway-related agents were assessed by Western blot (b) and quantification of Notch1 (c), NICD (d), RBP-Jκ (e), and Hes-1 (f) at 24 h post-SAH; n = 6 in each group; data are expressed as the mean ± SEM. *P < 0.05 versus Sham, #P < 0.05, ##P < 0.01 versus SAH + Scramble siRNA group. Representative images of NICD- and Iba1-positive cells (g) and immunohistochemistry staining for RBP-Jκ and Hes-1 (h) showing that Notch1 siRNA reduced the levels of NICD, RBP-Jκ and Hes-1 in ipsilateral cerebral cortex. Scale bar = 50 μmCC BY · PubMed Central
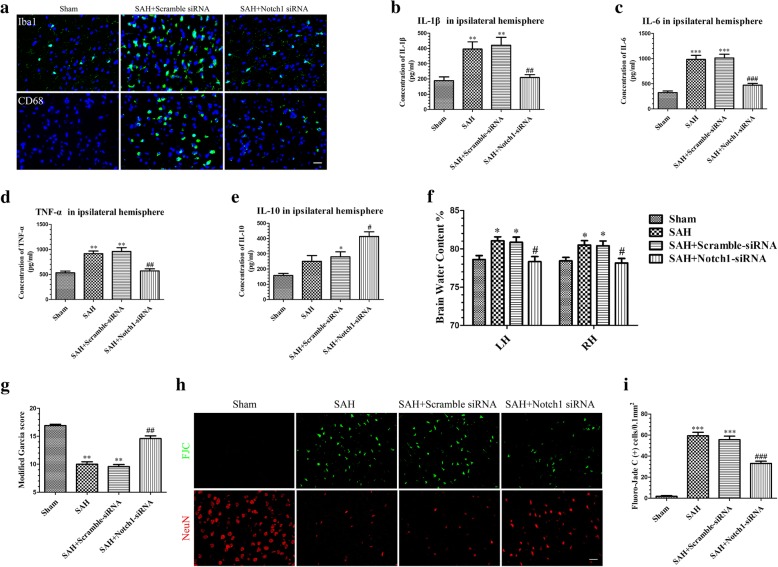
Fig. 8 Effects of Notch1 siRNA on the microglial activation, inflammatory cytokines production, BWC, modified Garcia scores, and neuronal injury after 24 h SAH. Notch1 siRNA decreased Iba1- and CD68-positive cells in the left cerebral cortex at 24 h post-SAH (a). The protein levels of the proinflammatory cytokines IL-1β (b), IL-6 (c), and TNF-α (d) were decreased while the levels of the anti-inflammatory cytokine IL-10 (e) were increased in the SAH + Notch1 siRNA group compared with the SAH + Scramble siRNA group; n = 6 in each group. Notch1 siRNA treatment significantly alleviated BWC (f) (n = 6/group) in the left hemisphere and increased modified Garcia score (g) (n = 12/group) at 24 h post-SAH, representative FJC and NeuN staining images (h), and quantitative analysis of FJC-positive cells (i) (n = 6/group) in the left cortex after SAH with Notch1 siRNA injection. Data are expressed as the mean ± SEM. *P < 0.05, **P < 0.01, ***P < 0.001 versus Sham, #P < 0.05, ##P < 0.01, ###P < 0.001 versus SAH + Scramble siRNA group. Scale bar = 50 μm
Fig. 8 Effects of Notch1 siRNA on the microglial activation, inflammatory cytokines production, BWC, modified Garcia scores, and neuronal injury after 24 h SAH. Notch1 siRNA decreased Iba1- and CD68-positive cells in the left cerebral cortex at 24 h post-SAH (a). The protein levels of the proinflammatory cytokines IL-1β (b), IL-6 (c), and TNF-α (d) were decreased while the levels of the anti-inflammatory cytokine IL-10 (e) were increased in the SAH + Notch1 siRNA group compared with the SAH + Scramble siRNA group; n = 6 in each group. Notch1 siRNA treatment significantly alleviated BWC (f) (n = 6/group) in the left hemisphere and increased modified Garcia score (g) (n = 12/group) at 24 h post-SAH, representative FJC and NeuN staining images (h), and quantitative analysis of FJC-positive cells (i) (n = 6/group) in the left cortex after SAH with Notch1 siRNA injection. Data are expressed as the mean ± SEM. *P < 0.05, **P < 0.01, ***P < 0.001 versus Sham, #P < 0.05, ##P < 0.01, ###P < 0.001 versus SAH + Scramble siRNA group. Scale bar = 50 μmCC BY · PubMed Central
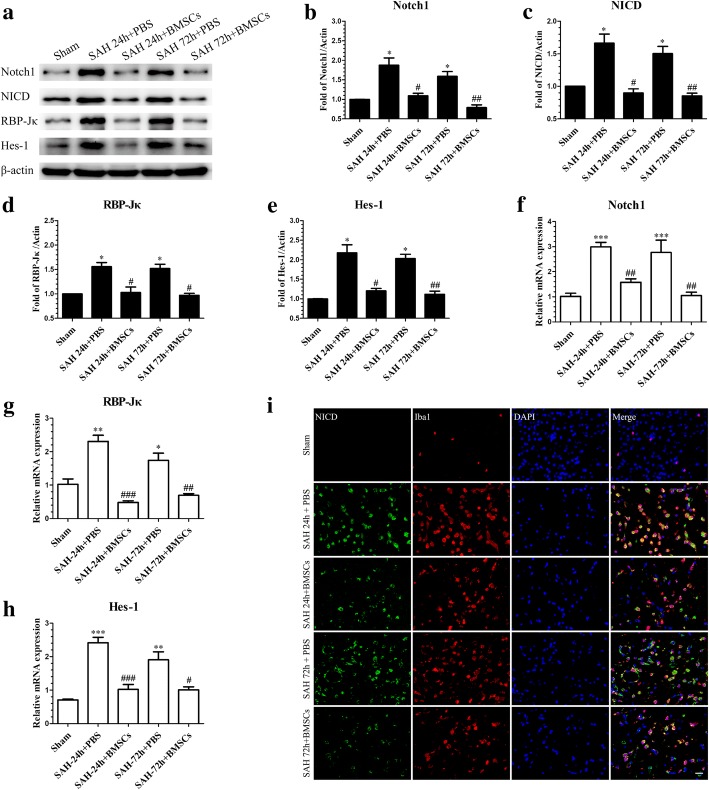
Fig. 9 BMSCs transplantation inhibited SAH-induced upregulation of the Notch1 pathway-related molecules, Notch1, NICD, RBP-Jκ, and Hes-1 at 24 and 72 h post-SAH. Representative image of Western blotting (a) and quantification of Notch1 (b), NICD (c), RBP-Jκ (d), and Hes-1 (e) protein levels after BMSCs treatment at 24 and 72 h post-SAH; n = 6 in each group; data are expressed as the mean ± SEM. *P < 0.05 versus Sham, #P < 0.05, ##P < 0.01 versus SAH+ PBS group. The qRT-PCR analysis of Notch1 (f), RBP-Jκ (g), and Hes-1 (h) mRNA levels at 24 and 72 h post-SAH; n = 3 in each group; data are expressed as the mean ± SEM. *P < 0.05, **P < 0.01, ***P < 0.001 versus Sham, #P < 0.05, ##P < 0.01, ###P < 0.001 versus SAH + PBS group. Typical images of double-immunofluorescence staining for NICD and Iba1 (i) showing that BMSCs treatment suppressed NICD expression in Iba1-positive microglia at 24 and 72 h post-SAH. Scale bar = 50 μm
Fig. 9 BMSCs transplantation inhibited SAH-induced upregulation of the Notch1 pathway-related molecules, Notch1, NICD, RBP-Jκ, and Hes-1 at 24 and 72 h post-SAH. Representative image of Western blotting (a) and quantification of Notch1 (b), NICD (c), RBP-Jκ (d), and Hes-1 (e) protein levels after BMSCs treatment at 24 and 72 h post-SAH; n = 6 in each group; data are expressed as the mean ± SEM. *P < 0.05 versus Sham, #P < 0.05, ##P < 0.01 versus SAH+ PBS group. The qRT-PCR analysis of Notch1 (f), RBP-Jκ (g), and Hes-1 (h) mRNA levels at 24 and 72 h post-SAH; n = 3 in each group; data are expressed as the mean ± SEM. *P < 0.05, **P < 0.01, ***P < 0.001 versus Sham, #P < 0.05, ##P < 0.01, ###P < 0.001 versus SAH + PBS group. Typical images of double-immunofluorescence staining for NICD and Iba1 (i) showing that BMSCs treatment suppressed NICD expression in Iba1-positive microglia at 24 and 72 h post-SAH. Scale bar = 50 μmCC BY · PubMed Central
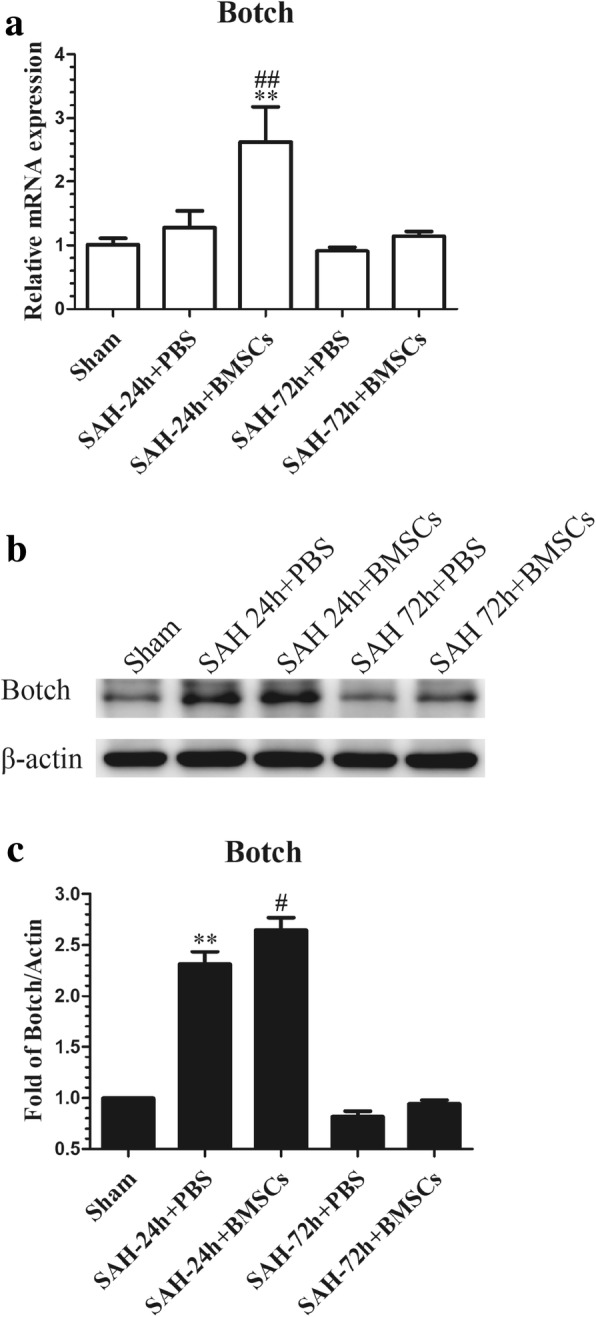
Fig. 10 Effects of BMSCs treatment on the expression of Botch in brain tissue at 24 and 72 h post-SAH. The qRT-PCR analysis of the Botch mRNA level showed that Botch was upregulated in SAH + BMSCs group compared with SAH + PBS group at 24 h post-SAH (a); n = 3 in each group; data expressed as the mean ± SEM. **P < 0.01 versus Sham, ##P < 0.01 versus SAH + PBS group. Western blot data showed that BMSCs treatment significantly increased the protein levels of Botch in left cortex at 24 h post-SAH (b); n = 6 in each group; data are expressed as the mean ± SEM. **P < 0.01 versus Sham, #P < 0.05 versus SAH + PBS group (c). The qRT-PCR and Western blotting analysis of Botch protein and mRNA levels in the left cortex showed no obvious upregulation in BMSCs treatment group at 72 h post-SAH
Fig. 10 Effects of BMSCs treatment on the expression of Botch in brain tissue at 24 and 72 h post-SAH. The qRT-PCR analysis of the Botch mRNA level showed that Botch was upregulated in SAH + BMSCs group compared with SAH + PBS group at 24 h post-SAH (a); n = 3 in each group; data expressed as the mean ± SEM. **P < 0.01 versus Sham, ##P < 0.01 versus SAH + PBS group. Western blot data showed that BMSCs treatment significantly increased the protein levels of Botch in left cortex at 24 h post-SAH (b); n = 6 in each group; data are expressed as the mean ± SEM. **P < 0.01 versus Sham, #P < 0.05 versus SAH + PBS group (c). The qRT-PCR and Western blotting analysis of Botch protein and mRNA levels in the left cortex showed no obvious upregulation in BMSCs treatment group at 72 h post-SAHCC BY · PubMed Central
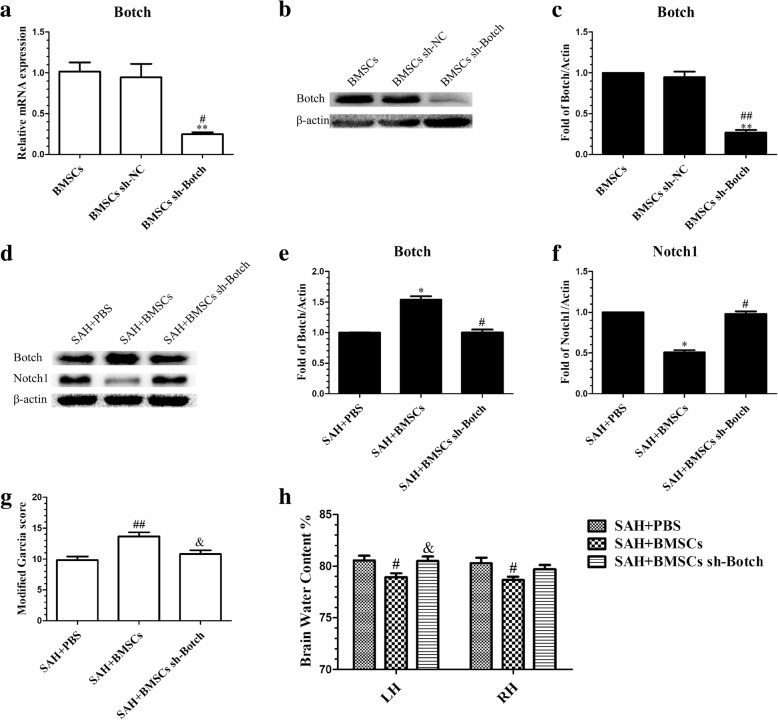
Fig. 11 Botch shRNA-mediated knockdown of Botch in BMSCs abolished their protection of EBI after SAH. The efficiency of shRNA-mediated knockdown of Botch in BMSCs was confirmed by qRT-PCR (a) (n = 3/group) and Western blotting (b) (n = 6/group). Data are expressed as the mean ± SEM. **P < 0.01 versus BMSCs group, #P < 0.05, ##P < 0.01versus BMSCs sh-NC group (c). Representative images of Western blot data showing the expression of Botch and Notch1 in SAH + PBS, SAH + BMSCs, and SAH + BMSCs sh-Botch groups (d). Quantitative analyses of Botch (e) and Notch1 (f) expression indicating that BMSCs sh-Botch transplantation significantly decreased Botch expression in brain tissue at 24 h post-SAH but increased Notch1 expression; n = 6 in each group; data are expressed as the mean ± SEM. *P < 0.05 versus SAH + PBS group, #P < 0.05 versus SAH + BMSCs group. BMSCs sh-Botch treatment accelerated neurobehavioral deficits (g) and BWC (h) compared with BMSCs treatment group; n = 6 in each group; data are expressed as the mean ± SEM. #P < 0.05, ##P < 0.01 versus SAH + PBS group, &P < 0.05 versus SAH + BMSCs group
Fig. 11 Botch shRNA-mediated knockdown of Botch in BMSCs abolished their protection of EBI after SAH. The efficiency of shRNA-mediated knockdown of Botch in BMSCs was confirmed by qRT-PCR (a) (n = 3/group) and Western blotting (b) (n = 6/group). Data are expressed as the mean ± SEM. **P < 0.01 versus BMSCs group, #P < 0.05, ##P < 0.01versus BMSCs sh-NC group (c). Representative images of Western blot data showing the expression of Botch and Notch1 in SAH + PBS, SAH + BMSCs, and SAH + BMSCs sh-Botch groups (d). Quantitative analyses of Botch (e) and Notch1 (f) expression indicating that BMSCs sh-Botch transplantation significantly decreased Botch expression in brain tissue at 24 h post-SAH but increased Notch1 expression; n = 6 in each group; data are expressed as the mean ± SEM. *P < 0.05 versus SAH + PBS group, #P < 0.05 versus SAH + BMSCs group. BMSCs sh-Botch treatment accelerated neurobehavioral deficits (g) and BWC (h) compared with BMSCs treatment group; n = 6 in each group; data are expressed as the mean ± SEM. #P < 0.05, ##P < 0.01 versus SAH + PBS group, &P < 0.05 versus SAH + BMSCs groupCC BY · PubMed Central

Verification

Claims the paper makes

The claims and statistics of this paper haven’t been checked yet.

Run the check — free, no account needed. It reads the open-access text and checks the sources it cites.

A few free checks a day · papers already verified open instantly · results are public

Claims other papers make about this one

Each is checked against this paper’s own text: does it say what the citing paper says it does?

Self-check

Percentages, sums and reported differences re-computed from the paper’s own numbers.

The self-check needs the paper’s full text.

Citations

Cites

Show all 76 references

Cited by

Metadata

Authors
Liu, W., Li, R., Yin, J., Guo, S., Chen, Y., Fan, H., Li, G., Li, Z., Li, X., Zhang, X., He, X., & Duan, C.
Venue
Journal of Neuroinflammation
Published
2019-01-15
Volume
16
Issue
1
ISSN
1742-2094
Cited by
80
References
76
Language
en
Licence
creativecommons.org/licenses/by/4.0/ (tdm)
Funders
  • Science and Technology Project Foundation of Guangdong province (ID0ESYAI13540)
  • Key Project of Clinical Research of Southern Medical University (ID0EI5AI13541)
  • National Key Research Development Program (ID0E5DBI13542)
  • Guangdong Provincial Clinical Medical Centre for Neurosurgery (ID0EUJBI13543)

About these checks

Registry, retraction, Cites and statistics results are computed, not judged, with one exception: a printed reference that no index lists is read once by a model before it counts as a citation error. Claims are extracted by a model and kept only when their quote appears verbatim in the text; each cited source is then checked, with a model’s help, for whether it says what the claim relies on. Those verdicts can be wrong — read the claim’s quote and the cited source before relying on one.

Statistics and arithmetic are recomputed, not judged.

Confidence bands are shown only for fields calibrated on our annotated test set. None is calibrated yet, so no band is shown.

What counts as a claim ›How we measure confidence ›How we check this ›

Are you an author, or do you see a problem with this page? Request a review

Data sources

Bibliographic data: Semantic Scholar, OpenAlex, Crossref.

Contains information from the Semantic Scholar Academic Graph Datasets, made available under the ODC Attribution License (ODC-BY 1.0).

Semantic Scholar’s data is described in: Kinney, R., et al. (2023). The Semantic Scholar Open Data Platform. arXiv:2301.10140.