

The DOI matches its Crossref record.
Non-myeloablative busulfan chimeric mouse models are less pro-inflammatory than head-shielded irradiation for studying immune cell interactions in brain tumours
Overview
The claims and statistics of this paper haven’t been checked yet.
Run the check — free, no account needed. It reads the open-access text and checks the sources it cites.
Integrity signals
Registry
Cites
Statistics
Figures
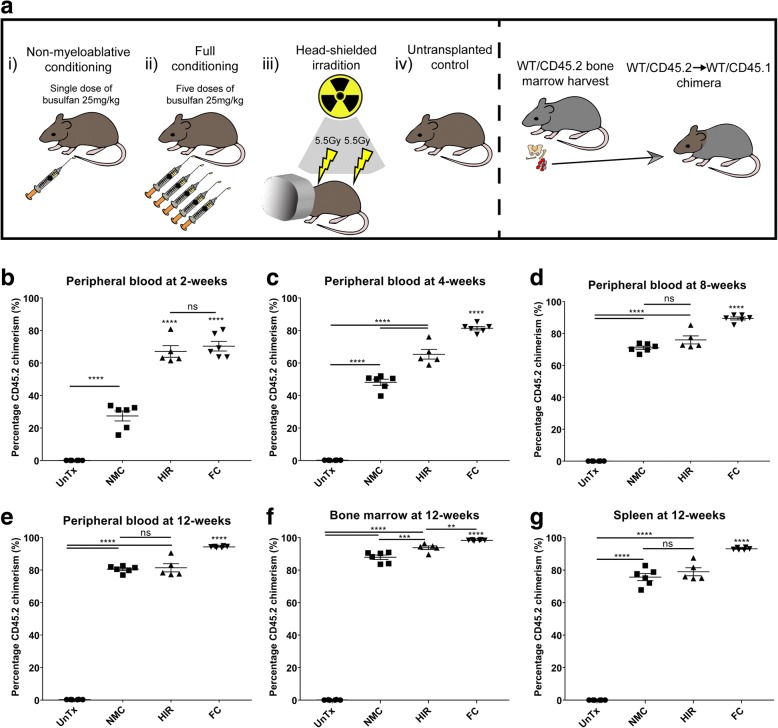
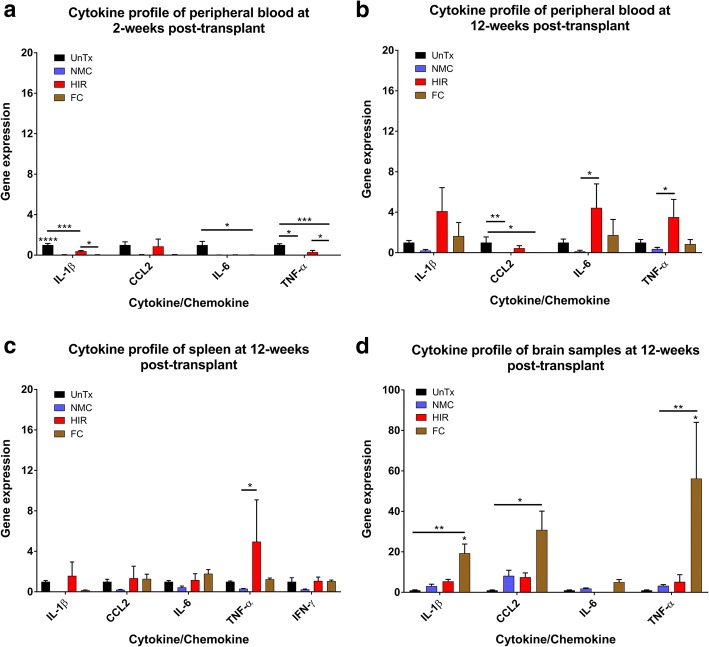
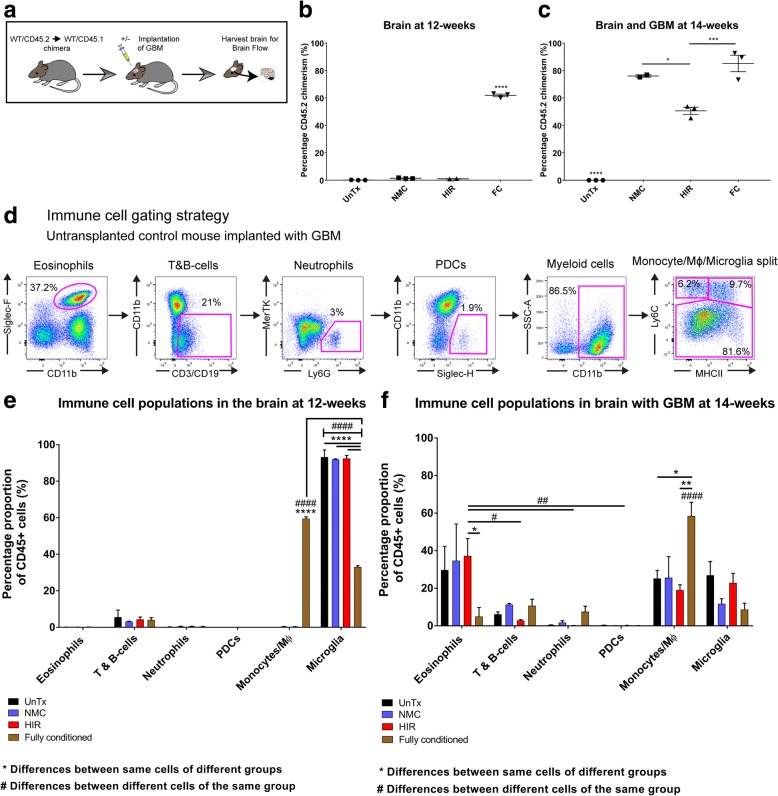
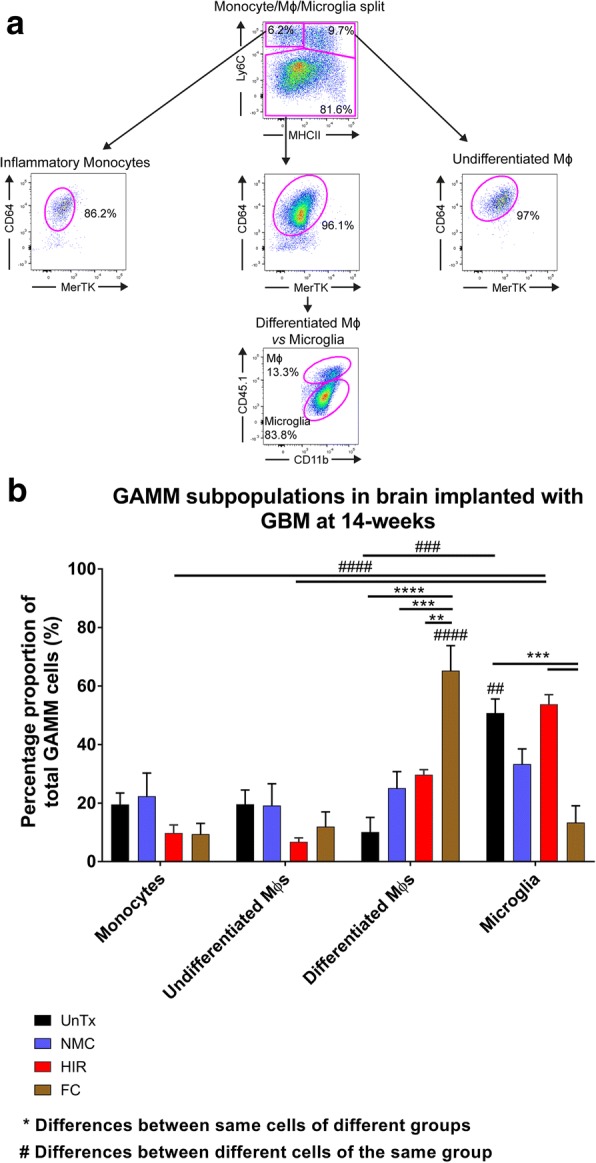
Verification
Claims the paper makes
The claims and statistics of this paper haven’t been checked yet.
Run the check — free, no account needed. It reads the open-access text and checks the sources it cites.
Claims other papers make about this one
Each is checked against this paper’s own text: does it say what the citing paper says it does?
In the citing paper
“The reported efficiencies of microglia replacement following BMT in mice vary greatly (18–23).”
From Treatment of a genetic brain disease by CNS-wide microglia replacement (2022) · cites this paper as [22]
Self-check
Percentages, sums and reported differences re-computed from the paper’s own numbers.
The self-check needs the paper’s full text.
Citations
Cites
No references could be resolved yet.
Research works printed but not linked: 40
- Larochelle A, Bellavance MA, Michaud JP, Rivest S. Bone marrow-derived macrophages and the CNS: an update on the use of experimental chimeric mouse models and bone marrow transplantation in neurological disorders. Biochim Biophys Acta. 2016;1862(3):310–22. · DOI
- Langford-Smith A, Wilkinson FL, Langford-Smith KJ, Holley RJ, Sergijenko A, Howe SJ, et al. Hematopoietic stem cell and gene therapy corrects primary neuropathology and behavior in mucopolysaccharidosis IIIA mice. Mol Ther. 2012;20(8):1610–21. · DOI
- Chen YB, Batchelor T, Li S, Hochberg E, Brezina M, Jones S, et al. Phase 2 trial of high-dose rituximab with high-dose cytarabine mobilization therapy and high-dose thiotepa, busulfan, and cyclophosphamide autologous stem cell transplantation in patients with central nervous system involvement by non-Hodgkin lymphoma. Cancer. 2015;121(2):226–33. · DOI
- Nagler A, Labopin M, Gorin NC, Ferrara F, Sanz MA, Wu D, et al. Intravenous busulfan for autologous stem cell transplantation in adult patients with acute myeloid leukemia: a survey of 952 patients on behalf of the acute leukemia working Party of the European Group for blood and marrow transplantation. Haematologica. 2014;99(8):1380–6. · DOI
- Bartelink IH, Lalmohamed A, van Reij EM, Dvorak CC, Savic RM, Zwaveling J, et al. Association of busulfan exposure with survival and toxicity after haeemopoietic cell transplantation in children and young adults: a multicentre, retrospective cohort analysis. Lancet Haematol. 2016;3(11):e526–e36. · DOI
- Benveniste H, Lee H, Volkow ND. The Glymphatic pathway. Neuroscientist. 2017;23(5):454–465 · DOI
- Westerhof GR, Ploemacher RE, Boudewijn A, Blokland I, Dillingh JH, McGown AT, et al. Comparison of different busulfan analogues for depletion of hematopoietic stem cells and promotion of donor-type chimerism in murine bone marrow transplant recipients. Cancer Res. 2000;60(19):5470–8.
- Kierdorf K, Katzmarski N, Haas CA, Prinz M. Bone marrow cell recruitment to the brain in the absence of irradiation or parabiosis bias. PLoS One. 2013;8(3):e58544. · DOI
- Wilkinson FL, Sergijenko A, Langford-Smith KJ, Malinowska M, Wynn RF, Bigger BW. Busulfan conditioning enhances engraftment of hematopoietic donor-derived cells in the brain compared with irradiation. Mol Ther. 2013;21(4):868–76. · DOI · Paper page
- Muller A, Brandenburg S, Turkowski K, Muller S, Vajkoczy P. Resident microglia, and not peripheral macrophages, are the main source of brain tumor mononuclear cells. Int J Cancer. 2015;137(2):278–88. · DOI
- Schilling M, Strecker JK, Ringelstein EB, Schabitz WR, Kiefer R. The role of CC chemokine receptor 2 on microglia activation and blood-borne cell recruitment after transient focal cerebral ischemia in mice. Brain Res. 2009;1289:79–84. · DOI
- Schilling M, Strecker JK, Schabitz WR, Ringelstein EB, Kiefer R. Effects of monocyte chemoattractant protein 1 on blood-borne cell recruitment after transient focal cerebral ischemia in mice. Neuroscience. 2009;161(3):806–12. · DOI
- Schilling M, Besselmann M, Muller M, Strecker JK, Ringelstein EB, Kiefer R. Predominant phagocytic activity of resident microglia over hematogenous macrophages following transient focal cerebral ischemia: an investigation using green fluorescent protein transgenic bone marrow chimeric mice. Exp Neurol. 2005;196(2):290–7. · DOI · Paper page
- Schilling M, Besselmann M, Leonhard C, Mueller M, Ringelstein EB, Kiefer R. Microglial activation precedes and predominates over macrophage infiltration in transient focal cerebral ischemia: a study in green fluorescent protein transgenic bone marrow chimeric mice. Exp Neurol. 2003;183(1):25–33. · DOI · Paper page
- Ajami B, Bennett JL, Krieger C, McNagny KM, Rossi FM. Infiltrating monocytes trigger EAE progression, but do not contribute to the resident microglia pool. Nat Neurosci. 2011;14(9):1142–9. · DOI · Paper page
- Burrell K, Singh S, Jalali S, Hill RP, Zadeh G. VEGF regulates region-specific localization of perivascular bone marrow-derived cells in glioblastoma. Cancer Res. 2014;74(14):3727–39. · DOI
- Brandenburg S, Muller A, Turkowski K, Radev YT, Rot S, Schmidt C, et al. Resident microglia rather than peripheral macrophages promote vascularization in brain tumors and are source of alternative pro-angiogenic factors. Acta Neuropathol. 2016;131(3):365–78. · DOI
- Capotondo A, Milazzo R, Politi LS, Quattrini A, Palini A, Plati T, et al. Brain conditioning is instrumental for successful microglia reconstitution following hematopoietic stem cell transplantation. Proc Natl Acad Sci U S A. 2012;109(37):15018–23. · DOI · Paper page
- Yu K, Youshani AS, Wilkinson FL, O'Leary C, Cook P, Laaniste L, et al. A nonmyeloablative chimeric mouse model accurately defines microglia and macrophage contribution in glioma. Neuropathol Appl Neurobiol. 2018. https://doi.org/10.1111/nan.12489 . [Epub ahead of print] · DOI
- Gleitz HF, Liao AY, Cook JR, Rowlston SF, Forte GM, D'Souza Z, et al. Brain-targeted stem cell gene therapy corrects mucopolysaccharidosis type II via multiple mechanisms. EMBO Mol Med. 2018;10(7):e8730. · DOI
- Robinson AP, Rodgers JM, Goings GE, Miller SD. Characterization of oligodendroglial populations in mouse demyelinating disease using flow cytometry: clues for MS pathogenesis. PLoS One. 2014;9(9):e107649. · DOI
- Sedgwick JD, Schwender S, Imrich H, Dorries R, Butcher GW, ter Meulen V. Isolation and direct characterization of resident microglial cells from the normal and inflamed central nervous system. Proc Natl Acad Sci U S A. 1991;88(16):7438–42. · DOI
- Lampron A, Lessard M, Rivest S. Effects of myeloablation, peripheral chimerism, and whole-body irradiation on the entry of bone marrow-derived cells into the brain. Cell Transplant. 2012;21(6):1149–59. · DOI · Paper page
- Xun CQ, Thompson JS, Jennings CD, Brown SA, Widmer MB. Effect of total body irradiation, busulfan-cyclophosphamide, or cyclophosphamide conditioning on inflammatory cytokine release and development of acute and chronic graft-versus-host disease in H-2-incompatible transplanted SCID mice. Blood. 1994;83(8):2360–7. · DOI
- Meisen WH, Wohleb ES, Jaime-Ramirez AC, Bolyard C, Yoo JY, Russell L, et al. The impact of macrophage- and microglia-secreted TNFalpha on oncolytic HSV-1 therapy in the glioblastoma tumor microenvironment. Clin Cancer Res. 2015;21(14):3274–85. · DOI
- Raper D, Louveau A, Kipnis J. How do meningeal lymphatic vessels drain the CNS? Trends Neurosci. 2016;39(9):581–6. · DOI
- Gossel G, Hogan T, Cownden D, Seddon B, Yates AJ. Memory CD4 T cell subsets are kinetically heterogeneous and replenished from naive T cells at high levels. elife. 2017;6:e23013. · DOI
- Lacy P, Levi-Schaffer F, Mahmudi-Azer S, Bablitz B, Hagen SC, Velazquez J, et al. Intracellular localization of interleukin-6 in eosinophils from atopic asthmatics and effects of interferon gamma. Blood. 1998;91(7):2508–16. · DOI
- Melani C, Mattia GF, Silvani A, Care A, Rivoltini L, Parmiani G, et al. Interleukin-6 expression in human neutrophil and eosinophil peripheral blood granulocytes. Blood. 1993;81(10):2744–9. · DOI
- Rotman M, Ansley H, Rogow L, Stowe S. Monocytosis: a new observation during radiotherapy. Int J Radiat Oncol Biol Phys. 1977;2(1–2):117–21. · DOI
- Eldred E. The response of eosinophils to total-body x-radiation of the monkey. Blood. 1959;14(2):187–93. · DOI
- Carretero R, Sektioglu IM, Garbi N, Salgado OC, Beckhove P, Hammerling GJ. Eosinophils orchestrate cancer rejection by normalizing tumor vessels and enhancing infiltration of CD8(+) T cells. Nat Immunol. 2015;16(6):609–17. · DOI · Paper page
- Gabrusiewicz K, Ellert-Miklaszewska A, Lipko M, Sielska M, Frankowska M, Kaminska B. Characteristics of the alternative phenotype of microglia/macrophages and its modulation in experimental gliomas. PLoS One. 2011;6(8):e23902. · DOI
- Kostianovsky AM, Maier LM, Anderson RC, Bruce JN, Anderson DE. Astrocytic regulation of human monocytic/microglial activation. J Immunol. 2008;181(8):5425–32. · DOI
- Yeung YT, McDonald KL, Grewal T, Munoz L. Interleukins in glioblastoma pathophysiology: implications for therapy. Br J Pharmacol. 2013;168(3):591–606. · DOI
- Manda K, Glasow A, Paape D, Hildebrandt G. Effects of ionizing radiation on the immune system with special emphasis on the interaction of dendritic and T cells. Front Oncol. 2012;2:102. · DOI
- Schaue D, McBride WH. T lymphocytes and normal tissue responses to radiation. Front Oncol. 2012;2:119.
- Morel A, Fernandez N, de La Coste A, Haddada H, Viguier M, Polla BS, et al. Gamma-ray irradiation induces B7.1 costimulatory molecule neoexpression in various murine tumor cells. Cancer Immunol Immunother. 1998;46(5):277–82. · DOI
- Seo A, Ishikawa F, Nakano H, Nakazaki H, Kobayashi K, Kakiuchi T. Enhancement of B7-1 (CD80) expression on B-lymphoma cells by irradiation. Immunology. 1999;96(4):642–8. · DOI
- Reits EA, Hodge JW, Herberts CA, Groothuis TA, Chakraborty M, Wansley EK, et al. Radiation modulates the peptide repertoire, enhances MHC class I expression, and induces successful antitumor immunotherapy. J Exp Med. 2006;203(5):1259–71. · DOI · Paper page
Cited by
Treatment of a genetic brain disease by CNS-wide microglia replacement
Shibuya, Y., Kumar, K. K., Mader, M. M.-D., Yoo, Y., Ayala, L. A., Zhou, M., Mohr, M. A., Neumayer, G., Kumar, I., Yamamoto, R., et al. (2022) · Science Translational Medicine · doi:10.1126/scitranslmed.abl9945 · Cited by 126
Metadata
- Authors
- Youshani, A. S., Rowlston, S., O’Leary, C., Forte, G., Parker, H., Liao, A., Telfer, B., Williams, K., Kamaly-Asl, I. D., & Bigger, B. W.
- Venue
- Journal of Neuroinflammation
- Published
- 2019-02-05
- Volume
- 16
- Issue
- 1
- ISSN
- 1742-2094
- PMC
- PMC6362590
- Cited by
- 16
- References
- 0
- Language
- en
- Funders
- Royal College of Surgeons of England (Fellowship)
About these checks
Registry, retraction, Cites and statistics results are computed, not judged, with one exception: a printed reference that no index lists is read once by a model before it counts as a citation error. Claims are extracted by a model and kept only when their quote appears verbatim in the text; each cited source is then checked, with a model’s help, for whether it says what the claim relies on. Those verdicts can be wrong — read the claim’s quote and the cited source before relying on one.
Statistics and arithmetic are recomputed, not judged.
Confidence bands are shown only for fields calibrated on our annotated test set. None is calibrated yet, so no band is shown.
What counts as a claim ›How we measure confidence ›How we check this ›
Are you an author, or do you see a problem with this page? Request a review
How to cite
Cite CoChat for the checks on this page, and the paper for its own findings.
- This page
- CoChat. (2026). Citation check: Non-myeloablative busulfan chimeric mouse models are less pro-inflammatory than head-shielded irradiation for studying immune cell interactions in brain tumours. https://app.cochat.ai/papers/10.1186/s12974-019-1410-y
- The paper
- Youshani, A. S., Rowlston, S., O’Leary, C., Forte, G., Parker, H., Liao, A., Telfer, B., Williams, K., Kamaly-Asl, I. D., & Bigger, B. W. (2019). Non-myeloablative busulfan chimeric mouse models are less pro-inflammatory than head-shielded irradiation for studying immune cell interactions in brain tumours. Journal of Neuroinflammation. https://doi.org/10.1186/s12974-019-1410-y
