

The DOI matches its Crossref record; 38 of the 38 references it cites were found in a registry or an index.
Effects of long-term and brain-wide colonization of peripheral bone marrow-derived myeloid cells in the CNS
Published version of a preprint
Abstract
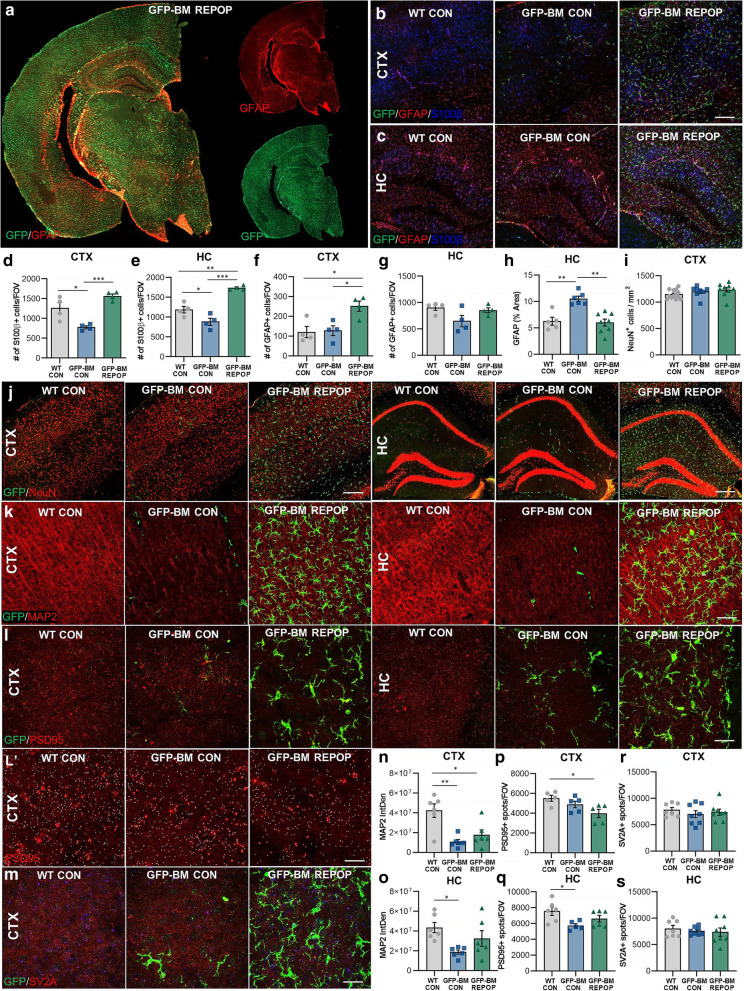
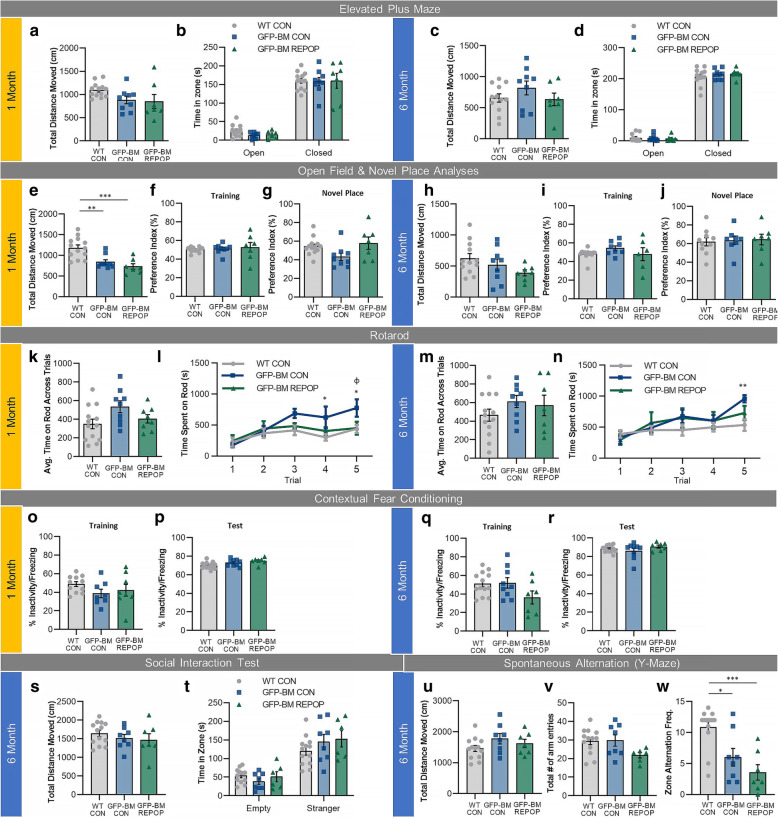
Background: Microglia, the primary resident myeloid cells of the brain, play critical roles in immune defense by maintaining tissue homeostasis and responding to injury or disease. However, microglial activation and dysfunction has been implicated in a number of central nervous system (CNS) disorders, thus developing tools to manipulate and replace these myeloid cells in the CNS is of therapeutic interest. Methods: Using whole body irradiation, bone marrow transplant, and colony-stimulating factor 1 receptor inhibition, we achieve long-term and brain-wide (~ 80%) engraftment and colonization of peripheral bone marrow-derived myeloid cells (i.e., monocytes) in the brain parenchyma and evaluated the long-term effects of their colonization in the CNS. Results: Here, we identify a monocyte signature that includes an upregulation in Ccr1 , Ms4a6b , Ms4a6c , Ms4a7 , Apobec1 , Lyz2 , Mrc1 , Tmem221 , Tlr8 , Lilrb4a , Msr1 , Nnt , and Wdfy1 and a downregulation of Siglech , Slc2a5 , and Ccl21a/b . We demonstrate that irradiation and long-term (~ 6 months) engraftment of the CNS by monocytes induces brain region-dependent alterations in transcription profiles, astrocytes, neuronal structures, including synaptic components, and cognition. Although our results show that microglial replacement with peripherally derived myeloid cells is feasible and that irradiation-induced changes can be reversed by the replacement of microglia with monocytes in the hippocampus, we also observe that brain-wide engraftment of peripheral myeloid cells (relying on irradiation) can result in cognitive and synaptic deficits. Conclusions: These findings provide insight into better understanding the role and complexity of myeloid cells in the brain, including their regulation of other CNS cells and functional outcomes.
Overview
The claims and statistics of this paper haven’t been checked yet.
Run the check — free, no account needed. It reads the open-access text and checks the sources it cites.
Integrity signals
Registry
Cites
Statistics
Figures
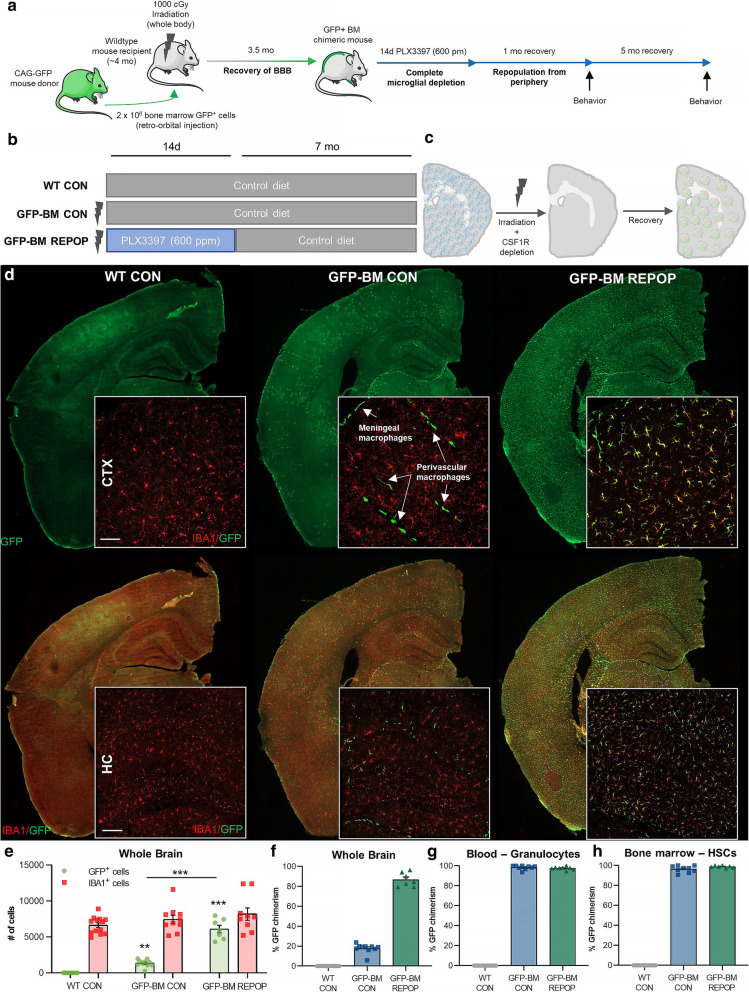
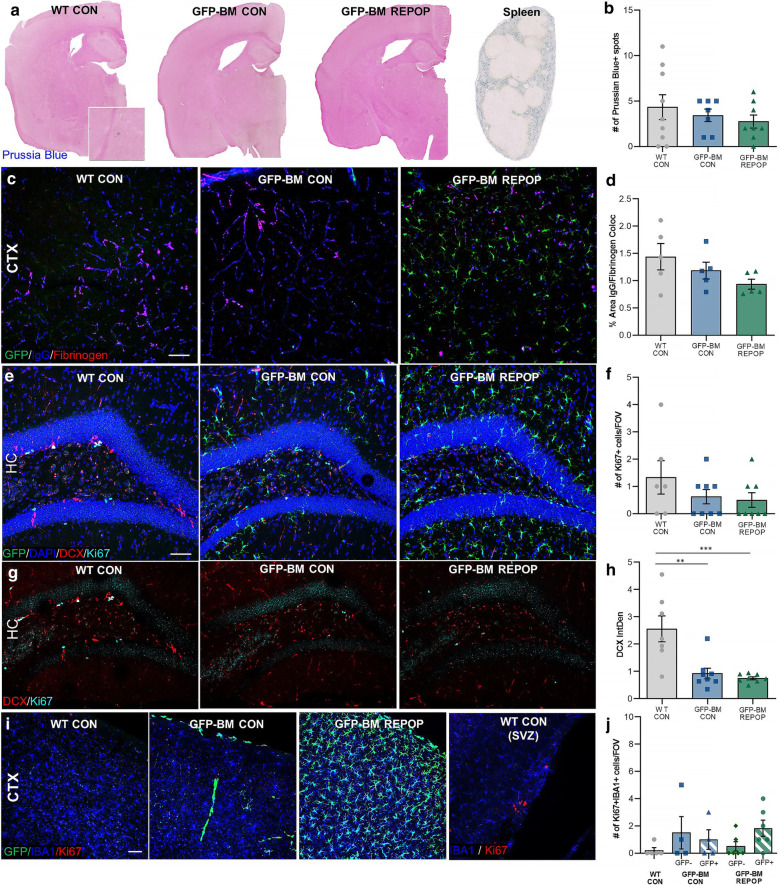
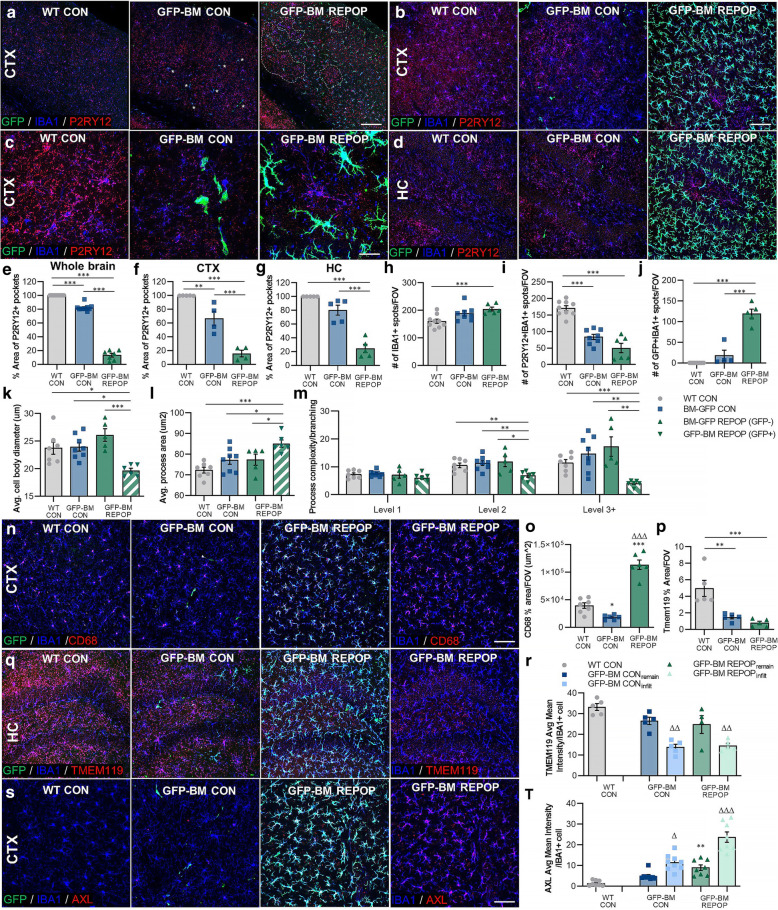
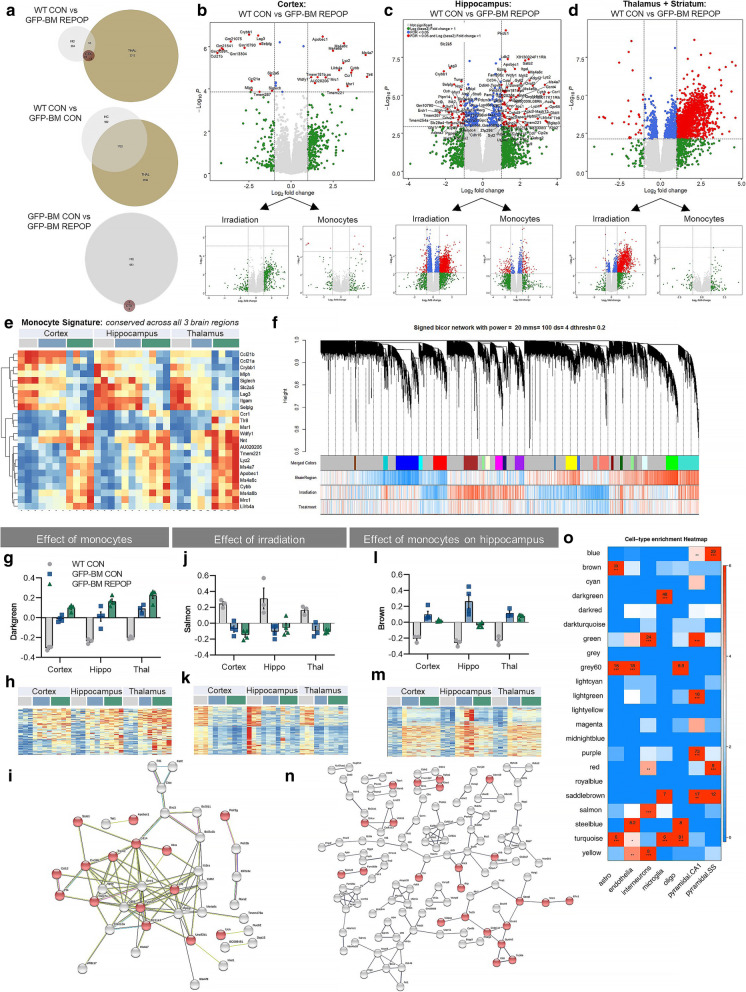
Verification
Claims the paper makes
The claims and statistics of this paper haven’t been checked yet.
Run the check — free, no account needed. It reads the open-access text and checks the sources it cites.
Claims other papers make about this one
Each is checked against this paper’s own text: does it say what the citing paper says it does?
In the citing paper
“We here and others recently developed a rapid and near-complete replacement of microglia in mice with circulation-derived myeloid cells (CDMCs) eliminating the large variability observed following conventional bone marrow transplantation (BMT) (16, 17).”
From Treatment of a genetic brain disease by CNS-wide microglia replacement (2022) · cites this paper as [16]
In the citing paper
“To that end, a recent study found remarkably subtle changes in transcriptional, histological, and behavioral features of mice with high CDMC chimerism (16).”
From Treatment of a genetic brain disease by CNS-wide microglia replacement (2022) · cites this paper as [16]
In the citing paper
“As reported for conventional BMT (16) and also in our method, we found donor-derived myeloid cells in the choroid plexus, meninges, and perivascular region (fig. S2A).”
From Treatment of a genetic brain disease by CNS-wide microglia replacement (2022) · cites this paper as [16]
In the citing paper
“For instance, CDMCs in the normal brain induce a regional astrocytic activation (16) whereas in our mouse model for Psap-deficiency, CDMCs effectively reduced astrogliosis.”
From Treatment of a genetic brain disease by CNS-wide microglia replacement (2022) · cites this paper as [16]
Self-check
Percentages, sums and reported differences re-computed from the paper’s own numbers.
The self-check needs the paper’s full text.
Citations
Cites
A General Framework for Weighted Gene Co-Expression Network Analysis
Zhang, B., & Horvath, S. (2005) · Statistical Applications in Genetics and Molecular Biology · doi:10.2202/1544-6115.1128 · Cited by 5,684
Microglia Sculpt Postnatal Neural Circuits in an Activity and Complement-Dependent Manner
Schafer, D. P., Lehrman, E. K., Kautzman, A. G., Koyama, R., Mardinly, A. R., Yamasaki, R., Ransohoff, R. M., Greenberg, M. E., Barres, B. A., & Stevens, B. (2012) · Neuron · doi:10.1016/j.neuron.2012.03.026 · Cited by 4,089
Elmore, M. R. P., Najafi, A. R., Koike, M. A., Dagher, N. N., Spangenberg, E. E., Rice, R. A., Kitazawa, M., Matusow, B., Nguyen, H., West, B. L., et al. (2014) · Neuron · doi:10.1016/j.neuron.2014.02.040 · Cited by 1,968
Self-citationMicroglia emerge from erythromyeloid precursors via Pu.1- and Irf8-dependent pathways
Kierdorf, K., Erny, D., Goldmann, T., Sander, V., Schulz, C., Perdiguero, E. G., Wieghofer, P., Heinrich, A., Riemke, P., Hölscher, C., et al. (2013) · Nature Neuroscience · doi:10.1038/nn.3318 · Cited by 1,457
Microglia and brain macrophages in the molecular age: from origin to neuropsychiatric disease
Prinz, M., & Priller, J. (2014) · Nature Reviews Neuroscience · doi:10.1038/nrn3722 · Cited by 1,329
Microglia in the adult brain arise from Ly-6ChiCCR2+ monocytes only under defined host conditions
Mildner, A., Schmidt, H., Nitsche, M., Merkler, D., Hanisch, U.-K., Mack, M., Heikenwalder, M., Brück, W., Priller, J., & Prinz, M. (2007) · Nature Neuroscience · doi:10.1038/nn2015 · Cited by 1,089
Shemer, A., Grozovski, J., Tay, T. L., Tao, J., Volaski, A., Süß, P., Ardura-Fabregat, A., Gross-Vered, M., Kim, J.-S., David, E., et al. (2018) · Nature Communications · doi:10.1038/s41467-018-07548-5 · Cited by 1,052
The fate and lifespan of human monocyte subsets in steady state and systemic inflammation
Patel, A. A., Zhang, Y., Fullerton, J. N., Boelen, L., Rongvaux, A., Maini, A. A., Bigley, V., Flavell, R. A., Gilroy, D. W., Asquith, B., et al. (2017) · Journal of Experimental Medicine · doi:10.1084/jem.20170355 · Cited by 946
Spangenberg, E., Severson, P. L., Hohsfield, L. A., Crapser, J., Zhang, J., Burton, E. A., Zhang, Y., Spevak, W., Lin, J., Phan, N. Y., et al. (2019) · Nature Communications · doi:10.1038/s41467-019-11674-z · Cited by 939
Self-citationOrigin and differentiation of microglia
Ginhoux, F., Lim, S., Hoeffel, G., Low, D., & Huber, T. (2013) · Frontiers in Cellular Neuroscience · doi:10.3389/fncel.2013.00045 · Cited by 905
Research works printed but not linked: 55
- Nimmerjahn A, Kirchhoff F, Helmchen F. Resting microglial cells are highly dynamic surveillants of brain parenchyma in vivo. Science. 2005;308(5726):1314–8. · DOI · Paper page
- Ginhoux F, Greter M, Leboeuf M, Nandi S, See P, Gokhan S, et al. Fate mapping analysis reveals that adult microglia derive from primitive macrophages. Science. 2010;330(6005):841–5. · DOI · Paper page
- Ajami B, Bennett JL, Krieger C, Tetzlaff W, Rossi FM. Local self-renewal can sustain CNS microglia maintenance and function throughout adult life. Nat Neurosci. 2007;10(12):1538–43. · DOI · Paper page
- Odabas A, McCully CML, Cruz R, Figg WD, Glod J, Rymar A, et al. PHRM-03. Cerebrospinal fluid penetration of pexidartinib (PLX3397), a CSF1R inhibitor, in a nonhuman primate model. Neuro Oncol. 2018;20(Suppl 2):i157–i. · DOI
- Cannarile MA, Weisser M, Jacob W, Jegg AM, Ries CH, Ruttinger D. Colony-stimulating factor 1 receptor (CSF1R) inhibitors in cancer therapy. J Immunother Cancer. 2017;5(1):53. · DOI
- Spangenberg EE, Green KN. Inflammation in Alzheimer’s disease: lessons learned from microglia-depletion models. Brain Behav Immun. 2017;61:1–11. · DOI · Paper page
- Tap WD, Gelderblom H, Palmerini E, Desai J, Bauer S, Blay JY, et al. Pexidartinib versus placebo for advanced tenosynovial giant cell tumour (ENLIVEN): a randomised phase 3 trial. Lancet. 2019;394(10197):478–87. · DOI
- Najafi AR, Crapser J, Jiang S, Ng W, Mortazavi A, West BL, et al. A limited capacity for microglial repopulation in the adult brain. Glia. 2018;66(11):2385–96. · DOI · Paper page
- Zhan L, Sohn PD, Zhou Y, Li Y, Gan L. A Mac2-positive progenitor-like microglial population survives independent of CSF1R signaling in adult mouse brain. bioRxiv. 2019:722090. https://doi.org/10.1101/722090. · DOI
- Peake K, Manning J, Lewis CA, Barr C, Rossi F, Krieger C. Busulfan as a myelosuppressive agent for generating stable high-level bone marrow chimerism in mice. JoVE. 2015;98:e52553.
- Herz J, Filiano AJ, Smith A, Yogev N, Kipnis J. Myeloid cells in the central nervous system. Immunity. 2017;46(6):943–56. · DOI
- Wohleb ES, McKim DB, Sheridan JF, Godbout JP. Monocyte trafficking to the brain with stress and inflammation: a novel axis of immune-to-brain communication that influences mood and behavior. Front Neurosci. 2014;8:447.
- London A, Itskovich E, Benhar I, Kalchenko V, Mack M, Jung S, et al. Neuroprotection and progenitor cell renewal in the injured adult murine retina requires healing monocyte-derived macrophages. J Exp Med. 2011;208(1):23–39. · DOI
- Platt FM, Lachmann RH. Treating lysosomal storage disorders: current practice and future prospects. Biochim Biophys Acta. 2009;1793(4):737–45. · DOI
- Dobin A, Davis CA, Schlesinger F, Drenkow J, Zaleski C, Jha S, et al. STAR: ultrafast universal RNA-seq aligner. Bioinformatics. 2013;29(1):15–21. · DOI · Paper page
- Liao Y, Smyth GK, Shi W. The R package Rsubread is easier, faster, cheaper and better for alignment and quantification of RNA sequencing reads. Nucleic Acids Res. 2019;47(8):e47. · DOI
- Ritchie ME, Phipson B, Wu D, Hu Y, Law CW, Shi W, et al. limma powers differential expression analyses for RNA-sequencing and microarray studies. Nucleic Acids Res. 2015;43(7):e47. · DOI · Paper page
- Robinson MD, McCarthy DJ, Smyth GK. edgeR: a bioconductor package for differential expression analysis of digital gene expression data. Bioinformatics. 2010;26(1):139–40. · DOI · Paper page
- McCarthy DJ, Chen Y, Smyth GK. Differential expression analysis of multifactor RNA-Seq experiments with respect to biological variation. Nucleic Acids Res. 2012;40(10):4288–97. · DOI · Paper page
- Carlson M. org.Mm.eg.db: genome wide annotation for mouse; 2018.
- Lampron A, Lessard M, Rivest S. Effects of myeloablation, peripheral chimerism, and whole-body irradiation on the entry of bone marrow-derived cells into the brain. Cell Transplant. 2012;21(6):1149–59. · DOI · Paper page
- Balentova S, Adamkov M. Molecular, cellular and functional effects of radiation-induced brain injury: a review. Int J Mol Sci. 2015;16(11):27796–815. · DOI
- Lumniczky K, Szatmari T, Safrany G. Ionizing radiation-induced immune and inflammatory reactions in the brain. Front Immunol. 2017;8:517. · DOI
- Green KN, Crapser JD, Hohsfield LA. To kill a microglia: a case for CSF1R inhibitors. Trends Immunol. 2020;in press. · DOI
- Faraco G, Park L, Anrather J, Iadecola C. Brain perivascular macrophages: characterization and functional roles in health and disease. J Mol Med (Berl). 2017;95(11):1143–52. · DOI · Paper page
- Goldmann T, Wieghofer P, Jordao MJ, Prutek F, Hagemeyer N, Frenzel K, et al. Origin, fate and dynamics of macrophages at central nervous system interfaces. Nat Immunol. 2016;17(7):797–805. · DOI · Paper page
- Yuan H, Gaber MW, Boyd K, Wilson CM, Kiani MF, Merchant TE. Effects of fractionated radiation on the brain vasculature in a murine model: blood-brain barrier permeability, astrocyte proliferation, and ultrastructural changes. Int J Radiat Oncol Biol Phys. 2006;66(3):860–6. · DOI
- Zhou K, Bostrom M, Ek CJ, Li T, Xie C, Xu Y, et al. Radiation induces progenitor cell death, microglia activation, and blood-brain barrier damage in the juvenile rat cerebellum. Sci Rep. 2017;7:46181. · DOI
- Qin DX, Zheng R, Tang J, Li JX, Hu YH. Influence of radiation on the blood-brain barrier and optimum time of chemotherapy. Int J Radiat Oncol Biol Phys. 1990;19(6):1507–10. · DOI
- Park M-K, Kim S, Jung U, Kim I, Kim JK, Roh C. Effect of acute and fractionated irradiation on hippocampal neurogenesis. Molecules. 2012;17(8):9462–8. · DOI
- Mineyeva OA, Bezriadnov DV, Kedrov AV, Lazutkin AA, Anokhin KV, Enikolopov GN. Radiation induces distinct changes in defined subpopulations of neural stem and progenitor cells in the adult hippocampus. Front Neurosci. 2019;12:1013. · DOI
- Reu P, Khosravi A, Bernard S, Mold JE, Salehpour M, Alkass K, et al. The lifespan and turnover of microglia in the human brain. Cell Rep. 2017;20(4):779–84. · DOI · Paper page
- Dubbelaar ML, Kracht L, Eggen BJL, Boddeke E. The kaleidoscope of microglial phenotypes. Front Immunol. 2018;9:1753. · DOI · Paper page
- Tan Y-L, Yuan Y, Tian L. Microglial regional heterogeneity and its role in the brain. Mol Psychiatry. 2020;25(2):351–67. · DOI · Paper page
- De Biase LM, Schuebel KE, Fusfeld ZH, Jair K, Hawes IA, Cimbro R, et al. Local cues establish and maintain region-specific phenotypes of basal ganglia microglia. Neuron. 2017;95(2):341–56.e6. · DOI · Paper page
- Grabert K, Michoel T, Karavolos MH, Clohisey S, Baillie JK, Stevens MP, et al. Microglial brain region-dependent diversity and selective regional sensitivities to aging. Nat Neurosci. 2016;19(3):504–16. · DOI · Paper page
- Willers H, Dahm-Daphi J, Powell SN. Repair of radiation damage to DNA. Br J Cancer. 2004;90(7):1297–301. · DOI
- Shkreta L, Chabot B. The RNA splicing response to DNA damage. Biomolecules. 2015;5(4):2935–77. · DOI
- Yuan S, Sun Z. Expanding horizons: ciliary proteins reach beyond cilia. Annu Rev Genet. 2013;47:353–76. · DOI
- Raber J, Torres ERS, Akinyeke T, Lee J, Weber Boutros SJ, Turker MS, et al. Detrimental effects of helium ion irradiation on cognitive performance and cortical levels of MAP-2 in B6D2F1 mice. Int J Mol Sci. 2018;19(4):1247. · DOI
- Johnson GV, Jope RS. The role of microtubule-associated protein 2 (MAP-2) in neuronal growth, plasticity, and degeneration. J Neurosci Res. 1992;33(4):505–12. · DOI
- Kang J, Kim W, Seo H, Kim E, Son B, Lee S, et al. Radiation-induced overexpression of transthyretin inhibits retinol-mediated hippocampal neurogenesis. Sci Rep. 2018;8(1):8394. · DOI
- Bajjalieh SM, Frantz GD, Weimann JM, McConnell SK, Scheller RH. Differential expression of synaptic vesicle protein 2 (SV2) isoforms. J Neurosci. 1994;14(9):5223–35. · DOI · Paper page
- Miedel CJ, Patton JM, Miedel AN, Miedel ES, Levenson JM. Assessment of spontaneous alternation, novel object recognition and limb clasping in transgenic mouse models of amyloid-β and tau neuropathology. J Vis Exp. 2017;123:55523.
- Menzel F, Kaiser N, Haehnel S, Rapp F, Patties I, Schoneberg N, et al. Impact of X-irradiation on microglia. Glia. 2018;66(1):15–33. · DOI
- Feng X, Chen D, Gupta S, Liu S, Gupta N, Rosi S. Replacement of microglia by monocyte-derived macrophages prevents long-term memory deficits after therapeutic irradiation. bioRxiv. 2019:794354. · DOI
- Varvel NH, Grathwohl SA, Baumann F, Liebig C, Bosch A, Brawek B, et al. Microglial repopulation model reveals a robust homeostatic process for replacing CNS myeloid cells. Proc Natl Acad Sci U S A. 2012;109(44):18150–5. · DOI
- Dietrich J, Baryawno N, Nayyar N, Valtis YK, Yang B, Ly I, et al. Bone marrow drives central nervous system regeneration after radiation injury. J Clin Invest. 2018;128(1):281–93. · DOI
- Frik J, Merl-Pham J, Plesnila N, Mattugini N, Kjell J, Kraska J, et al. Cross-talk between monocyte invasion and astrocyte proliferation regulates scarring in brain injury. EMBO Rep. 2018;19(5):e45294. · DOI
- Chakraborti A, Allen A, Allen B, Rosi S, Fike JR. Cranial irradiation alters dendritic spine density and morphology in the hippocampus. PLoS One. 2012;7(7):e40844. · DOI
- Son Y, Yang M, Wang H, Moon C. Hippocampal dysfunctions caused by cranial irradiation: a review of the experimental evidence. Brain Behav Immun. 2015;45:287–96. · DOI
- Tome WA, Gokhan S, Gulinello ME, Brodin NP, Heard J, Mehler MF, et al. Hippocampal-dependent neurocognitive impairment following cranial irradiation observed in pre-clinical models: current knowledge and possible future directions. Br J Radiol. 2016;89(1057):20150762. · DOI
- Seibert TM, Karunamuni R, Kaifi S, Burkeen J, Connor M, Krishnan AP, et al. Cerebral cortex regions selectively vulnerable to radiation dose-dependent atrophy. Int J Radiat Oncol Biol Phys. 2017;97(5):910–8. · DOI
- Zhang D, Zhou W, Lam TT, Weng C, Bronk L, Ma D, et al. Radiation induces age-dependent deficits in cortical synaptic plasticity. Neuro Oncol. 2018;20(9):1207–14. · DOI
- Chen SC-J, Abe Y, Fang P-T, Hsieh Y-J, Yang Y-I, Lu T-Y, et al. Prognosis of hippocampal function after sub-lethal irradiation brain injury in patients with nasopharyngeal carcinoma. Sci Rep. 2017;7(1):14697. · DOI
Cited by
Microglia as hackers of the matrix: sculpting synapses and the extracellular space
Crapser, J. D., Arreola, M. A., Tsourmas, K. I., & Green, K. N. (2021) · Cellular & Molecular Immunology · doi:10.1038/s41423-021-00751-3 · Cited by 178
Self-citationTreatment of a genetic brain disease by CNS-wide microglia replacement
Shibuya, Y., Kumar, K. K., Mader, M. M.-D., Yoo, Y., Ayala, L. A., Zhou, M., Mohr, M. A., Neumayer, G., Kumar, I., Yamamoto, R., et al. (2022) · Science Translational Medicine · doi:10.1126/scitranslmed.abl9945 · Cited by 126
Muñoz-Castro, C., Mejias-Ortega, M., Sanchez-Mejias, E., Navarro, V., Trujillo-Estrada, L., Jimenez, S., Garcia-Leon, J. A., Fernandez-Valenzuela, J. J., Sanchez-Mico, M. V., Romero-Molina, C., et al. (2023) · Acta Neuropathologica Communications · doi:10.1186/s40478-023-01530-z · Cited by 66
Mechanisms of myeloid cell entry to the healthy and diseased central nervous system
Amann, L., Masuda, T., & Prinz, M. (2023) · Nature Immunology · doi:10.1038/s41590-022-01415-8 · Cited by 50
Metadata
- Authors
- Hohsfield, L. A., Najafi, A. R., Ghorbanian, Y., Soni, N., Hingco, E. E., Kim, S. J., Jue, A. D., Swarup, V., Inlay, M. A., & Green, K. N.
- ORCID
- Green, Kim N.
- Venue
- Journal of Neuroinflammation
- Published
- 2020-09-20
- Volume
- 17
- Issue
- 1
- ISSN
- 1742-2094
- PMC
- PMC7504855
- Cited by
- 66
- References
- 38
- Language
- en
- Funders
- National Institute of Neurological Disorders and Stroke (R01NS083801)
- National Institute on Aging (R01AG056768, P50AG016573)
- Alzheimer's Association (AARF-16-442762)
- National Institutes of Health (NS082174)
About these checks
Registry, retraction, Cites and statistics results are computed, not judged, with one exception: a printed reference that no index lists is read once by a model before it counts as a citation error. Claims are extracted by a model and kept only when their quote appears verbatim in the text; each cited source is then checked, with a model’s help, for whether it says what the claim relies on. Those verdicts can be wrong — read the claim’s quote and the cited source before relying on one.
Statistics and arithmetic are recomputed, not judged.
Confidence bands are shown only for fields calibrated on our annotated test set. None is calibrated yet, so no band is shown.
What counts as a claim ›How we measure confidence ›How we check this ›
Are you an author, or do you see a problem with this page? Request a review
How to cite
Cite CoChat for the checks on this page, and the paper for its own findings.
- This page
- CoChat. (2026). Citation check: Effects of long-term and brain-wide colonization of peripheral bone marrow-derived myeloid cells in the CNS. https://app.cochat.ai/papers/10.1186/s12974-020-01931-0
- The paper
- Hohsfield, L. A., Najafi, A. R., Ghorbanian, Y., Soni, N., Hingco, E. E., Kim, S. J., Jue, A. D., Swarup, V., Inlay, M. A., & Green, K. N. (2020). Effects of long-term and brain-wide colonization of peripheral bone marrow-derived myeloid cells in the CNS. Journal of Neuroinflammation. https://doi.org/10.1186/s12974-020-01931-0
