

The DOI matches its Crossref record; 5 of the 5 references it cites were found in a registry or an index.
MicroRNA-204-5p reduction in rat hippocampus contributes to stress-induced pathology via targeting RGS12 signaling pathway
Abstract
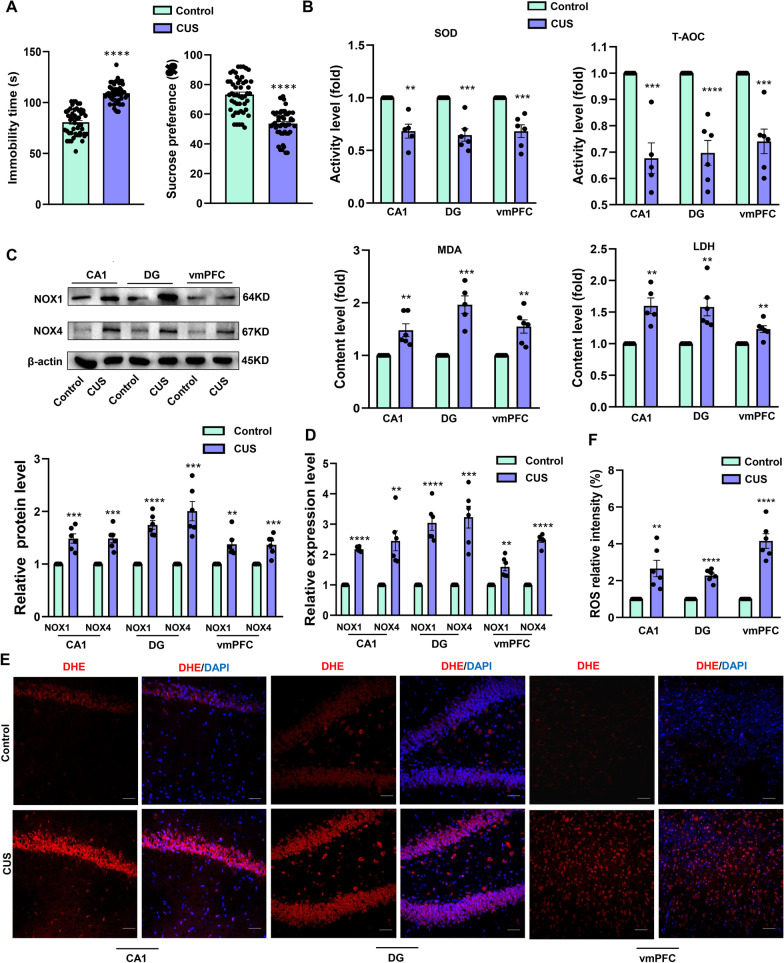
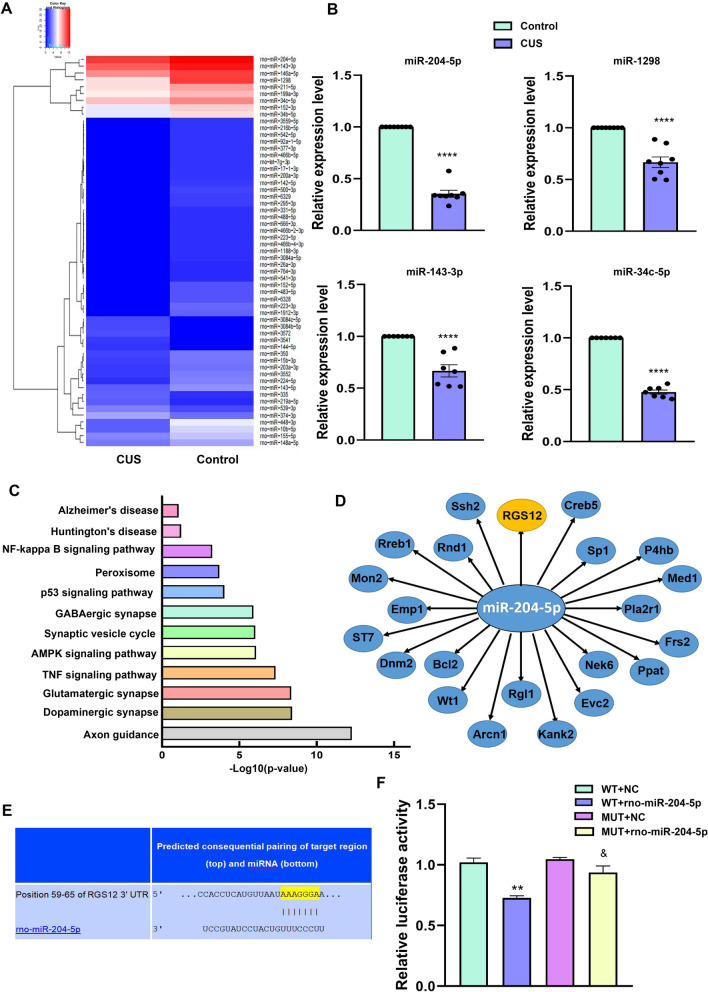
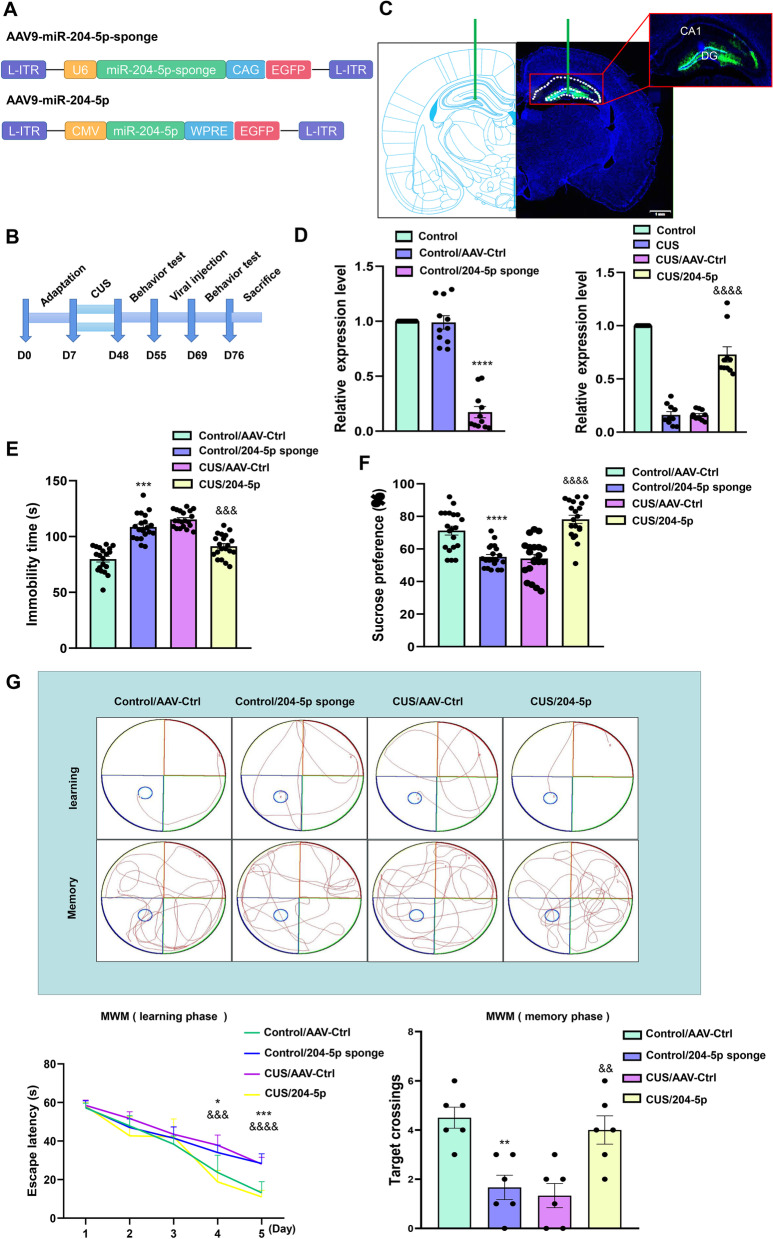
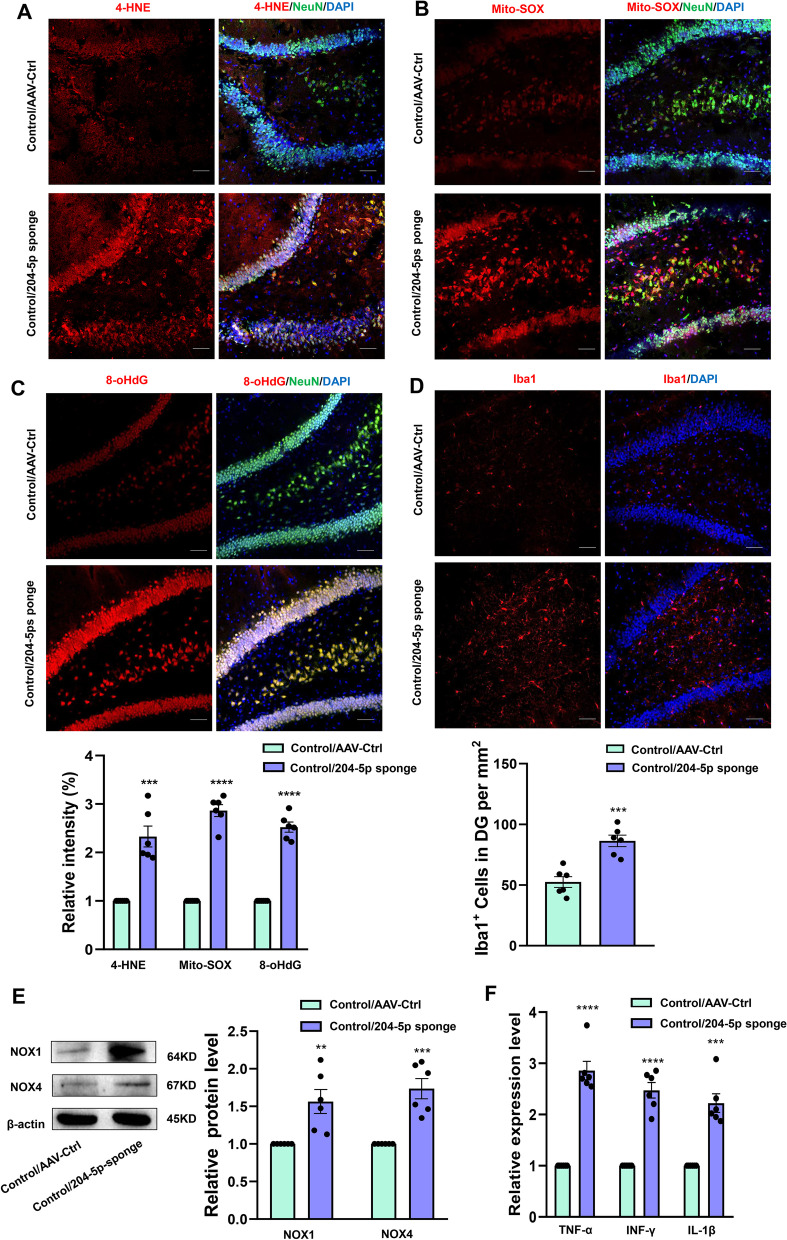
Background: Neuroinflammation occupies a pivotal position in the pathogenesis of most nervous system diseases, including depression. However, the underlying molecular mechanisms of neuroinflammation associated with neuronal injury in depression remain largely uncharacterized. Therefore, identifying potential molecular mechanisms and therapeutic targets would serve to better understand the progression of this condition. Methods: Chronic unpredictable stress (CUS) was used to induce depression-like behaviors in rats. RNA-sequencing was used to detect the differentially expressed microRNAs. Stereotactic injection of AAV virus to overexpress or knockdown the miR-204-5p. The oxidative markers and inflammatory related proteins were verified by immunoblotting or immunofluorescence assay. The oxidative stress enzyme and products were verified using enzyme-linked assay kit. Electron microscopy analysis was used to observe the synapse and ultrastructural pathology. Finally, electrophysiological recording was used to analyze the synaptic transmission. Results: Here, we found that the expression of miR-204-5p within the hippocampal dentate gyrus (DG) region of rats was significantly down-regulated after chronic unpredicted stress (CUS), accompanied with the oxidative stress-induced neuronal damage within DG region of these rats. In contrast, overexpression of miR-204-5p within the DG region of CUS rats alleviated oxidative stress and neuroinflammation by directly targeting the regulator of G protein signaling 12 (RGS12), effects which were accompanied with amelioration of depressive-like behaviors in these CUS rats. In addition, down-regulation of miR-204-5p induced neuronal deterioration in DG regions and depressive-like behaviors in rats. Conclusion: Taken together, these results suggest that miR-204-5p plays a key role in regulating oxidative stress damage in CUS-induced pathological processes of depression. Such findings provide evidence of the involvement of miR-204-5p in mechanisms underlying oxidative stress associated with depressive phenotype. Graphical Abstract:
Overview
The claims and statistics of this paper haven’t been checked yet.
Run the check — free, no account needed. It reads the open-access text and checks the sources it cites.
Integrity signals
Registry
Cites
Statistics
Figures
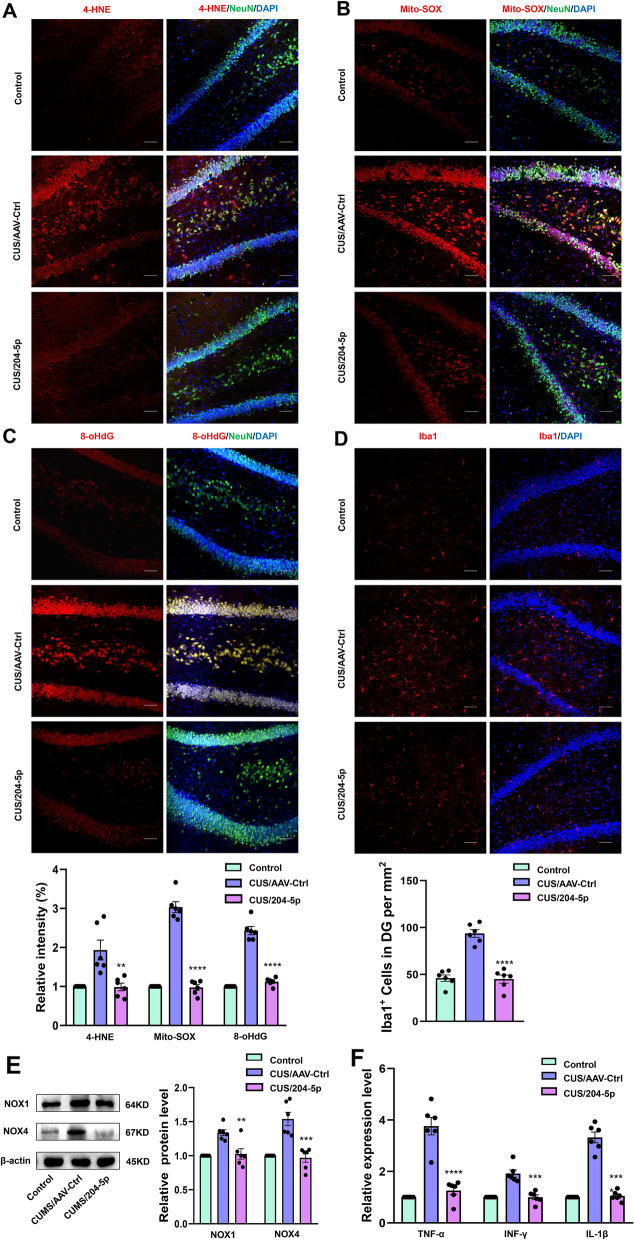
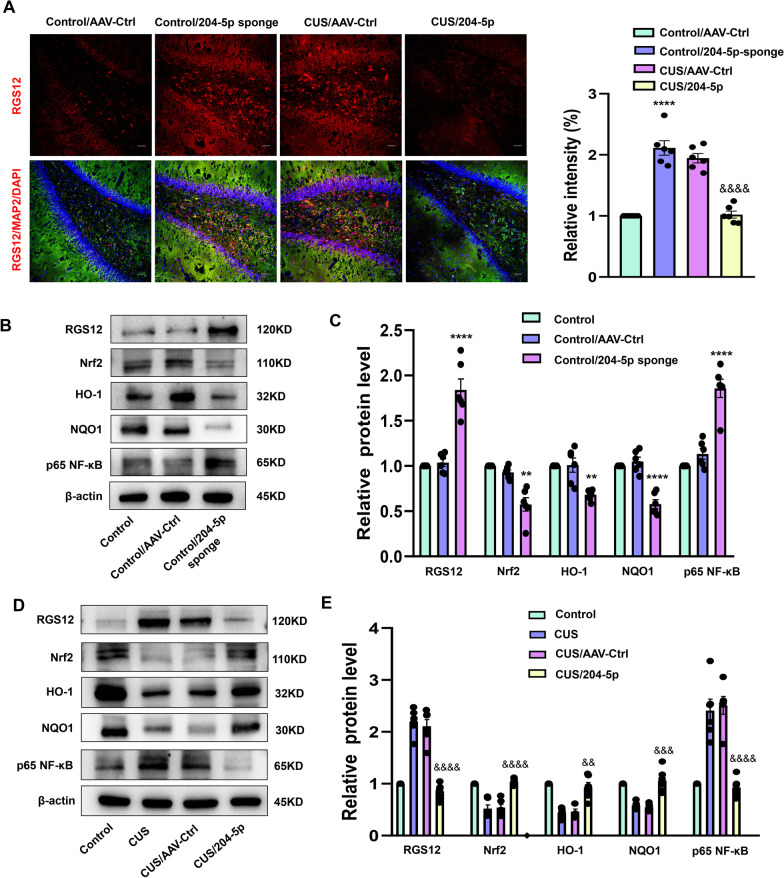
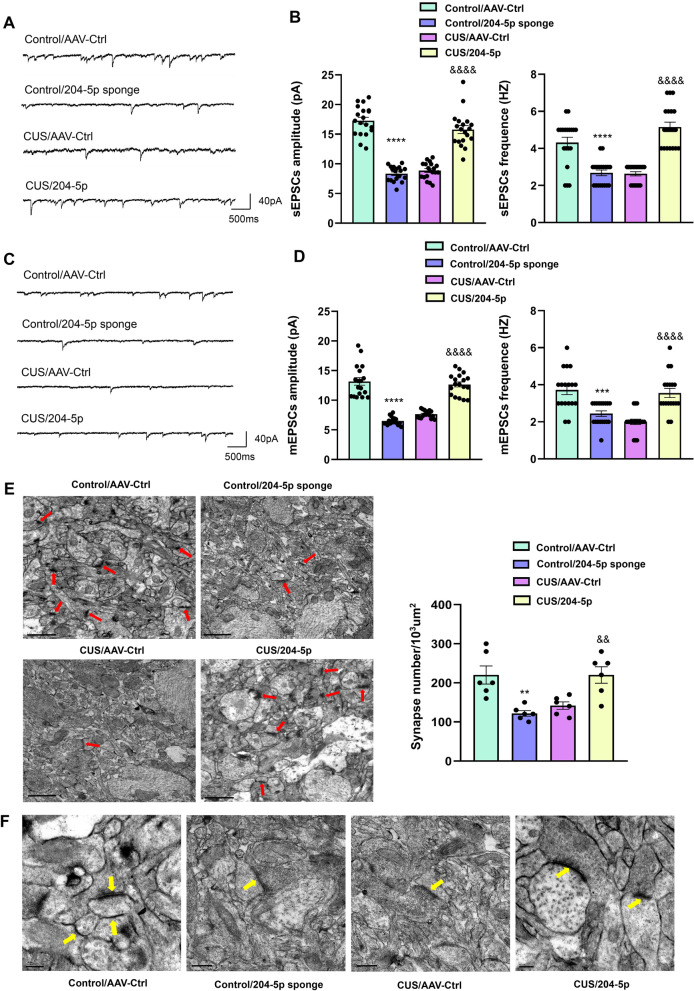
Verification
Claims the paper makes
The claims and statistics of this paper haven’t been checked yet.
Run the check — free, no account needed. It reads the open-access text and checks the sources it cites.
Claims other papers make about this one
Each is checked against this paper’s own text: does it say what the citing paper says it does?
The cited source says what the claim attributes to it.
In the citing paper
“These miRNAs—miR-124-3p, miR-204-5p, miR-328-3p, and miR-181c-5p—regulate processes such as synaptic function [48–50], inflammation, and neuronal survival [51–56], which are similarly impacted by miR-129-5p [57–60] and miR-212-5p [61–66].”
From A role for astrocytic miR-129-5p in frontotemporal dementia (2025) · cites this paper as [52]
Self-check
Percentages, sums and reported differences re-computed from the paper’s own numbers.
The self-check needs the paper’s full text.
Citations
Cites
Otte, C., Gold, S. M., Penninx, B. W., Pariante, C. M., Etkin, A., Fava, M., Mohr, D. C., & Schatzberg, A. F. (2016) · Nature Reviews Disease Primers · doi:10.1038/nrdp.2016.65 · Cited by 2,269
Wang, J., Hodes, G. E., Zhang, H., Zhang, S., Zhao, W., Golden, S. A., Bi, W., Menard, C., Kana, V., Leboeuf, M., et al. (2018) · Nature Communications · doi:10.1038/s41467-017-02794-5 · Cited by 274
The molecular and cellular mechanisms of depression: a focus on reward circuitry
Fox, M. E., & Lobo, M. K. (2019) · Molecular Psychiatry · doi:10.1038/s41380-019-0415-3 · Cited by 232
Lee, S. E., Simons, S. B., Heldt, S. A., Zhao, M., Schroeder, J. P., Vellano, C. P., Cowan, D. P., Ramineni, S., Yates, C. K., Feng, Y., et al. (2010) · Proceedings of the National Academy of Sciences · doi:10.1073/pnas.1005362107 · Cited by 224
miR-323a regulates ERBB4 and is involved in depression
Fiori, L. M., Kos, A., Lin, R., Théroux, J.-F., Lopez, J. P., Kühne, C., Eggert, C., Holzapfel, M., Huettl, R.-E., Mechawar, N., et al. (2021) · Molecular Psychiatry · doi:10.1038/s41380-020-00953-7 · Cited by 88
Research works printed but not linked: 38
- Papakostas GI, Ionescu DF. Towards new mechanisms: an update on therapeutics for treatment-resistant major depressive disorder. Mol Psychiatr. 2015;20(10):1142–50. https://doi.org/10.1038/mp.2015.92. · DOI
- Keller J, Gomez R, Williams G, Lembke A, Lazzeroni L, Murphy GM Jr, Schatzberg AF. HPA axis in major depression: cortisol, clinical symptomatology and genetic variation predict cognition. Mol Psychiatry. 2017;22(4):527–36. https://doi.org/10.1038/mp.2016.120. · DOI · Paper page
- Anisman H, Merali Z, Hayley S. Neurotransmitter, peptide and cytokine processes in relation to depressive disorder: comorbidity between depression and neurodegenerative disorders. Prog Neurobiol. 2008;85(1):1–74. https://doi.org/10.1016/j.pneurobio.2008.01.004. · DOI
- Beurel E, Toups M, Nemeroff CB. The bidirectional relationship of depression and inflammation: double trouble. Neuron. 2020;107(2):234–56. https://doi.org/10.1016/j.neuron.2020.06.002. · DOI · Paper page
- Cobley JN, Fiorello ML, Bailey DM. 13 Reasons why the brain is susceptible to oxidative stress. Redox Biol. 2018;15:490–503. https://doi.org/10.1016/j.redox.2018.01.008. · DOI · Paper page
- Szebeni A, Szebeni K, DiPeri TP, Johnson LA, Stockmeier CA, Crawford JD, Chandley MJ, Hernandez LJ, Burgess KC, Brown RW, Ordway GA. Elevated DNA oxidation and DNA repair enzyme expression in brain white matter in major depressive disorder. Int J Neuropsychopharmacol. 2017;20(5):363–73. https://doi.org/10.1093/ijnp/pyw114. · DOI · Paper page
- Jimenez-Fernandez S, Gurpegui M, Diaz-Atienza F, Perez-Costillas L, Gerstenberg M, Correll CU. Oxidative stress and antioxidant parameters in patients with major depressive disorder compared to healthy controls before and after antidepressant treatment: results from a meta-analysis. J Clin Psychiatry. 2015;76(12):1658–67. https://doi.org/10.4088/JCP.14r09179. · DOI
- Ambros V. The functions of animal microRNAs. Nature. 2004;431(7006):350–5. https://doi.org/10.1038/nature02871. · DOI · Paper page
- Fabian MR, Sonenberg N. The mechanics of miRNA-mediated gene silencing: a look under the hood of miRISC. Nat Struct Mol Biol. 2012;19(6):586–93. https://doi.org/10.1038/nsmb.2296. · DOI
- Sun P, Liu DZ, Jickling GC, Sharp FR, Yin KJ. MicroRNA-based therapeutics in central nervous system injuries. J Cereb Blood Flow Metab. 2018;38(7):1125–48. https://doi.org/10.1177/0271678X18773871. · DOI · Paper page
- Mouillet-Richard S, Baudry A, Launay JM, Kellermann O. MicroRNAs and depression. Neurobiol Dis. 2012;46(2):272–8. https://doi.org/10.1016/j.nbd.2011.12.035. · DOI
- Eacker SM, Dawson TM, Dawson VL. The interplay of microRNA and neuronal activity in health and disease. Front Cell Neurosci. 2013;7:136. https://doi.org/10.3389/fncel.2013.00136. · DOI
- Antoniuk S, Bijata M, Ponimaskin E, Wlodarczyk J. Chronic unpredictable mild stress for modeling depression in rodents: meta-analysis of model reliability. Neurosci Biobehav Rev. 2019;99:101–16. https://doi.org/10.1016/j.neubiorev.2018.12.002. · DOI · Paper page
- Mao QQ, Ip SP, Ko KM, Tsai SH, Che CT. Peony glycosides produce antidepressant-like action in mice exposed to chronic unpredictable mild stress: effects on hypothalamic-pituitary-adrenal function and brain-derived neurotrophic factor. Prog Neuropsychopharmacol Biol Psychiatry. 2009;33(7):1211–6. https://doi.org/10.1016/j.pnpbp.2009.07.002. · DOI
- Vlachos IS, Kostoulas N, Vergoulis T, Georgakilas G, Reczko M, Maragkakis M, Paraskevopoulou MD, Prionidis K, Dalamagas T, Hatzigeorgiou AG. DIANA miRPath v.2.0: investigating the combinatorial effect of microRNAs in pathways. Nucleic Acids Res. 2012;40(1):W498-504. https://doi.org/10.1093/nar/gks494. · DOI
- Kanehisa M, Sato Y, Kawashima M, Furumichi M, Tanabe M. KEGG as a reference resource for gene and protein annotation. Nucleic Acids Res. 2016;44(D1):D457–62. https://doi.org/10.1093/nar/gkv1070. · DOI · Paper page
- Bidinosti M, Ran I, Sanchez-Carbente MR, Martineau Y, Gingras AC, Gkogkas C, Raught B, Bramham CR, Sossin WS, Costa-Mattioli M, DesGroseillers L, Lacaille JC, Sonenberg N. Postnatal deamidation of 4E-BP2 in brain enhances its association with raptor and alters kinetics of excitatory synaptic transmission. Mol Cell. 2010;37(6):797–808. https://doi.org/10.1016/j.molcel.2010.02.022. · DOI
- Patel M. Targeting oxidative stress in central nervous system disorders. Trends Pharmacol Sci. 2016;37(9):768–78. https://doi.org/10.1016/j.tips.2016.06.007. · DOI · Paper page
- Klein JA, Ackerman SL. Oxidative stress, cell cycle, and neurodegeneration. J Clin Invest. 2003;111(6):785–93. https://doi.org/10.1172/JCI18182. · DOI
- Black CN, Bot M, Scheffer PG, Cuijpers P, Penninx BW. Is depression associated with increased oxidative stress? A systematic review and meta-analysis. Psychoneuroendocrinology. 2015;51:164–75. https://doi.org/10.1016/j.psyneuen.2014.09.025. · DOI · Paper page
- Boldrini M, Santiago AN, Hen R, Dwork AJ, Rosoklija GB, Tamir H, Arango V, John Mann J. Hippocampal granule neuron number and dentate gyrus volume in antidepressant-treated and untreated major depression. Neuropsychopharmacology. 2013;38(6):1068–77. https://doi.org/10.1038/npp.2013.5. · DOI · Paper page
- Gulyaeva NV. Functional neurochemistry of the ventral and dorsal hippocampus: stress depression, dementia and remote hippocampal damage. Neurochem Res. 2019;44(6):1306–22. https://doi.org/10.1007/s11064-018-2662-0. · DOI
- Weisz HA, Kennedy D, Widen S, Spratt H, Sell SL, Bailey C, Sheffield-Moore M, DeWitt DS, Prough DS, Levin H, Robertson C, Hellmich HL. MicroRNA sequencing of rat hippocampus and human biofluids identifies acute, chronic, focal and diffuse traumatic brain injuries. Sci Rep. 2020;10(1):3341. https://doi.org/10.1038/s41598-020-60133-z. · DOI
- Strycharz J, Wroblewski A, Zieleniak A, Swiderska E, Matyjas T, Rucinska M, Pomorski L, Czarny P, Szemraj J, Drzewoski J, Sliwinska A. Visceral adipose tissue of prediabetic and diabetic females shares a set of similarly upregulated microRNAs functionally annotated to inflammation, oxidative stress and insulin signaling. Antioxidants (Basel). 2021. https://doi.org/10.3390/antiox10010101. · DOI
- Civelek M, Hagopian R, Pan C, Che N, Yang WP, Kayne PS, Saleem NK, Cederberg H, Kuusisto J, Gargalovic PS, Kirchgessner TG, Laakso M, Lusis AJ. Genetic regulation of human adipose microRNA expression and its consequences for metabolic traits. Hum Mol Genet. 2013;22(15):3023–37. https://doi.org/10.1093/hmg/ddt159. · DOI · Paper page
- Houzelle A, Dahlmans D, Nascimento EBM, Schaart G, Jorgensen JA, Moonen-Kornips E, Kersten S, Wang X, Hoeks J. MicroRNA-204-5p modulates mitochondrial biogenesis in C2C12 myotubes and associates with oxidative capacity in humans. J Cell Physiol. 2020;235(12):9851–63. https://doi.org/10.1002/jcp.29797. · DOI
- Miller AH, Maletic V, Raison CL. Inflammation and its discontents: the role of cytokines in the pathophysiology of major depression. Biol Psychiatry. 2009;65(9):732–41. https://doi.org/10.1016/j.biopsych.2008.11.029. · DOI · Paper page
- Neubig RR, Siderovski DP. Regulators of G-protein signalling as new central nervous system drug targets. Nat Rev Drug Discov. 2002;1(3):187–97. https://doi.org/10.1038/nrd747. · DOI
- Hollinger S, Hepler JR. Cellular regulation of RGS proteins: modulators and integrators of G protein signaling. Pharmacol Rev. 2002;54(3):527–59. https://doi.org/10.1124/pr.54.3.527. · DOI
- Squires KE, Montanez-Miranda C, Pandya RR, Torres MP, Hepler JR. Genetic analysis of rare human variants of regulators of G protein signaling proteins and their role in human physiology and disease. Pharmacol Rev. 2018;70(3):446–74. https://doi.org/10.1124/pr.117.015354. · DOI
- Talbot JN, Jutkiewicz EM, Graves SM, Clemans CF, Nicol MR, Mortensen RM, Huang X, Neubig RR, Traynor JR. RGS inhibition at G(alpha)i2 selectively potentiates 5-HT1A-mediated antidepressant effects. Proc Natl Acad Sci U S A. 2010;107(24):11086–91. https://doi.org/10.1073/pnas.1000003107. · DOI
- Senese NB, Rasenick MM, Traynor JR. The role of G-proteins and G-protein regulating proteins in depressive disorders. Front Pharmacol. 2018;9:1289. https://doi.org/10.3389/fphar.2018.01289. · DOI
- Snow BE, Hall RA, Krumins AM, Brothers GM, Bouchard D, Brothers CA, Chung S, Mangion J, Gilman AG, Lefkowitz RJ, Siderovski DP. GTPase activating specificity of RGS12 and binding specificity of an alternatively spliced PDZ (PSD-95/Dlg/ZO-1) domain. J Biol Chem. 1998;273(28):17749–55. https://doi.org/10.1074/jbc.273.28.17749. · DOI
- Ng AYH, Li Z, Jones MM, Yang S, Li C, Fu C, Tu C, Oursler MJ, Qu J, Yang S. Regulator of G protein signaling 12 enhances osteoclastogenesis by suppressing Nrf2-dependent antioxidant proteins to promote the generation of reactive oxygen species. Elife. 2019. https://doi.org/10.7554/eLife.42951. · DOI
- Yuan G, Yang S, Ng A, Fu C, Oursler MJ, Xing L, Yang S. RGS12 is a novel critical NF-kappaB activator in inflammatory arthritis. iScience. 2020;23(6): 101172. https://doi.org/10.1016/j.isci.2020.101172. · DOI
- Neves G, Cooke SF, Bliss TV. Synaptic plasticity, memory and the hippocampus: a neural network approach to causality. Nat Rev Neurosci. 2008;9(1):65–75. https://doi.org/10.1038/nrn2303. · DOI
- Cheng A, Hou Y, Mattson MP. Mitochondria and neuroplasticity. ASN Neuro. 2010;2(5): e00045. https://doi.org/10.1042/AN20100019. · DOI
- Lopez-Aranda MF, Acevedo MJ, Carballo FJ, Gutierrez A, Khan ZU. Localization of the GoLoco motif carrier regulator of G-protein signalling 12 and 14 proteins in monkey and rat brain. Eur J Neurosci. 2006;23(11):2971–82. https://doi.org/10.1111/j.1460-9568.2006.04838.x. · DOI
Cited by
Sorted by citations
A role for astrocytic miR-129-5p in frontotemporal dementia
Kaurani, L., Pradhan, R., Schröder, S., Burkhardt, S., Schuetz, A.-L., Krüger, D. M., Pena, T., Heutink, P., Sananbenesi, F., & Fischer, A. (2025) · Translational Psychiatry · doi:10.1038/s41398-025-03338-y · Cited by 10
Metadata
- Authors
- Lan, T., Li, Y., Fan, C., Wang, L., Wang, W., Chen, S., & Yu, S. Y.
- ORCID
- Yu, Shu Yan
- Venue
- Journal of Neuroinflammation
- Published
- 2021-10-21
- Volume
- 18
- Issue
- 1
- ISSN
- 1742-2094
- PMC
- PMC8532383
- Cited by
- 38
- References
- 5
- Language
- en
- Funders
- national natural science foundation of china (NSFC81873796, NSFC82071513)
- natural science foundation of shandong province (ZR2020ZD25)
About these checks
Registry, retraction, Cites and statistics results are computed, not judged, with one exception: a printed reference that no index lists is read once by a model before it counts as a citation error. Claims are extracted by a model and kept only when their quote appears verbatim in the text; each cited source is then checked, with a model’s help, for whether it says what the claim relies on. Those verdicts can be wrong — read the claim’s quote and the cited source before relying on one.
Statistics and arithmetic are recomputed, not judged.
Confidence bands are shown only for fields calibrated on our annotated test set. None is calibrated yet, so no band is shown.
What counts as a claim ›How we measure confidence ›How we check this ›
Are you an author, or do you see a problem with this page? Request a review
