

The DOI matches its Crossref record; 51 of the 51 references it cites were found in a registry or an index.
Opposing effects of viral mediated brain expression of apolipoprotein E2 (apoE2) and apoE4 on apoE lipidation and Aβ metabolism in apoE4-targeted replacement mice
Open accessAbstract
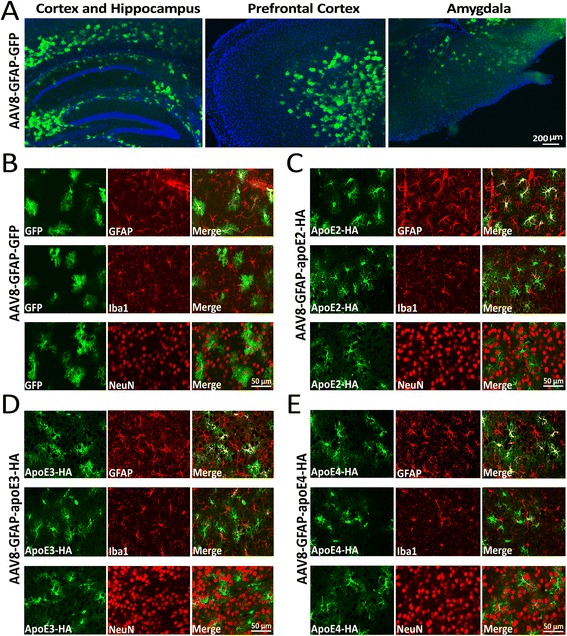
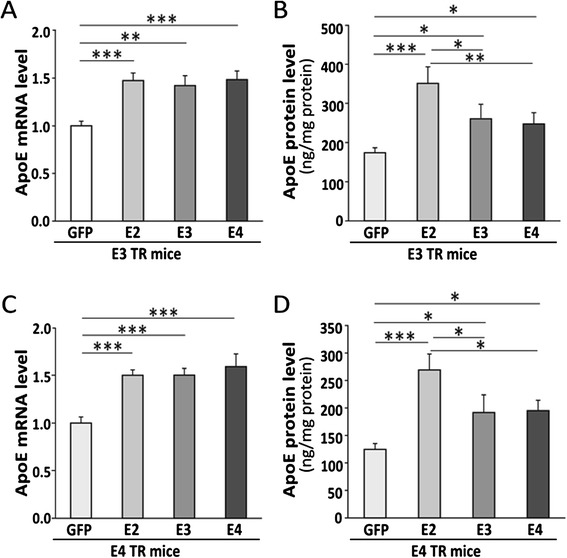
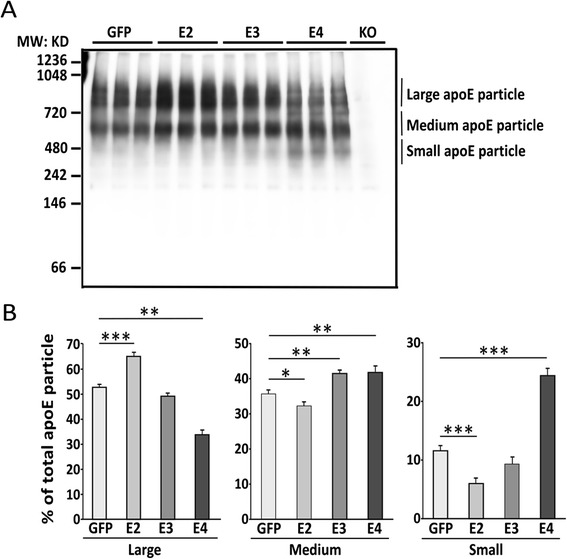
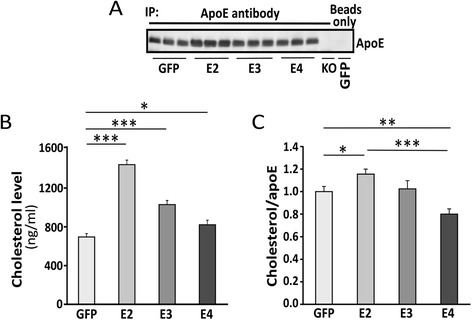
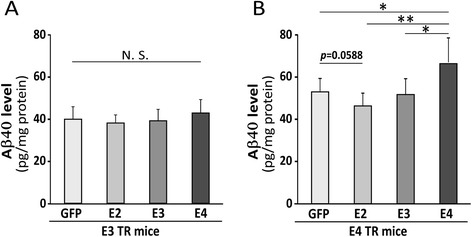
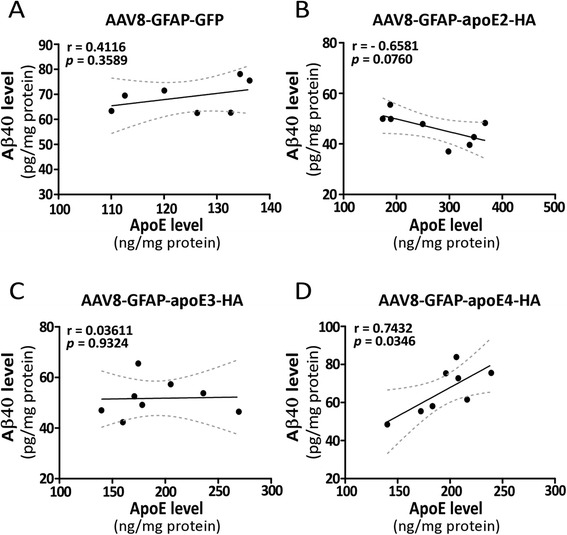
BACKGROUND: Human apolipoprotein E (apoE) exists in three major isoforms: apoE2, apoE3 and apoE4. In the brain, apoE is produced mostly by astrocytes and transports cholesterol to neurons via apoE receptors. Among the gene alleles encoding the three isoforms, the APOE4 allele is the strongest genetic risk factor for late-onset Alzheimer's disease (AD), whereas APOE2 is protective. ApoE4 confers a gain of toxic function, a loss of neuroprotective function or a combination of both in AD pathogenesis. Given that therapeutic impacts of modulating apoE expression may be isoform-dependent, we sought to investigate the relationship between overexpressing apoE isoform and apoE-related functions in apoE-targeted replacement (TR) mice. Specifically, apoE isoform expression driven by the astrocyte-specific glial fibrillary acidic protein (GFAP) promoter was built into an adeno-associated virus serotype 8 (AAV8) vector and injected into the ventricles of postnatal day 2 (P2) apoE3-TR or apoE4-TR mice. Upon confirmation of apoE isoform expression, effects on apoE lipidation and the levels of amyloid-β (Aβ) in the brain were assessed. RESULTS: AAV8-GFAP-apoE isoforms were specifically expressed in astrocytes throughout all brain regions, which led to overall increased apoE levels in the brain. Viral mediated overexpression of apoE4 in the apoE4-TR background increased poorly-lipidated apoE lipoprotein particles and decreased apoE-associated cholesterol in apoE4-TR mice. Conversely, apoE2 overexpression in apoE4-TR mice enhanced apoE lipidation and associated cholesterol. Furthermore, overexpression of apoE4 elevated the levels of endogenous Aβ, whereas apoE2 overexpression trended to lower endogenous Aβ. CONCLUSIONS: Overexpression of apoE isoforms induces differential effects in the apoE4-TR background: apoE4 decreases apoE lipidation and enhances Aβ accumulation, whereas apoE2 has the opposite effects. Our findings suggest that increasing apoE2 in APOE4 carriers is a beneficial strategy to treat AD, whereas increasing apoE4 in APOE4 carriers is likely harmful. We have also established novel methods to express apoE isoforms in mouse brain to study apoE-related pathways in AD and related dementia.
Overview
The claims and statistics of this paper haven’t been checked yet.
Run the check — free, no account needed. It reads the open-access text and checks the sources it cites.
Integrity signals
Registry
Cites
Statistics
Figures
Verification
Claims the paper makes
The claims and statistics of this paper haven’t been checked yet.
Run the check — free, no account needed. It reads the open-access text and checks the sources it cites.
Claims other papers make about this one
Each is checked against this paper’s own text: does it say what the citing paper says it does?
The source backs part of the claim, not all of it — or backs it for a different population, condition or comparison.
In the citing paper
“In humans, three major isoforms of APOE are lipidated in an isoform‐specific manner (ε2 > ε3 > ε4). 9 , 48”
From Deletion of miR-33, a regulator of the ABCA1–APOE pathway, ameliorates neuropathological phenotypes in APP/PS1 mice (2024) · cites this paper as [9]
Experimental — accuracy not yet measuredThe source backs part of the claim, not all of it — or backs it for a different population, condition or comparison.
In the citing paper
“In addition, lipid-poor apoE has been suggested to have greater susceptibility to aggregation, which may impair Aβ clearance and promote Aβ deposition (22).”
From APOE3 -Jacksonville (V236E) variant reduces self-aggregation and risk of dementia (2021) · cites this paper as [22]
Experimental — accuracy not yet measuredThe source backs part of the claim, not all of it — or backs it for a different population, condition or comparison.
In the citing paper
“Our AAV-GFAP-APOE-HA construct has been previously validated [10] to produce correctly sized, secreted, and lipidated APOE”
From Astrocytic APOE3-Christchurch expression ameliorates brain amyloid-β pathology in 5xFAD mice (2026) · cites this paper as [10]
Experimental — accuracy not yet measuredThe source backs part of the claim, not all of it — or backs it for a different population, condition or comparison.
In the citing paper
“ABCA1 reduction is considered one of the reasons why ApoE4-containing lipoproteins are poorly lipidated [69,70]”
From ApoE3 vs. ApoE4 Astrocytes: A Detailed Analysis Provides New Insights into Differences in Cholesterol Homeostasis (2022) · cites this paper as [69]
Experimental — accuracy not yet measuredThe cited source says what the claim attributes to it.
In the citing paper
“These small, poorly lipidated apoE particles are similar in size to apoE ε4 particles, further highlighting apoE lipidation as a crucial factor in AD pathogenesis. 8 , 9”
From Deletion of miR-33, a regulator of the ABCA1–APOE pathway, ameliorates neuropathological phenotypes in APP/PS1 mice (2024) · cites this paper as [9]
The cited source says what the claim attributes to it.
In the citing paper
“These small, poorly lipidated apoE particles are similar in size to apoE ε4 particles, further highlighting apoE lipidation as a crucial factor in AD pathogenesis. 8 , 9”
From Deletion of miR-33, a regulator of the ABCA1–APOE pathway, ameliorates neuropathological phenotypes in APP/PS1 mice (2024) · cites this paper as [9]
The cited source says what the claim attributes to it.
In the citing paper
“Imperatively, the aggregation propensity of apoE likely influences its lipidation capacity (22), as dissociation of apoE oligomers to monomers appears to be required for lipid binding to the protein (46).”
From APOE3 -Jacksonville (V236E) variant reduces self-aggregation and risk of dementia (2021) · cites this paper as [22]
The cited source says what the claim attributes to it.
In the citing paper
“apoE4-lipoproteins are poorly lipidated compared to apoE3-lipoproteins.”
From Inhibition of ACAT as a Therapeutic Target for Alzheimer's Disease Is Independent of ApoE4 Lipidation (2023) · cites this paper as [18]
Self-check
Percentages, sums and reported differences re-computed from the paper’s own numbers.
The self-check needs the paper’s full text.
Citations
Cites
The Amyloid Hypothesis of Alzheimer’s Disease: Progress and Problems on the Road to Therapeutics
Hardy, J., & Selkoe, D. J. (2002) · Science · doi:10.1126/science.1072994 · Cited by 13,864
Amyloid oligomers exacerbate tau pathology in a mouse model of tauopathy
Selenica, M.-L. B., Brownlow, M., Jimenez, J. P., Lee, D. C., Pena, G., Dickey, C. A., Gordon, M. N., & Morgan, D. (2013) · Neurodegenerative Diseases · doi:10.1159/000337230 · Cited by 10,359
Corder, E. H., Saunders, A. M., Strittmatter, W. J., Schmechel, D. E., Gaskell, P. C., Small, G. W., Roses, A. D., Haines, J. L., & Pericak-Vance, M. A. (1993) · Science · doi:10.1126/science.8346443 · Cited by 9,429
Apolipoprotein E and Alzheimer disease: risk, mechanisms and therapy
Liu, C.-C., Kanekiyo, T., Xu, H., & Bu, G. (2013) · Nature Reviews Neurology · doi:10.1038/nrneurol.2012.263 · Cited by 3,459
Self-citation2013 Alzheimer's disease facts and figures
Thies, W. H., & Bleiler, L. (2013) · Alzheimer s & Dementia · doi:10.1016/j.jalz.2013.02.003 · Cited by 3,372
The molecular pathology of Alzheimer's disease
Selkoe, D. J. (1991) · Neuron · doi:10.1016/0896-6273(91)90052-2 · Cited by 2,708
Decreased Clearance of CNS β-Amyloid in Alzheimer’s Disease
Mawuenyega, K. G., Sigurdson, W., Ovod, V., Munsell, L., Kasten, T., Morris, J. C., Yarasheski, K. E., & Bateman, R. J. (2010) · Science · doi:10.1126/science.1197623 · Cited by 2,078
Protective effect of apolipoprotein E type 2 allele for late onset Alzheimer disease
Corder, E. H., Saunders, A. M., Risch, N. J., Strittmatter, W. J., Schmechel, D. E., Gaskell, P. C., Rimmler, J. B., Locke, P. A., Conneally, P. M., Schmader, K. E., et al. (1994) · Nature Genetics · doi:10.1038/ng0694-180 · Cited by 1,920
The role of apolipoprotein E in Alzheimer's disease
Kim, J., Basak, J. M., & Holtzman, D. M. (2009) · Neuron · doi:10.1016/j.neuron.2009.06.026 · Cited by 1,661
Human ApoE isoforms differentially regulate brain amyloid-β peptide clearance
Castellano, J. M., Kim, J., Stewart, F. R., Jiang, H., DeMattos, R. B., Patterson, B. W., Fagan, A. M., Morris, J. C., Mawuenyega, K. G., Cruchaga, C., et al. (2011) · Science Translational Medicine · doi:10.1126/scitranslmed.3002156 · Cited by 1,242 · cited 3×
“Previous studies have shown that brain Aβ levels and amyloid plaque loads are apoE isoform-dependent (E4 > E3 > E2) both in humans and in AD transgenic mouse models [11-13].”
Background
Cited by
Sorted by citations
Alzheimer Disease: An Update on Pathobiology and Treatment Strategies
Long, J. M., & Holtzman, D. M. (2019) · Cell · doi:10.1016/j.cell.2019.09.001 · Cited by 3,204
Apolipoprotein E and Alzheimer disease: pathobiology and targeting strategies
Yamazaki, Y., Zhao, N., Caulfield, T. R., Liu, C.-C., & Bu, G. (2019) · Nature Reviews Neurology · doi:10.1038/s41582-019-0228-7 · Cited by 1,425
Self-citationAPOE and Alzheimer’s disease: Advances in genetics, pathophysiology, and therapeutic approaches
Serrano-Pozo, A., Das, S., & Hyman, B. T. (2021) · The Lancet Neurology · doi:10.1016/s1474-4422(20)30412-9 · Cited by 1,037
ApoE in Alzheimer’s disease: pathophysiology and therapeutic strategies
Raulin, A.-C., Doss, S. V., Trottier, Z. A., Ikezu, T. C., Bu, G., & Liu, C.-C. (2022) · Molecular Neurodegeneration · doi:10.1186/s13024-022-00574-4 · Cited by 756
Self-citationApoE4: an emerging therapeutic target for Alzheimer’s disease
Safieh, M., Korczyn, A. D., & Michaelson, D. M. (2019) · BMC Medicine · doi:10.1186/s12916-019-1299-4 · Cited by 449
Metadata
- Authors
- Hu, J., Liu, C.-C., Chen, X.-F., Zhang, Y.-W., Xu, H., & Bu, G.
- Affiliations
- Xiamen University (CN)
- Mayo Clinic (US)
- Corresponding author
- Bu, Guojun
- Venue
- Molecular Neurodegeneration
- Published
- 2015-03-05
- Volume
- 10
- Issue
- 1
- Pages
- 6-6
- ISSN
- 1750-1326 (ISSN-L)
- PMC
- PMC4356137
- OpenAlex
- W2111723622
- Cited by
- 161
- References
- 51
- Citations by year
- 2026: 7 · 2025: 24 · 2024: 25 · 2023: 13 · 2022: 14 · 2021: 17 · 2020: 16 · 2019: 13 · 2018: 7 · 2017: 12 · 2016: 12 · 2015: 1
- FWCI
- 7.86
- Type
- journal article
- Language
- en
- Open access
- gold
- doi.org
- Locations
- Molecular Neurodegeneration (publishedVersion, cc-by)
- PubMed Central (publishedVersion, cc-by)
- PubMed (publishedVersion)
- Rare & Special e-Zone (The Hong Kong University of Science and Technology) (submittedVersion)
- Funders
- Alzheimer's Association
- Hope Center for Neurological Disorders
- National Institutes of Health
- National Institute on Aging (P01AG030128, R01AG027924, RF1AG046205, R01AG046205, R01AG035355, P50AG016574)
- National Institute of Neurological Disorders and Stroke (P30NS057105, P01NS074969)
- Topics
- Life Sciences › Neuroscience › Cellular and Molecular Neuroscience › Alzheimer's disease research and treatments
- Life Sciences › Neuroscience › Neurology › Neuroinflammation and Neurodegeneration Mechanisms
- Life Sciences › Neuroscience › Neurology › Barrier Structure and Function Studies
- Keywords
- apolipoprotein E isoforms, APOE2, APOE ε4, amyloid-beta metabolism, AAV8 vector, glial fibrillary acidic protein promoter, Alzheimer's disease, APOE ε4 carriers
- MeSH terms
- Dependovirus, Alzheimer Disease, Animals, Astrocytes, Brain, Disease Models, Animal, Humans, Mice, Transgenic, Neurons, Amyloid beta-Peptides, Apolipoprotein E4, Apolipoprotein E2
About these checks
Registry, retraction, Cites and statistics results are computed, not judged, with one exception: a printed reference that no index lists is read once by a model before it counts as a citation error. Claims are extracted by a model and kept only when their quote appears verbatim in the text; each cited source is then checked, with a model’s help, for whether it says what the claim relies on. Those verdicts can be wrong — read the claim’s quote and the cited source before relying on one.
Statistics and arithmetic are recomputed, not judged.
Confidence bands are shown only for fields calibrated on our annotated test set. None is calibrated yet, so no band is shown.
What counts as a claim ›How we measure confidence ›How we check this ›
Are you an author, or do you see a problem with this page? Request a review
