

The DOI matches its Crossref record; 37 of the 37 references it cites were found in a registry or an index.
Inhibition of O-GlcNAcase leads to elevation of O-GlcNAc tau and reduction of tauopathy and cerebrospinal fluid tau in rTg4510 mice
Open accessAbstract
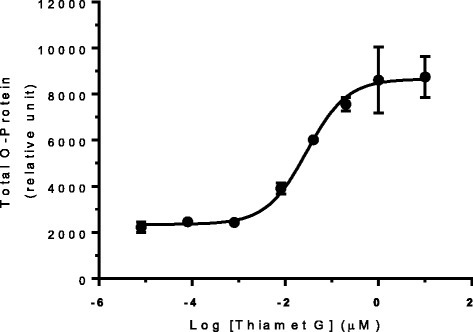
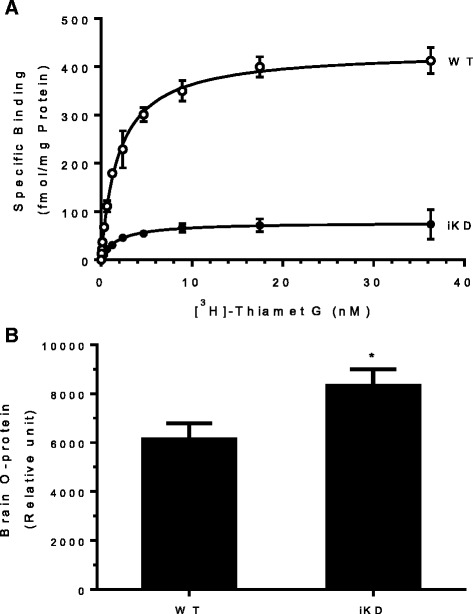
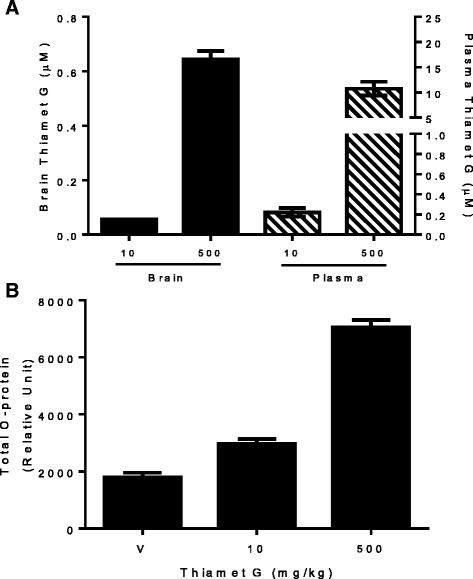
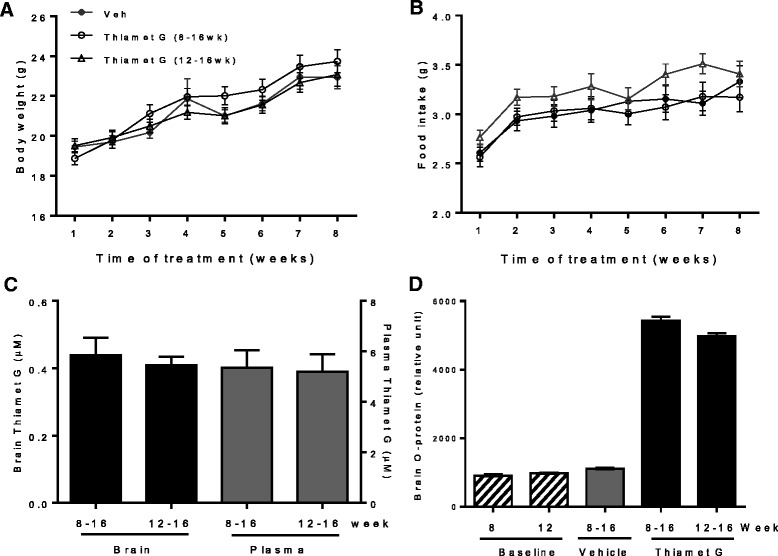
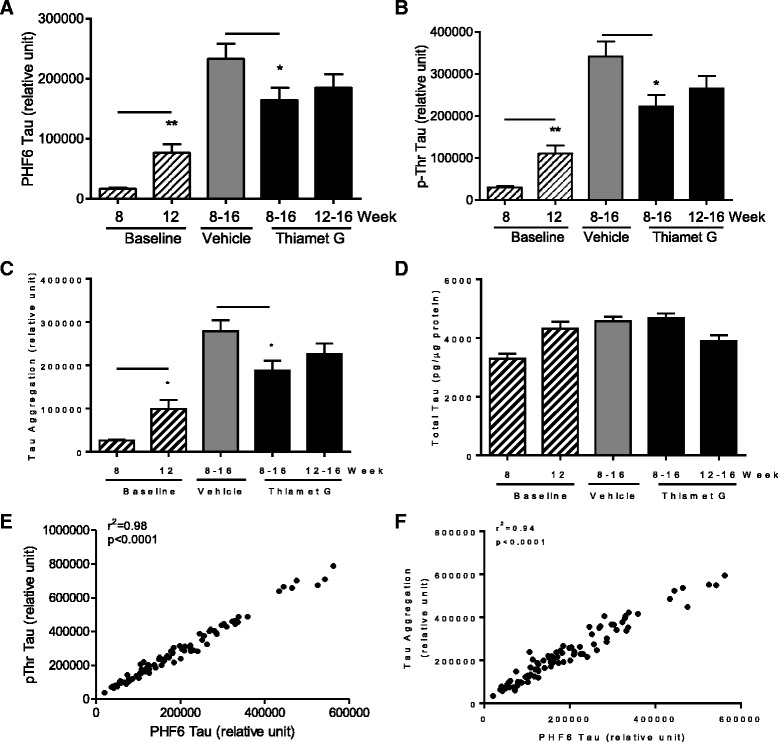
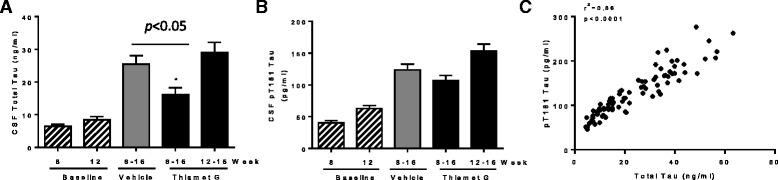
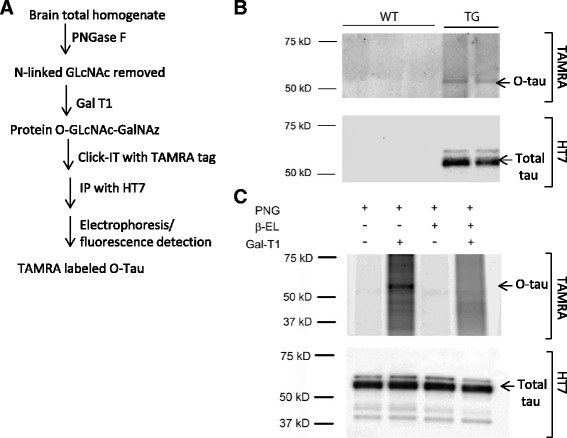
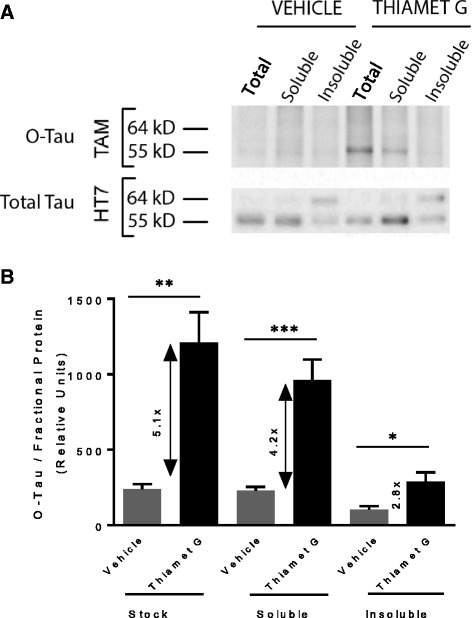
BACKGROUND: Hyperphosphorylation of microtubule-associated protein tau is a distinct feature of neurofibrillary tangles (NFTs) that are the hallmark of neurodegenerative tauopathies. O-GlcNAcylation is a lesser known post-translational modification of tau that involves the addition of N-acetylglucosamine onto serine and threonine residues. Inhibition of O-GlcNAcase (OGA), the enzyme responsible for the removal of O-GlcNAc modification, has been shown to reduce tau pathology in several transgenic models. Clarifying the underlying mechanism by which OGA inhibition leads to the reduction of pathological tau and identifying translatable measures to guide human dosing and efficacy determination would significantly facilitate the clinical development of OGA inhibitors for the treatment of tauopathies. METHODS: Genetic and pharmacological approaches are used to evaluate the pharmacodynamic response of OGA inhibition. A panel of quantitative biochemical assays is established to assess the effect of OGA inhibition on pathological tau reduction. A "click" chemistry labeling method is developed for the detection of O-GlcNAcylated tau. RESULTS: Substantial (>80%) OGA inhibition is required to observe a measurable increase in O-GlcNAcylated proteins in the brain. Sustained and substantial OGA inhibition via chronic treatment with Thiamet G leads to a significant reduction of aggregated tau and several phosphorylated tau species in the insoluble fraction of rTg4510 mouse brain and total tau in cerebrospinal fluid (CSF). O-GlcNAcylated tau is elevated by Thiamet G treatment and is found primarily in the soluble 55 kD tau species, but not in the insoluble 64 kD tau species thought as the pathological entity. CONCLUSION: The present study demonstrates that chronic inhibition of OGA reduces pathological tau in the brain and total tau in the CSF of rTg4510 mice, most likely by directly increasing O-GlcNAcylation of tau and thereby maintaining tau in the soluble, non-toxic form by reducing tau aggregation and the accompanying panoply of deleterious post-translational modifications. These results clarify some conflicting observations regarding the effects and mechanism of OGA inhibition on tau pathology, provide pharmacodynamic tools to guide human dosing and identify CSF total tau as a potential translational biomarker. Therefore, this study provides additional support to develop OGA inhibitors as a treatment for Alzheimer's disease and other neurodegenerative tauopathies.
Overview
The claims and statistics of this paper haven’t been checked yet.
Run the check — free, no account needed. It reads the open-access text and checks the sources it cites.
Integrity signals
Registry
Cites
Statistics
Figures
Verification
Claims the paper makes
The claims and statistics of this paper haven’t been checked yet.
Run the check — free, no account needed. It reads the open-access text and checks the sources it cites.
Claims other papers make about this one
Each is checked against this paper’s own text: does it say what the citing paper says it does?
In the citing paper
“Inhibitors of the O-GlcNAcase enzyme (OGA)-like thiamet G increase tau glycosylation, reduce NFTs and neuronal cell death, improve motor behavior, and prolong survival of tau transgenic mice [174, 220, 221].”
From Tau and neuroinflammation in Alzheimer’s disease: interplay mechanisms and clinical translation (2023) · cites this paper as [220]
Self-check
Percentages, sums and reported differences re-computed from the paper’s own numbers.
The self-check needs the paper’s full text.
Citations
Cites
Amyloid oligomers exacerbate tau pathology in a mouse model of tauopathy
Selenica, M.-L. B., Brownlow, M., Jimenez, J. P., Lee, D. C., Pena, G., Dickey, C. A., Gordon, M. N., & Morgan, D. (2013) · Neurodegenerative Diseases · doi:10.1159/000337230 · Cited by 10,359
Wessel, D., & Flügge, U. (1984) · Analytical Biochemistry · doi:10.1016/0003-2697(84)90782-6 · Cited by 3,997
Association of missense and 5′-splice-site mutations in tau with the inherited dementia FTDP-17
Hutton, M., Lendon, C. L., Rizzu, P., Baker, M., Froelich, S., Houlden, H., Pickering-Brown, S., Chakraverty, S., Isaacs, A., Grover, A., et al. (1998) · Nature · doi:10.1038/31508 · Cited by 3,498
Lee, V. M.-Y., Goedert, M., & Trojanowski, J. Q. (2001) · Annual Review of Neuroscience · doi:10.1146/annurev.neuro.24.1.1121 · Cited by 2,480
Tau Suppression in a Neurodegenerative Mouse Model Improves Memory Function
SantaCruz, K., Lewis, J., Spires, T., Paulson, J., Kotilinek, L., Ingelsson, M., Guimaraes, A., DeTure, M., Ramsden, M., McGowan, E., et al. (2005) · Science · doi:10.1126/science.1113694 · Cited by 2,014
Cerebrospinal fluid and plasma biomarkers in Alzheimer disease
Blennow, K., Hampel, H., Weiner, M., & Zetterberg, H. (2010) · Nature Reviews Neurology · doi:10.1038/nrneurol.2010.4 · Cited by 1,863
Hart, G. W., Slawson, C., Ramirez-Correa, G., & Lagerlof, O. (2011) · Annual Review of Biochemistry · doi:10.1146/annurev-biochem-060608-102511 · Cited by 1,317
Tau pathology and neurodegeneration
Spillantini, M. G., & Goedert, M. (2013) · The Lancet Neurology · doi:10.1016/s1474-4422(13)70090-5 · Cited by 1,133
Biochemistry and Cell Biology of Tau Protein in Neurofibrillary DegenerationPreprint
Mandelkow, E., & Mandelkow, E. (2012) · Cold Spring Harbor Perspectives in Medicine · doi:10.1101/cshperspect.a006247 · Cited by 897
A potent mechanism-inspired O-GlcNAcase inhibitor that blocks phosphorylation of tau in vivo
Yuzwa, S. A., Macauley, M. S., Heinonen, J. E., Shan, X., Dennis, R. J., He, Y., Whitworth, G. E., Stubbs, K. A., McEachern, E. J., Davies, G. J., et al. (2008) · Nature Chemical Biology · doi:10.1038/nchembio.96 · Cited by 717
Self-citationRamsden, M., Kotilinek, L., Forster, C., Paulson, J., McGowan, E., SantaCruz, K., Guimaraes, A., Yue, M., Lewis, J., Carlson, G., et al. (2005) · The Journal of Neuroscience · doi:10.1523/jneurosci.3279-05.2005 · Cited by 702
Increasing O-GlcNAc slows neurodegeneration and stabilizes tau against aggregation
Yuzwa, S. A., Shan, X., Macauley, M. S., Clark, T., Skorobogatko, Y., Vosseller, K., & Vocadlo, D. J. (2012) · Nature Chemical Biology · doi:10.1038/nchembio.797 · Cited by 611
Self-citationMonoclonal antibodies identify a group of nuclear pore complex glycoproteins.
Snow, C. M., Senior, A., & Gerace, L. (1987) · The Journal of Cell Biology · doi:10.1083/jcb.104.5.1143 · Cited by 542
Morris, M., Knudsen, G. M., Maeda, S., Trinidad, J. C., Ioanoviciu, A., Burlingame, A. L., & Mucke, L. (2015) · Nature Neuroscience · doi:10.1038/nn.4067 · Cited by 472
Mutations causing neurodegenerative tauopathies
Goedert, M., & Jakes, R. (2005) · Biochimica et Biophysica Acta (BBA) - Molecular Basis of Disease · doi:10.1016/j.bbadis.2004.08.007 · Cited by 438
The Microtubule-associated Protein Tau Is Extensively Modified with O-linked N-acetylglucosamine
Arnold, C. S., Johnson, G. W., Cole, R. N., Dong, D. L.-Y., Lee, M., & Hart, G. W. (1996) · Journal of Biological Chemistry · doi:10.1074/jbc.271.46.28741 · Cited by 361
Marotta, N. P., Lin, Y., Lewis, Y. E., Ambroso, M. R., Zaro, B. W., Roth, M. T., Arnold, D. B., Langen, R., & Pratt, M. R. (2015) · Nature Chemistry · doi:10.1038/nchem.2361 · Cited by 303
The Emerging Link between O-GlcNAc and Alzheimer Disease
Zhu, Y., Shan, X., Yuzwa, S. A., & Vocadlo, D. J. (2014) · Journal of Biological Chemistry · doi:10.1074/jbc.r114.601351 · Cited by 267
Self-citationO‐GlcNAcase is essential for embryonic development and maintenance of genomic stability
Yang, Y. R., Song, M., Lee, H., Jeon, Y., Choi, E., Jang, H., Moon, H. Y., Byun, H., Kim, E., Kim, D. H., et al. (2012) · Aging Cell · doi:10.1111/j.1474-9726.2012.00801.x · Cited by 250
Chalkley, R. J., Thalhammer, A., Schoepfer, R., & Burlingame, A. L. (2009) · Proceedings of the National Academy of Sciences · doi:10.1073/pnas.0900288106 · Cited by 239
Yuzwa, S. A., Shan, X., Jones, B. A., Zhao, G., Woodward, M. L., Li, X., Zhu, Y., McEachern, E. J., Silverman, M. A., Watson, N. V., et al. (2014) · Molecular Neurodegeneration · doi:10.1186/1750-1326-9-42 · Cited by 156
Self-citationYuzwa, S. A., Cheung, A. H., Okon, M., McIntosh, L. P., & Vocadlo, D. J. (2014) · Journal of Molecular Biology · doi:10.1016/j.jmb.2014.01.004 · Cited by 152
Self-citationMapping O-GlcNAc modification sites on tau and generation of a site-specific O-GlcNAc tau antibody
Yuzwa, S. A., Yadav, A. K., Skorobogatko, Y., Clark, T., Vosseller, K., & Vocadlo, D. J. (2011) · Amino Acids · doi:10.1007/s00726-010-0705-1 · Cited by 130
Self-citationGraham, D. L., Gray, A. J., Joyce, J. A., Yu, D., O’Moore, J., Carlson, G. A., Shearman, M. S., Dellovade, T., & Hering, H. (2013) · Neuropharmacology · doi:10.1016/j.neuropharm.2013.11.025 · Cited by 129
O-GlcNAcylation Prevents Aggregation of the Polycomb Group Repressor Polyhomeotic
Gambetta, M. C., & Müller, J. (2014) · Developmental Cell · doi:10.1016/j.devcel.2014.10.020 · Cited by 124
Therapeutic strategies for the treatment of tauopathies: Hopes and challenges
Khanna, M. R., Kovalevich, J., Lee, V. M. ‐., Trojanowski, J. Q., & Brunden, K. R. (2016) · Alzheimer s & Dementia · doi:10.1016/j.jalz.2016.06.006 · Cited by 116
Reversible gene knockdown in mice using a tight, inducible shRNA expression system
Seibler, J., Kleinridders, A., Birgit, K.-L., Sandra, N., Brüning, J. C., & Schwenk, F. (2007) · Nucleic Acids Research · doi:10.1093/nar/gkm122 · Cited by 115
Differential Effects of an O-GlcNAcase Inhibitor on Tau Phosphorylation
Yu, Y., Zhang, L., Li, X., Run, X., Liang, Z., Li, Y., Liu, Y., Lee, M. H., Grundke, I., Iqbal, K., et al. (2012) · PLoS ONE · doi:10.1371/journal.pone.0035277 · Cited by 113
Self-citationSingle copy shRNA configuration for ubiquitous gene knockdown in mice
Seibler, J. (2005) · Nucleic Acids Research · doi:10.1093/nar/gni065 · Cited by 109
Endoglycosidase and Glycoamidase Release of N‐Linked Glycans
Freeze, H. H., & Kranz, C. (2010) · Current Protocols in Protein Science · doi:10.1002/0471140864.ps1204s62 · Cited by 105
Borghgraef, P., Menuet, C., Theunis, C., Louis, J. V., Devijver, H., Maurin, H., Smet‐Nocca, C., Lippens, G. M., Hilaire, G., Gijsen, H. J. M., et al. (2013) · PLoS ONE · doi:10.1371/journal.pone.0084442 · Cited by 99
Tau Transgenic Mice as Models for Cerebrospinal Fluid Tau Biomarkers
Barten, D. M., Cadelina, G. W., Hoque, N., DeCarr, L. B., Guss, V. L., Yang, L., Sankaranarayanan, S., Wes, P. D., Flynn, M. E., Meredith, J. E., et al. (2011) · Journal of Alzheimer s Disease · doi:10.3233/jad-2011-110161 · Cited by 94
Endoglycosidase and Glycoamidase Release of N‐Linked Glycans
Freeze, H. H., & Kranz, C. (2010) · Current Protocols in Molecular Biology · doi:10.1002/0471142727.mb1713as89 · Cited by 66
Motulsky, H. J., & Neubig, R. R. (2010) · Current Protocols in Neuroscience · doi:10.1002/0471142301.ns0705s52 · Cited by 63
Analysis of tau post-translational modifications in rTg4510 mice, a model of tau pathology
Song, L., Lu, S. X., Ouyang, X., Melchor, J. P., Lee, J., Terracina, G., Wang, X., Hyde, L. A., Hess, J. F., Parker, E. M., et al. (2015) · Molecular Neurodegeneration · doi:10.1186/s13024-015-0011-1 · Cited by 51
Self-citationDomenico, F. D., Owen, J. B., Rukhsana Sultana, A., Robinson, R. A. S., Marzia Perluigi, A., Cini, C., Cai, J., Pierce, W. M. J., & Butterfield, D. A. (2010) · Journal of Neuroscience Research · doi:10.1002/jnr.22528 · Cited by 40
Smith, S. M., Struyk, A. F., Jonathan, D., Declercq, R., Marcus, J., Toolan, D. M., Wang, X., Schachter, J. B., Cosden, M. L., Pearson, M. S., et al. (2016) · Alzheimer s & Dementia · doi:10.1016/j.jalz.2016.06.469 · Cited by 24
Self-citation
Research works printed but not linked: 2
- Hatcher NG, Miller RA, Ke Z, Lee J, Cardasis HL, Terracina G, Zhang L, Marcus J, Wang X, Toolan DM, et al. Discovery proteomics to targeted biomarker assays: identification of tau post-translational modifications that track O-GlcNAcase inhibition by Thiamet G. J Am Soc Mass Spectrom. 2015;26(Supplement 1):52.
- Liu K, McEachern EJ, Mu C, Selnick HG, Vocadlo DJ, Wang Y, Wei Z, Zhou Y, Zhu Y. Selective glycosidase inhibitors and uses thereof, vol. WO2012061972 A1; 2012.
Cited by
Sorted by citations
Tau and neuroinflammation in Alzheimer’s disease: interplay mechanisms and clinical translation
Chen, Y., & Yu, Y. (2023) · Journal of Neuroinflammation · doi:10.1186/s12974-023-02853-3 · Cited by 516
“Inhibitors of the O-GlcNAcase enzyme (OGA)-like thiamet G increase tau glycosylation, reduce NFTs and neuronal cell death, improve motor behavior, and prolong survival of tau transgenic mice [174, 220, 221].”
BackgroundNutrient regulation of signaling and transcription
Hart, G. W. (2019) · Journal of Biological Chemistry · doi:10.1074/jbc.aw119.003226 · Cited by 352
Tau Proteins and Tauopathies in Alzheimer’s Disease
Chong, F. P., Ng, K. Y., Koh, R. Y., & Chye, S. M. (2018) · Cellular and Molecular Neurobiology · doi:10.1007/s10571-017-0574-1 · Cited by 260
The human O-GlcNAcome database and meta-analysis
Wulff‐Fuentes, E., Berendt, R., Massman, L., Danner, L., Malard, F., Vora, J. K., Kahsay, R., & Stichelen, S. O.-V. (2021) · Scientific Data · doi:10.1038/s41597-021-00810-4 · Cited by 247
Rösler, T. W., Marvian, A. T., Brendel, M., Nykänen, N.-P., Höllerhage, M., Schwarz, S. C., Hopfner, F., Koeglsperger, T., Respondek, G., Schweyer, K., et al. (2019) · Progress in Neurobiology · doi:10.1016/j.pneurobio.2019.101644 · Cited by 231
Metadata
- Authors
- Hastings, N. B., Wang, X., Song, L., Butts, B. D., Grotz, D., Hargreaves, R., Fred Hess, J., Hong, K.-L. K., Huang, C. R.-R., Hyde, L., Laverty, M., Lee, J., Levitan, D., Lu, S. X., Maguire, M., Mahadomrongkul, V., McEachern, E. J., Ouyang, X., Rosahl, T. W., Selnick, H., Stanton, M., Terracina, G., Vocadlo, D. J., Wang, G., Duffy, J. L., Parker, E. M., & Zhang, L.
- Affiliations
- United States Military Academy (US)
- Alectos (Canada) (CA)
- Merck & Co., Inc., Rahway, NJ, USA (United States) (US)
- Corresponding author
- Duffy, Joseph L.
- Parker, Eric M.
- Zhang, Lili
- ORCID
- Venue
- Molecular Neurodegeneration
- Published
- 2017-05-18
- Volume
- 12
- Issue
- 1
- Pages
- 39-39
- ISSN
- 1750-1326 (ISSN-L)
- PMC
- PMC5437664
- OpenAlex
- W2616169167
- Cited by
- 164
- References
- 37
- Citations by year
- 2026: 14 · 2025: 20 · 2024: 22 · 2023: 14 · 2022: 16 · 2021: 24 · 2020: 17 · 2019: 18 · 2018: 16 · 2017: 2
- FWCI
- 10.73
- Type
- journal article
- Language
- en
- Open access
- gold
- doi.org
- Licence
- cc-by
- Locations
- Molecular Neurodegeneration (publishedVersion, cc-by)
- PubMed Central (publishedVersion, cc-by)
- PubMed (publishedVersion)
- DOAJ (DOAJ: Directory of Open Access Journals) (submittedVersion)
- Funders
- Merck Research Laboratories
- Topics
- Life Sciences › Neuroscience › Cellular and Molecular Neuroscience › Alzheimer's disease research and treatments
- Life Sciences › Biochemistry, Genetics and Molecular Biology › Molecular Biology › Glycosylation and Glycoproteins Research
- Health Sciences › Medicine › Genetics (clinical) › Lysosomal Storage Disorders Research
- Keywords
- O-GlcNAcase inhibition, tauopathy, tau hyperphosphorylation, neurofibrillary tangles, rTg4510 mice, Thiamet G, cerebrospinal fluid tau, tau aggregation, pharmacodynamic biomarkers, Alzheimer's disease, O-GlcNAc transferase
- MeSH terms
- Animals, beta-N-Acetylhexosaminidases, Mice, Transgenic, Protein Processing, Post-Translational, Pyrans, Thiazoles, tau Proteins, Tauopathies, Mice
About these checks
Registry, retraction, Cites and statistics results are computed, not judged, with one exception: a printed reference that no index lists is read once by a model before it counts as a citation error. Claims are extracted by a model and kept only when their quote appears verbatim in the text; each cited source is then checked, with a model’s help, for whether it says what the claim relies on. Those verdicts can be wrong — read the claim’s quote and the cited source before relying on one.
Statistics and arithmetic are recomputed, not judged.
Confidence bands are shown only for fields calibrated on our annotated test set. None is calibrated yet, so no band is shown.
What counts as a claim ›How we measure confidence ›How we check this ›
Are you an author, or do you see a problem with this page? Request a review
