

The DOI matches its Crossref record; 53 of the 53 references it cites were found in a registry or an index; none of the 70 sources its claims cite is checked for support yet.
Deep proteomic network analysis of Alzheimer’s disease brain reveals alterations in RNA binding proteins and RNA splicing associated with disease
Open accessAbstract
BACKGROUND: The complicated cellular and biochemical changes that occur in brain during Alzheimer's disease are poorly understood. In a previous study we used an unbiased label-free quantitative mass spectrometry-based proteomic approach to analyze these changes at a systems level in post-mortem cortical tissue from patients with Alzheimer's disease (AD), asymptomatic Alzheimer's disease (AsymAD), and controls. We found modules of co-expressed proteins that correlated with AD phenotypes, some of which were enriched in proteins identified as risk factors for AD by genetic studies. METHODS: The amount of information that can be obtained from such systems-level proteomic analyses is critically dependent upon the number of proteins that can be quantified across a cohort. We report here a new proteomic systems-level analysis of AD brain based on 6,533 proteins measured across AD, AsymAD, and controls using an analysis pipeline consisting of isobaric tandem mass tag (TMT) mass spectrometry and offline prefractionation. RESULTS: Our new TMT pipeline allowed us to more than double the depth of brain proteome coverage. This increased depth of coverage greatly expanded the brain protein network to reveal new protein modules that correlated with disease and were unrelated to those identified in our previous network. Differential protein abundance analysis identified 350 proteins that had altered levels between AsymAD and AD not caused by changes in specific cell type abundance, potentially reflecting biochemical changes that are associated with cognitive decline in AD. RNA binding proteins emerged as a class of proteins altered between AsymAD and AD, and were enriched in network modules that correlated with AD pathology. We developed a proteogenomic approach to investigate RNA splicing events that may be altered by RNA binding protein changes in AD. The increased proteome depth afforded by our TMT pipeline allowed us to identify and quantify a large number of alternatively spliced protein isoforms in brain, including AD risk factors such as BIN1, PICALM, PTK2B, and FERMT2. Many of the new AD protein network modules were enriched in alternatively spliced proteins and correlated with molecular markers of AD pathology and cognition. CONCLUSIONS: Further analysis of the AD brain proteome will continue to yield new insights into the biological basis of AD.
Overview
AI snapshot
Written from the paper’s full text.
TL;DR
A TMT-SPS-MS3 proteomic pipeline quantified 6,533 proteins in post-mortem DLPFC from AD, AsymAD, and control cases, more than doubling prior LFQ depth and expanding the co-expression network from 16 to 50 modules. The deeper network implicated RNA binding proteins and alternative exon–exon splicing, including in AD risk genes such as BIN1, PTK2B, and FERMT2, as features of symptomatic AD.
Key findings
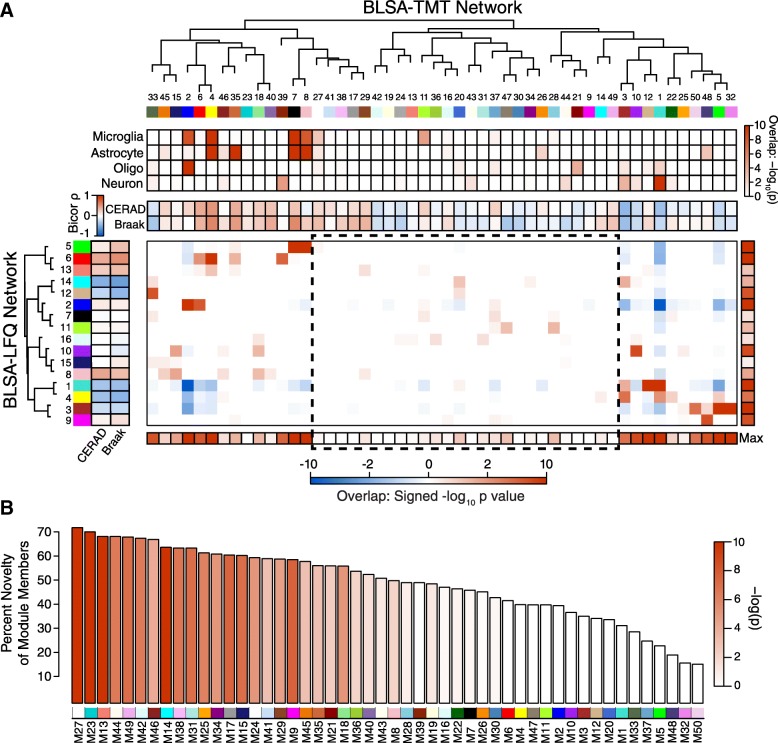
- The TMT pipeline quantified 6,533 proteins across 47 DLPFC cases versus 3,069 proteins by the previous single-shot LFQ approach; the protein co-expression network expanded from 16 modules to 50 modules, with module M27 containing >70% new protein members, being predominantly glial, and correlating positively with tau tangle burden.
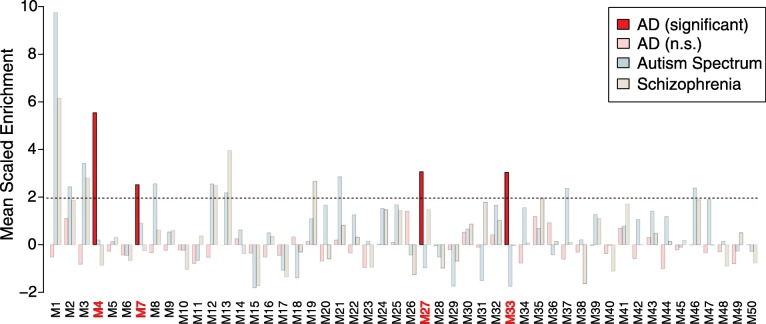
- Four TMT network modules were enriched for AD GWAS risk loci: M4, M7, M27, and M33; M4, M7, and M27 were predominantly glial and positively correlated with amyloid plaque and tau tangle burden, whereas M33 was more oligodendrocyte/neuronal and negatively correlated with both.
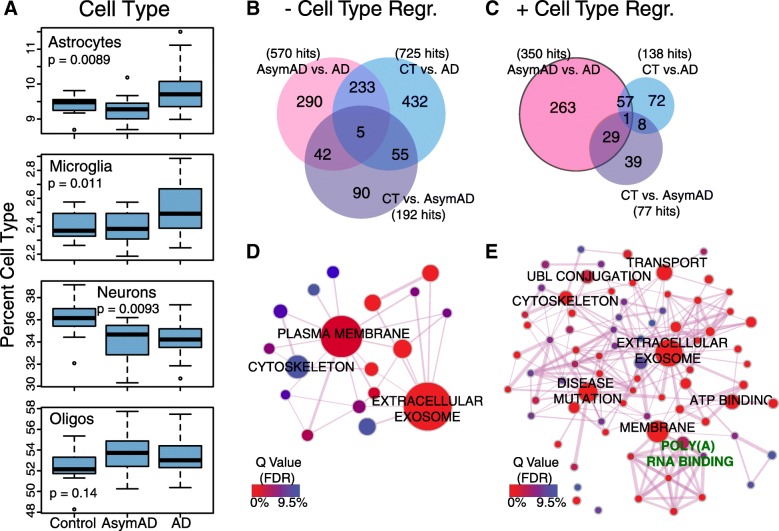
- Cell-type deconvolution showed astrocytes and microglia increased in AD compared with AsymAD and control and correlated strongly with Braak stage; neurons decreased in both AsymAD and AD. AsymAD–AD unique protein changes were largely preserved after deconvolution (from 290 to 263 proteins; the abstract reports 350 proteins altered between AsymAD and AD independent of cell-type abundance).
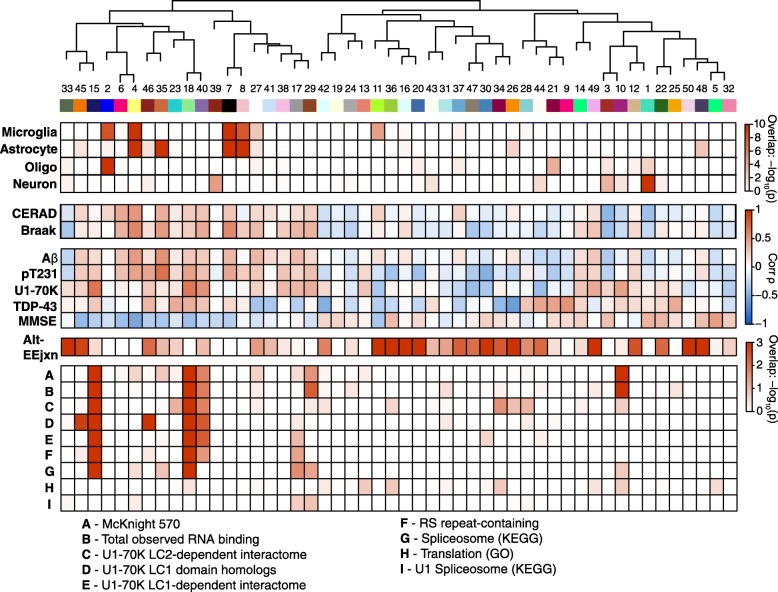
- RNA binding proteins were enriched in modules 10, 15, 17, 18, 29, and 40, most of which correlated with tau tangle burden. Proteogenomic analysis identified 4,830 TMT-LysC alternative exon–exon junction peptides versus 5,746 LFQ-trypsin peptides, with TMT better for quantification across case groups; alt-EEjxns in BIN1, PTK2B, and FERMT2 differed by case status.
Methods
- Post-mortem dorsolateral prefrontal cortex (Brodmann area 9) from the Baltimore Longitudinal Study of Aging: 20 AD, 14 AsymAD, and 13 control cases after excluding 11 MCI cases due to a preparation batch effect; the same homogenates were used for prior LFQ and new TMT analysis.
- Proteins were digested with LysC, labeled with isobaric tandem mass tags, prefractionated by offline ERLIC, and analyzed by LC-MS/MS with SPS-MS3; data were searched in Proteome Discoverer 2.1, then analyzed by weighted protein correlation network analysis, digital sorting algorithm cell-type deconvolution, and ANOVA with Tukey post hoc for differential abundance.
- For alternative splicing, RNA-seq from 3 control and 3 AD University of Kentucky brain bank cases was realigned with GSNAP novel-splicing mode, exon–exon junctions were summarized with spliceSites, peptides spanning alternative junctions were generated by in silico LysC digestion, appended to the Uniprot database, and quantified across TMT batches.
Limitations
- Stated: 11 MCI cases were excluded because of a preparation batch effect; MMSE scores were skewed toward 30; the RNA-seq database came from relatively few control and AD brains; alt-EEjxn quantification was limited to the peptide level and represents splicing “decisions”; TMT still has missing values; trypsin and LysC identified largely separate alt-EEjxn subsets; cell-type deconvolution was not applied to alt-EEjxn analysis.
- Stated: the relationship between RNA binding protein abundance and alternative splicing remained unresolved, and U1 spliceosome proteins were not strongly enriched in the network, possibly because they shift in solubility and aggregate in AD brain.
- Evident from the text: the design is cross-sectional and correlational in post-mortem tissue from one cohort and brain region, so causal direction and generalization to other cohorts or regions are not established.
Model-written summary. Check it against the paper before relying on it.
Integrity signals
Registry
Cites
Statistics
Figures
Verification
Claims the paper makes
122 Own result · 42 Not checked yet · 30 Own interpretation · 17 Own method · 8 No basis given
A result the paper reports from its own data — it cites no other source for it, so there is none to check. The quote shows it is in the paper.
In the paper
“RNA binding proteins emerged as a class of proteins altered between AsymAD and AD, and were enriched in network modules that correlated with AD pathology.”
§ Deep proteomic network analysis of Alzheimer’s disease brain reveals alterations in RNA binding proteins and RNA splicing associated with disease > Abstract > Results
plaincorrelational- Asserted: passes — The authors put it forward as true.
- Checkable: passes — It can be checked against evidence.
- Load-bearing: passes — The paper’s conclusions depend on it.
- Based: passes — The paper gives a reason why it holds.
A result the paper reports from its own data — it cites no other source for it, so there is none to check. The quote shows it is in the paper.
In the paper
“We also used differential expression analysis on the enlarged proteomic dataset to identify proteins that have altered levels among AD, AsymAD, and control brains, even after accounting for changes in cellular abundance.”
§ Deep proteomic network analysis of Alzheimer’s disease brain reveals alterations in RNA binding proteins and RNA splicing associated with disease > Background
plaincorrelational- Asserted: passes — The authors put it forward as true.
- Checkable: passes — It can be checked against evidence.
- Load-bearing: passes — The paper’s conclusions depend on it.
- Based: passes — The paper gives a reason why it holds.
A result the paper reports from its own data — it cites no other source for it, so there is none to check. The quote shows it is in the paper.
In the paper
“RNA binding proteins emerged as a family of proteins that was increased in abundance in AD, and these proteins were enriched in modules that correlated with tau tangle pathology.”
§ Deep proteomic network analysis of Alzheimer’s disease brain reveals alterations in RNA binding proteins and RNA splicing associated with disease > Background
plaincorrelational- Asserted: passes — The authors put it forward as true.
- Checkable: passes — It can be checked against evidence.
- Load-bearing: passes — The paper’s conclusions depend on it.
- Based: passes — The paper gives a reason why it holds.
A result the paper reports from its own data — it cites no other source for it, so there is none to check. The quote shows it is in the paper.
In the paper
“The increased proteome depth afforded by our TMT pipeline allowed us to identify and quantify a large number of alternatively spliced protein isoforms in brain, including AD risk factors such as BIN1, PICALM, PTK2B, and FERMT2.”
§ Deep proteomic network analysis of Alzheimer’s disease brain reveals alterations in RNA binding proteins and RNA splicing associated with disease > Abstract > Results
plaindirect- Asserted: passes — The authors put it forward as true.
- Checkable: passes — It can be checked against evidence.
- Load-bearing: passes — The paper’s conclusions depend on it.
- Based: passes — The paper gives a reason why it holds.
A result the paper reports from its own data — it cites no other source for it, so there is none to check. The quote shows it is in the paper.
In the paper
“Differential protein abundance analysis identified 350 proteins that had altered levels between AsymAD and AD not caused by changes in specific cell type abundance, potentially reflecting biochemical changes that are associated with cognitive decline in AD.”
§ Deep proteomic network analysis of Alzheimer’s disease brain reveals alterations in RNA binding proteins and RNA splicing associated with disease > Abstract > Results
plaincorrelational- Asserted: passes — The authors put it forward as true.
- Checkable: passes — It can be checked against evidence.
- Load-bearing: passes — The paper’s conclusions depend on it.
- Based: passes — The paper gives a reason why it holds.
A result the paper reports from its own data — it cites no other source for it, so there is none to check. The quote shows it is in the paper.
In the paper
“RNA binding proteins emerged as a family of proteins that was increased in abundance in AD, and these proteins were enriched in modules that correlated with tau tangle pathology.”
§ Deep proteomic network analysis of Alzheimer’s disease brain reveals alterations in RNA binding proteins and RNA splicing associated with disease > Background
plaincorrelational- Asserted: passes — The authors put it forward as true.
- Checkable: passes — It can be checked against evidence.
- Load-bearing: passes — The paper’s conclusions depend on it.
- Based: passes — The paper gives a reason why it holds.
The paper states this without a source or data behind it here, so there is nothing to check it against. The quote shows it is in the paper.
In the paper
“Our new TMT pipeline allowed us to more than double the depth of brain proteome coverage.”
§ Deep proteomic network analysis of Alzheimer’s disease brain reveals alterations in RNA binding proteins and RNA splicing associated with disease > Abstract > Results
plaindirect- Asserted: passes — The authors put it forward as true.
- Checkable: passes — It can be checked against evidence.
- Load-bearing: passes — The paper’s conclusions depend on it.
- Based: passes — The paper gives a reason why it holds.
- Rests on an assumption: The altered biochemical and cellular processes that eventually lead to changes in cognition and pathology in AD are not well understood.
A result the paper reports from its own data — it cites no other source for it, so there is none to check. The quote shows it is in the paper.
In the paper
“RNA binding proteins emerged as a class of proteins altered between AsymAD and AD, and were enriched in network modules that correlated with AD pathology.”
§ Deep proteomic network analysis of Alzheimer’s disease brain reveals alterations in RNA binding proteins and RNA splicing associated with disease > Abstract > Results
plaincorrelational- Asserted: passes — The authors put it forward as true.
- Checkable: passes — It can be checked against evidence.
- Load-bearing: passes — The paper’s conclusions depend on it.
- Based: passes — The paper gives a reason why it holds.
A result the paper reports from its own data — it cites no other source for it, so there is none to check. The quote shows it is in the paper.
In the paper
“Module M27, however, was the most unique module in the TMT network compared to the previous LFQ network (Fig. 1b), and showed enrichment in GWAS protein candidates including PICALM, FERMT2, and TMEM106B, among others (Additional file 12: Figure S5).”
§ Deep proteomic network analysis of Alzheimer’s disease brain reveals alterations in RNA binding proteins and RNA splicing associated with disease > Results > AD genetic risk factors cluster in glial modules
plaincorrelational- Asserted: passes — The authors put it forward as true.
- Checkable: passes — It can be checked against evidence.
- Load-bearing: passes — The paper’s conclusions depend on it.
- Based: passes — The paper gives a reason why it holds.
A result the paper reports from its own data — it cites no other source for it, so there is none to check. The quote shows it is in the paper.
In the paper
“Three out of four of these modules (M4, M7, and M27) were predominantly glial in nature and correlated positively with amyloid plaque and tau tangle burden, whereas one module, M33, contained more proteins associated with oligodendrocytes and neurons, and correlated negatively with amyloid plaques and tau tangles (Fig. 1a).”
§ Deep proteomic network analysis of Alzheimer’s disease brain reveals alterations in RNA binding proteins and RNA splicing associated with disease > Results > AD genetic risk factors cluster in glial modules
plain- Asserted: passes — The authors put it forward as true.
- Checkable: passes — It can be checked against evidence.
- Load-bearing: passes — The paper’s conclusions depend on it.
- Based: passes — The paper gives a reason why it holds.
- It may state two separate claims as one. 59
- Probably not a substantial claim. 44
In the paper
“One of the most unique modules contained strong enrichment in AD risk loci identified by the International Genetics of Alzheimer’s Project (IGAP) GWAS [12], correlated with tau tangle burden, and contained more glial than neuronal proteins.”
§ Deep proteomic network analysis of Alzheimer’s disease brain reveals alterations in RNA binding proteins and RNA splicing associated with disease > Background
What the sources say
- Not checked yetcites [12] Lambert JC, Ibrahim-Verbaas CA, Harold D, Naj AC, Sims R, Bellenguez C, DeStafano AL, Bis JC, Beecham GW, Grenier-Boley B, et al. Meta-analysis of 74,046 individuals identifies 11 new susceptibility loci for Alzheimer's disease. Nat Genet. 2013;45:1452–8. source
boostedcorrelational- Asserted: passes — The authors put it forward as true.
- Checkable: passes — It can be checked against evidence.
- Load-bearing: unclear — It is unclear whether the paper’s conclusions depend on it.
- Based: passes — The paper gives a reason why it holds.
It may state two separate claims as one.
The paper states this without a source or data behind it here, so there is nothing to check it against. The quote shows it is in the paper.
In the paper
“This proteogenomic approach, coupled with the increased depth of proteome coverage and superior quantitation afforded by our TMT pipeline compared to our previous LFQ approach, allowed us to identify and quantify a number of alternative exon-exon splicing events in brain at the protein level, including alternative exon-exon junctions in AD risk factor proteins such as BIN1, PICALM, PTK2B, and FER”
§ Deep proteomic network analysis of Alzheimer’s disease brain reveals alterations in RNA binding proteins and RNA splicing associated with disease > Background
plaindirect- Asserted: passes — The authors put it forward as true.
- Checkable: passes — It can be checked against evidence.
- Load-bearing: passes — The paper’s conclusions depend on it.
- Based: passes — The paper gives a reason why it holds.
It may state two separate claims as one.
A result the paper reports from its own data — it cites no other source for it, so there is none to check. The quote shows it is in the paper.
In the paper
“This increased depth of coverage greatly expanded the brain protein network to reveal new protein modules that correlated with disease and were unrelated to those identified in our previous network.”
§ Deep proteomic network analysis of Alzheimer’s disease brain reveals alterations in RNA binding proteins and RNA splicing associated with disease > Abstract > Results
plaindirect- Asserted: passes — The authors put it forward as true.
- Checkable: passes — It can be checked against evidence.
- Load-bearing: passes — The paper’s conclusions depend on it.
- Based: passes — The paper gives a reason why it holds.
It may state two separate claims as one.
A result the paper reports from its own data — it cites no other source for it, so there is none to check. The quote shows it is in the paper.
In the paper
“Many of the identified alternative exon-exon junction splicing events were highly enriched in modules unique to the TMT network, and correlated with disease, suggesting a potential role for aberrant RNA splicing in AD pathogenesis.”
§ Deep proteomic network analysis of Alzheimer’s disease brain reveals alterations in RNA binding proteins and RNA splicing associated with disease > Background
hedgedcorrelational- Asserted: passes — The authors put it forward as true.
- Checkable: passes — It can be checked against evidence.
- Load-bearing: passes — The paper’s conclusions depend on it.
- Based: passes — The paper gives a reason why it holds.
It may state two separate claims as one.
A result the paper reports from its own data — it cites no other source for it, so there is none to check. The quote shows it is in the paper.
In the paper
“The increased depth of proteome coverage allowed us to build a protein network that consisted of approximately threefold more protein modules, two-thirds of which shared little overlap with the modules previously identified in our LFQ network.”
§ Deep proteomic network analysis of Alzheimer’s disease brain reveals alterations in RNA binding proteins and RNA splicing associated with disease > Background
plaindirect- Asserted: passes — The authors put it forward as true.
- Checkable: passes — It can be checked against evidence.
- Load-bearing: passes — The paper’s conclusions depend on it.
- Based: passes — The paper gives a reason why it holds.
It may state two separate claims as one.
A result the paper reports from its own data — it cites no other source for it, so there is none to check. The quote shows it is in the paper.
In the paper
“Many of the new AD protein network modules were enriched in alternatively spliced proteins and correlated with molecular markers of AD pathology and cognition.”
§ Deep proteomic network analysis of Alzheimer’s disease brain reveals alterations in RNA binding proteins and RNA splicing associated with disease > Abstract > Results
plaincorrelational- Asserted: passes — The authors put it forward as true.
- Checkable: passes — It can be checked against evidence.
- Load-bearing: passes — The paper’s conclusions depend on it.
- Based: passes — The paper gives a reason why it holds.
It may state two separate claims as one.
A result the paper reports from its own data — it cites no other source for it, so there is none to check. The quote shows it is in the paper.
In the paper
“Other modules unique to the TMT network that were significantly correlated with AD neuropathology included M17 and M29, which were associated with increased tau tangle burden, and M47, which was associated with decreased tau tangle burden.”
§ Deep proteomic network analysis of Alzheimer’s disease brain reveals alterations in RNA binding proteins and RNA splicing associated with disease > Results > TMT quantification pipeline increases the depth of proteomic network analysis of human brain tissues
plaincorrelational- Asserted: passes — The authors put it forward as true.
- Checkable: passes — It can be checked against evidence.
- Load-bearing: passes — The paper’s conclusions depend on it.
- Based: passes — The paper gives a reason why it holds.
It may state two separate claims as one.
A result the paper reports from its own data — it cites no other source for it, so there is none to check. The quote shows it is in the paper.
In the paper
“The oligodendrocyte population increased in AsymAD, and then decreased slightly in AD compared to AsymAD.”
§ Deep proteomic network analysis of Alzheimer’s disease brain reveals alterations in RNA binding proteins and RNA splicing associated with disease > Results > Brain cell type changes and protein abundance differences between asymptomatic and symptomatic AD
plaindirect- Asserted: passes — The authors put it forward as true.
- Checkable: passes — It can be checked against evidence.
- Load-bearing: unclear — It is unclear whether the paper’s conclusions depend on it.
- Based: passes — The paper gives a reason why it holds.
It may state two separate claims as one.
A result the paper reports from its own data — it cites no other source for it, so there is none to check. The quote shows it is in the paper.
In the paper
“TMT modules with cognate modules in the LFQ network that were strongly associated with AD traits included M1 and M3, which were negatively correlated with AD pathology, and M4 and M7, which were positively correlated with AD pathology, among others.”
§ Deep proteomic network analysis of Alzheimer’s disease brain reveals alterations in RNA binding proteins and RNA splicing associated with disease > Results > TMT quantification pipeline increases the depth of proteomic network analysis of human brain tissues
plaincorrelational- Asserted: passes — The authors put it forward as true.
- Checkable: passes — It can be checked against evidence.
- Load-bearing: unclear — It is unclear whether the paper’s conclusions depend on it.
- Based: passes — The paper gives a reason why it holds.
It may state two separate claims as one.
A result the paper reports from its own data — it cites no other source for it, so there is none to check. The quote shows it is in the paper.
In the paper
“While most of the new modules did not display a strong association with any of the four brain cell types we analyzed (microglia, astrocytes, oligodendrocytes, or neurons), M27 was predominantly glial in nature and correlated positively with tau tangle burden (Braak stage).”
§ Deep proteomic network analysis of Alzheimer’s disease brain reveals alterations in RNA binding proteins and RNA splicing associated with disease > Results > TMT quantification pipeline increases the depth of proteomic network analysis of human brain tissues
plaincorrelational- Asserted: passes — The authors put it forward as true.
- Checkable: passes — It can be checked against evidence.
- Load-bearing: unclear — It is unclear whether the paper’s conclusions depend on it.
- Based: passes — The paper gives a reason why it holds.
It may state two separate claims as one.
A result the paper reports from its own data — it cites no other source for it, so there is none to check. The quote shows it is in the paper.
In the paper
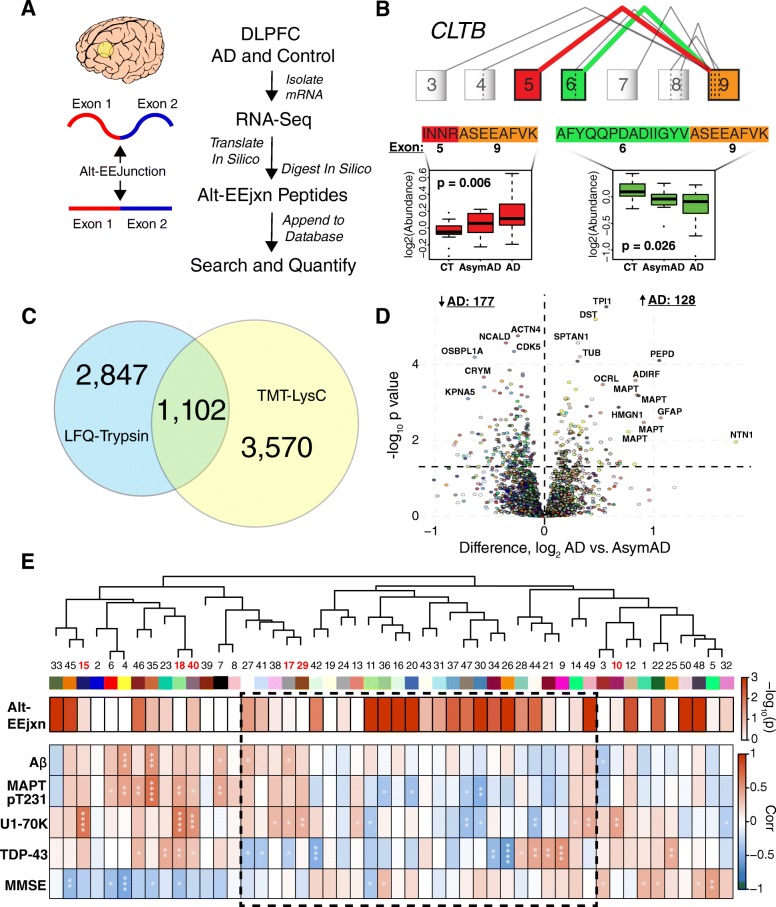
“Tau had a number of alt-EEjxn peptides that were significantly increased in AD, and these mapped to the 3- and 4- microtubule binding domain repeat isoforms of the protein in this analysis because either isoform can be considered constitutively expressed in humans.”
§ Deep proteomic network analysis of Alzheimer’s disease brain reveals alterations in RNA binding proteins and RNA splicing associated with disease > Results > Alternative splicing events associated with AD pathology and cognitive function
plaincorrelational- Asserted: passes — The authors put it forward as true.
- Checkable: passes — It can be checked against evidence.
- Load-bearing: passes — The paper’s conclusions depend on it.
- Based: passes — The paper gives a reason why it holds.
It may state two separate claims as one.
- Rests on an assumption: Either the 3-repeat or the 4-repeat microtubule binding domain isoform of tau can be considered constitutively expressed in humans.
A result the paper reports from its own data — it cites no other source for it, so there is none to check. The quote shows it is in the paper.
In the paper
“Modules 4 and 7—glial modules enriched in AD risk factors from GWAS—did not contain more alt-EEjxn peptides than expected, but two other GWAS modules, M27 and M33, were enriched, with M33 being highly enriched.”
§ Deep proteomic network analysis of Alzheimer’s disease brain reveals alterations in RNA binding proteins and RNA splicing associated with disease > Results > Alternative splicing events associated with AD pathology and cognitive function
plaincorrelational- Asserted: passes — The authors put it forward as true.
- Checkable: passes — It can be checked against evidence.
- Load-bearing: passes — The paper’s conclusions depend on it.
- Based: passes — The paper gives a reason why it holds.
It may state two separate claims as one.
A result the paper reports from its own data — it cites no other source for it, so there is none to check. The quote shows it is in the paper.
In the paper
“Three of the five GWAS proteins had alt-EEjxns that were different in abundance by case status, and included BIN1, PTK2B, and FERMT2 (Additional file 7: Table S7).”
§ Deep proteomic network analysis of Alzheimer’s disease brain reveals alterations in RNA binding proteins and RNA splicing associated with disease > Results > Alternative splicing events associated with AD pathology and cognitive function
plaincorrelational- Asserted: passes — The authors put it forward as true.
- Checkable: passes — It can be checked against evidence.
- Load-bearing: passes — The paper’s conclusions depend on it.
- Based: passes — The paper gives a reason why it holds.
It may state two separate claims as one.
A result the paper reports from its own data — it cites no other source for it, so there is none to check. The quote shows it is in the paper.
In the paper
“There were slightly more proteins that were significantly lower in abundance compared to those that were higher in abundance in AD compared to AsymAD after cell type deconvolution (Additional file 14: Figure S7).”
§ Deep proteomic network analysis of Alzheimer’s disease brain reveals alterations in RNA binding proteins and RNA splicing associated with disease > Results > Brain cell type changes and protein abundance differences between asymptomatic and symptomatic AD
plain- Asserted: passes — The authors put it forward as true.
- Checkable: passes — It can be checked against evidence.
- Load-bearing: fails — The paper’s conclusions may not depend on it.
- Based: passes — The paper gives a reason why it holds.
Probably not a substantial claim. The paper’s conclusions may not depend on it.
A result the paper reports from its own data — it cites no other source for it, so there is none to check. The quote shows it is in the paper.
In the paper
“As shown in Fig. 4d, we found there were more alt-EEjxn peptides that were reduced in AD compared to AsymAD, similar to the total protein abundance differences between AD and AsymAD.”
§ Deep proteomic network analysis of Alzheimer’s disease brain reveals alterations in RNA binding proteins and RNA splicing associated with disease > Results > Alternative splicing events associated with AD pathology and cognitive function
plaincorrelational- Asserted: passes — The authors put it forward as true.
- Checkable: passes — It can be checked against evidence.
- Load-bearing: unclear — It is unclear whether the paper’s conclusions depend on it.
- Based: passes — The paper gives a reason why it holds.
It may state two separate claims as one.
A result the paper reports from its own data — it cites no other source for it, so there is none to check. The quote shows it is in the paper.
In the paper
“After cell type deconvolution of protein abundance changes, we noted with keen interest the preservation of RNA binding proteins as hubs of differentially abundant proteins between control and AsymAD (Additional file 15: Figure S8), and between AsymAD and AD (Fig. 3e and Additional file 16: Figure S9).”
§ Deep proteomic network analysis of Alzheimer’s disease brain reveals alterations in RNA binding proteins and RNA splicing associated with disease > Results > RNA binding protein enrichment in the AD brain TMT proteomic network
plaincorrelational- Asserted: passes — The authors put it forward as true.
- Checkable: passes — It can be checked against evidence.
- Load-bearing: passes — The paper’s conclusions depend on it.
- Based: passes — The paper gives a reason why it holds.
It may state two separate claims as one.
A result the paper reports from its own data — it cites no other source for it, so there is none to check. The quote shows it is in the paper.
In the paper
“All of these modules were strongly glial in nature, with M35 a strongly astrocytic module.”
§ Deep proteomic network analysis of Alzheimer’s disease brain reveals alterations in RNA binding proteins and RNA splicing associated with disease > Results > Alternative splicing events associated with AD pathology and cognitive function
boosted- Asserted: passes — The authors put it forward as true.
- Checkable: passes — It can be checked against evidence.
- Load-bearing: unclear — It is unclear whether the paper’s conclusions depend on it.
- Based: passes — The paper gives a reason why it holds.
It may state two separate claims as one.
The paper states this without a source or data behind it here, so there is nothing to check it against. The quote shows it is in the paper.
In the paper
“TMTs also allow for relative protein measurements across multiple case groups within a single batch, minimizing the missing value problem for quantification across case groups.”
§ Deep proteomic network analysis of Alzheimer’s disease brain reveals alterations in RNA binding proteins and RNA splicing associated with disease > Discussion
plaindirect- Asserted: passes — The authors put it forward as true.
- Checkable: passes — It can be checked against evidence.
- Load-bearing: passes — The paper’s conclusions depend on it.
- Based: passes — The paper gives a reason why it holds.
It may state two separate claims as one.
A result the paper reports from its own data — it cites no other source for it, so there is none to check. The quote shows it is in the paper.
In the paper
“Module 35, which contained a number of differentially abundant alt-EEjxns, showed strong correlation to Aβ as well as to tau pT231, and correlated with worsened cognitive function.”
§ Deep proteomic network analysis of Alzheimer’s disease brain reveals alterations in RNA binding proteins and RNA splicing associated with disease > Results > Alternative splicing events associated with AD pathology and cognitive function
boostedcorrelational- Asserted: passes — The authors put it forward as true.
- Checkable: passes — It can be checked against evidence.
- Load-bearing: passes — The paper’s conclusions depend on it.
- Based: passes — The paper gives a reason why it holds.
It may state two separate claims as one.
- Rests on an assumption: The tau pT231 peptide lies within the proline-rich region of tau and is separate from the microtubule-binding region that aggregates into neurofibrillary tangles.
A result the paper reports from its own data — it cites no other source for it, so there is none to check. The quote shows it is in the paper.
In the paper
“We therefore identified a number of alternative splicing events that strongly correlated with network modules enriched in AD GWAS risk factor proteins, and some of these isoforms differed in abundance in AsymAD and AD.”
§ Deep proteomic network analysis of Alzheimer’s disease brain reveals alterations in RNA binding proteins and RNA splicing associated with disease > Results > Alternative splicing events associated with modules enriched in AD risk factor proteins
boostedcorrelational- Asserted: passes — The authors put it forward as true.
- Checkable: passes — It can be checked against evidence.
- Load-bearing: passes — The paper’s conclusions depend on it.
- Based: passes — The paper gives a reason why it holds.
It may state two separate claims as one.
- Rests on an assumption: Most of the common alternatively spliced transcripts present in DLPFC control and AD brain were represented in the RNAseq-based database used to identify alt-EEjxn peptides.
The paper states this without a source or data behind it here, so there is nothing to check it against. The quote shows it is in the paper.
In the paper
“Prefractionation significantly increases the depth of proteome coverage achievable by LC-MS/MS of complex tissues such as brain.”
§ Deep proteomic network analysis of Alzheimer’s disease brain reveals alterations in RNA binding proteins and RNA splicing associated with disease > Discussion
plaindirect- Asserted: passes — The authors put it forward as true.
- Checkable: passes — It can be checked against evidence.
- Load-bearing: passes — The paper’s conclusions depend on it.
- Based: passes — The paper gives a reason why it holds.
Probably not a substantial claim.
A result the paper reports from its own data — it cites no other source for it, so there is none to check. The quote shows it is in the paper.
In the paper
“Modules 11 and 20 had corrected p values for enrichment of 4.1e− 15 and 1.7e− 13, respectively, and by GO analysis were most likely to be involved in regulation of immune system processes (data not shown).”
§ Deep proteomic network analysis of Alzheimer’s disease brain reveals alterations in RNA binding proteins and RNA splicing associated with disease > Results > Alternative splicing events associated with AD pathology and cognitive function
plaincorrelational- Asserted: passes — The authors put it forward as true.
- Checkable: passes — It can be checked against evidence.
- Load-bearing: unclear — It is unclear whether the paper’s conclusions depend on it.
- Based: passes — The paper gives a reason why it holds.
It may state two separate claims as one.
A result the paper reports from its own data — it cites no other source for it, so there is none to check. The quote shows it is in the paper.
In the paper
“This region of the TMT network was not strongly associated with a particular cell type or strongly correlated with standard histopathological measures of AD.”
§ Deep proteomic network analysis of Alzheimer’s disease brain reveals alterations in RNA binding proteins and RNA splicing associated with disease > Results > Alternative splicing events associated with AD pathology and cognitive function
plain- Asserted: passes — The authors put it forward as true.
- Checkable: passes — It can be checked against evidence.
- Load-bearing: passes — The paper’s conclusions depend on it.
- Based: passes — The paper gives a reason why it holds.
It may state two separate claims as one.
A result the paper reports from its own data — it cites no other source for it, so there is none to check. The quote shows it is in the paper.
In the paper
“Interestingly, the neuron population decreased between control and AsymAD, with a further decrease between AsymAD and AD.”
§ Deep proteomic network analysis of Alzheimer’s disease brain reveals alterations in RNA binding proteins and RNA splicing associated with disease > Discussion
plaindirect- Asserted: passes — The authors put it forward as true.
- Checkable: passes — It can be checked against evidence.
- Load-bearing: unclear — It is unclear whether the paper’s conclusions depend on it.
- Based: passes — The paper gives a reason why it holds.
It may state two separate claims as one.
A result the paper reports from its own data — it cites no other source for it, so there is none to check. The quote shows it is in the paper.
In the paper
“From the molecular analyses we also identified modules such as M18 that, although not enriched in alt-EEjxn peptides, were observed to be strongly enriched in RNA binding proteins (Additional file 22: Figure S15), were strongly correlated in a positive direction with tau pT231, U1-70K, and TDP-43, and were correlated in a negative direction with cognitive function.”
§ Deep proteomic network analysis of Alzheimer’s disease brain reveals alterations in RNA binding proteins and RNA splicing associated with disease > Results > Alternative splicing events associated with AD pathology and cognitive function
boosted- Asserted: passes — The authors put it forward as true.
- Checkable: passes — It can be checked against evidence.
- Load-bearing: passes — The paper’s conclusions depend on it.
- Based: passes — The paper gives a reason why it holds.
It may state two separate claims as one.
A result the paper reports from its own data — it cites no other source for it, so there is none to check. The quote shows it is in the paper.
In the paper
“The deeper protein coexpression network analysis revealed new protein modules that correlated with pathological measures of AD and were enriched in AD risk factors identified by GWAS.”
§ Deep proteomic network analysis of Alzheimer’s disease brain reveals alterations in RNA binding proteins and RNA splicing associated with disease > Discussion
plaincorrelational- Asserted: passes — The authors put it forward as true.
- Checkable: passes — It can be checked against evidence.
- Load-bearing: passes — The paper’s conclusions depend on it.
- Based: passes — The paper gives a reason why it holds.
It may state two separate claims as one.
A result the paper reports from its own data — it cites no other source for it, so there is none to check. The quote shows it is in the paper.
In the paper
“as well as splicing events in other proteins that correlated with network modules enriched in AD risk factor proteins and were altered in AD.”
§ Deep proteomic network analysis of Alzheimer’s disease brain reveals alterations in RNA binding proteins and RNA splicing associated with disease > Discussion
plaincorrelational- Asserted: passes — The authors put it forward as true.
- Checkable: passes — It can be checked against evidence.
- Load-bearing: passes — The paper’s conclusions depend on it.
- Based: passes — The paper gives a reason why it holds.
It may state two separate claims as one.
- Rests on an assumption: Most of the common alternatively spliced transcripts present in DLPFC control and AD brain were represented in the RNAseq-based database used to identify alt-EEjxn peptides.
A result the paper reports from its own data — it cites no other source for it, so there is none to check. The quote shows it is in the paper.
In the paper
“Interestingly, the highly related modules 11 and 36 showed opposite correlation with cognition, with increases in M11 associated with worsened cognitive function and increases in M36 associated with improved cognitive function, suggesting that protein splicing changes may be highly specific in their relationships to different types of AD pathology and cognitive function.”
§ Deep proteomic network analysis of Alzheimer’s disease brain reveals alterations in RNA binding proteins and RNA splicing associated with disease > Results > Alternative splicing events associated with AD pathology and cognitive function
plaincorrelational- Asserted: passes — The authors put it forward as true.
- Checkable: passes — It can be checked against evidence.
- Load-bearing: passes — The paper’s conclusions depend on it.
- Based: passes — The paper gives a reason why it holds.
It may state two separate claims as one.
A result the paper reports from its own data — it cites no other source for it, so there is none to check. The quote shows it is in the paper.
In the paper
“This module was also enriched for AD GWAS risk factors and correlated with AD pathology”
§ Deep proteomic network analysis of Alzheimer’s disease brain reveals alterations in RNA binding proteins and RNA splicing associated with disease > Discussion
plaincorrelational- Asserted: passes — The authors put it forward as true.
- Checkable: passes — It can be checked against evidence.
- Load-bearing: passes — The paper’s conclusions depend on it.
- Based: passes — The paper gives a reason why it holds.
It may state two separate claims as one.
A result the paper reports from its own data — it cites no other source for it, so there is none to check. The quote shows it is in the paper.
In the paper
“We found that alt-EEjxns at a global level tended to cluster into the unique area of the TMT-LysC network, but did not significantly overlap with modules enriched in RNA binding proteins.”
§ Deep proteomic network analysis of Alzheimer’s disease brain reveals alterations in RNA binding proteins and RNA splicing associated with disease > Discussion
hedged- Asserted: passes — The authors put it forward as true.
- Checkable: passes — It can be checked against evidence.
- Load-bearing: unclear — It is unclear whether the paper’s conclusions depend on it.
- Based: passes — The paper gives a reason why it holds.
It may state two separate claims as one.
- Rests on an assumption: Most of the common alternatively spliced transcripts present in DLPFC control and AD brain were represented in the RNAseq-based database used to identify alt-EEjxn peptides.
A result the paper reports from its own data — it cites no other source for it, so there is none to check. The quote shows it is in the paper.
In the paper
“Our comparison between LFQ-trypsin and TMT-LysC analytical pipelines found that the TMT-LysC approach was slightly superior to LFQ-trypsin for quantification of alt-EEjxns, and even better when quantifying alt-EEjxns across case groups.”
§ Deep proteomic network analysis of Alzheimer’s disease brain reveals alterations in RNA binding proteins and RNA splicing associated with disease > Discussion
plain- Asserted: passes — The authors put it forward as true.
- Checkable: passes — It can be checked against evidence.
- Load-bearing: unclear — It is unclear whether the paper’s conclusions depend on it.
- Based: passes — The paper gives a reason why it holds.
It may state two separate claims as one.
- Rests on an assumption: Most of the common alternatively spliced transcripts present in DLPFC control and AD brain were represented in the RNAseq-based database used to identify alt-EEjxn peptides.
A result the paper reports from its own data — it cites no other source for it, so there is none to check. The quote shows it is in the paper.
In the paper
“M18 was significantly correlated with phosphorylated tau, U1-70K, TDP-43, and cognitive decline”
§ Deep proteomic network analysis of Alzheimer’s disease brain reveals alterations in RNA binding proteins and RNA splicing associated with disease > Discussion
plaincorrelational- Asserted: passes — The authors put it forward as true.
- Checkable: passes — It can be checked against evidence.
- Load-bearing: passes — The paper’s conclusions depend on it.
- Based: passes — The paper gives a reason why it holds.
It may state two separate claims as one.
A result the paper reports from its own data — it cites no other source for it, so there is none to check. The quote shows it is in the paper.
In the paper
“Module 29 contained five snRNPs and was annotated as being involved in mRNA splicing by GO analysis, but did not show enrichment of alt-EEjxn peptides.”
§ Deep proteomic network analysis of Alzheimer’s disease brain reveals alterations in RNA binding proteins and RNA splicing associated with disease > Discussion
plain- Asserted: passes — The authors put it forward as true.
- Checkable: passes — It can be checked against evidence.
- Load-bearing: unclear — It is unclear whether the paper’s conclusions depend on it.
- Based: passes — The paper gives a reason why it holds.
It may state two separate claims as one.
- Rests on an assumption: Most of the common alternatively spliced transcripts present in DLPFC control and AD brain were represented in the RNAseq-based database used to identify alt-EEjxn peptides.
The paper states this without a source or data behind it here, so there is nothing to check it against. The quote shows it is in the paper.
In the paper
“We developed a TMT-based quantification pipeline for proteomic analysis of brain tissue that significantly increased our depth of proteome coverage of control and AD brain and led to additional insights into the protein changes that characterize AD pathophysiology, including changes in RNA splicing.”
§ Deep proteomic network analysis of Alzheimer’s disease brain reveals alterations in RNA binding proteins and RNA splicing associated with disease > Conclusions
plaindirect- Asserted: passes — The authors put it forward as true.
- Checkable: passes — It can be checked against evidence.
- Load-bearing: passes — The paper’s conclusions depend on it.
- Based: passes — The paper gives a reason why it holds.
It may state two separate claims as one.
- Rests on an assumption: Most of the common alternatively spliced transcripts present in DLPFC control and AD brain were represented in the RNAseq-based database used to identify alt-EEjxn peptides.
What the paper did — it cites no source for this, so there is none to check. The quote shows it is in the paper.
In the paper
“In addition to these n = 47 cases, mild cognitive impairment (MCI) cases (n = 11) were homogenized separately on a different day and included in the batched TMT-MS design, but were later excluded from the analysis due to a preparation batch effect that was refractory to post-hoc correction.”
§ Deep proteomic network analysis of Alzheimer’s disease brain reveals alterations in RNA binding proteins and RNA splicing associated with disease > Methods > Tissue samples
plainn = 11- Asserted: passes — The authors put it forward as true.
- Checkable: passes — It can be checked against evidence.
- Load-bearing: fails — The paper’s conclusions may not depend on it.
- Based: passes — The paper gives a reason why it holds.
Probably not a substantial claim. The paper’s conclusions may not depend on it. It may state two separate claims as one.
In the paper
“These modules were enriched for AD risk loci identified by genome-wide association studies (GWAS), and contained a large number of glial proteins.”
§ Deep proteomic network analysis of Alzheimer’s disease brain reveals alterations in RNA binding proteins and RNA splicing associated with disease > Background
What the sources say
- Not checked yetcites [5] Seyfried NT, Dammer EB, Swarup V, Nandakumar D, Duong DM, Yin L, Deng Q, Nguyen T, Hales CM, Wingo T, et al. A multi-network approach identifies protein-specific co-expression in asymptomatic and symptomatic Alzheimer's disease. Cell Syst. 2017;4:60–72 e64. source
plaincorrelational- Asserted: passes — The authors put it forward as true.
- Checkable: passes — It can be checked against evidence.
- Load-bearing: passes — The paper’s conclusions depend on it.
- Based: passes — The paper gives a reason why it holds.
It may state two separate claims as one.
In the paper
“Spectra matches were filtered by Percolator [15] to a peptide-spectrum match false discovery rate of < 1%.”
§ Deep proteomic network analysis of Alzheimer’s disease brain reveals alterations in RNA binding proteins and RNA splicing associated with disease > Methods > Database search and quantification via TMT SPS-MS3 intensities
What the sources say
- Not checked yetcites [15] Kall L, Canterbury JD, Weston J, Noble WS, MacCoss MJ. Semi-supervised learning for peptide identification from shotgun proteomics datasets. Nat Methods. 2007;4:923–5. source
plain- Asserted: passes — The authors put it forward as true.
- Checkable: passes — It can be checked against evidence.
- Load-bearing: passes — The paper’s conclusions depend on it.
- Based: passes — The paper gives a reason why it holds.
Probably not a substantial claim.
In the paper
“The most recent generation of TMTs can be used to report the relative levels of a given peptide from a pool consisting of up to 11 separate and independent samples [10].”
§ Deep proteomic network analysis of Alzheimer’s disease brain reveals alterations in RNA binding proteins and RNA splicing associated with disease > Background
What the sources say
- Not checked yetcites [10] Ping L, Duong DM, Yin L, Gearing M, Lah JJ, Levey AI, Seyfried NT: Global quantitative analysis of the human brain proteome in Alzheimer’s and Parkinson’s Disease. Nature Scientific Data 2018.
plainn = 11- Asserted: passes — The authors put it forward as true.
- Checkable: passes — It can be checked against evidence.
- Load-bearing: passes — The paper’s conclusions depend on it.
- Based: passes — The paper gives a reason why it holds.
Probably not a substantial claim.
In the paper
“Using an appropriate pooled sample study design and mass spectrometry instrumentation that can perform MS3 reporter quantitation, missing values can be minimized within an experimental cohort using a TMT approach while avoiding dynamic range compression effects [8].”
§ Deep proteomic network analysis of Alzheimer’s disease brain reveals alterations in RNA binding proteins and RNA splicing associated with disease > Background
What the sources say
- Not checked yetcites [8] Ting L, Rad R, Gygi SP, Haas W. MS3 eliminates ratio distortion in isobaric multiplexed quantitative proteomics. Nat Methods. 2011;8:937–40. source
plaindirect- Asserted: passes — The authors put it forward as true.
- Checkable: passes — It can be checked against evidence.
- Load-bearing: passes — The paper’s conclusions depend on it.
- Based: passes — The paper gives a reason why it holds.
Probably not a substantial claim.
What the paper did — it cites no source for this, so there is none to check. The quote shows it is in the paper.
In the paper
“A naïve first pass regression was performed by considering age, sex, post-mortem interval (PMI), and disease status group contributions to each sample-specific protein abundance measurement set (n = 47), explicitly modeled using 1000 iterations of ordinary nonparametric bootstrap regression.”
§ Deep proteomic network analysis of Alzheimer’s disease brain reveals alterations in RNA binding proteins and RNA splicing associated with disease > Methods > Regression for covariates
plainn = 47- Asserted: passes — The authors put it forward as true.
- Checkable: passes — It can be checked against evidence.
- Load-bearing: passes — The paper’s conclusions depend on it.
- Based: passes — The paper gives a reason why it holds.
Probably not a substantial claim.
The paper states this without a source or data behind it here, so there is nothing to check it against. The quote shows it is in the paper.
In the paper
“The amount of information that can be obtained from such systems-level proteomic analyses is critically dependent upon the number of proteins that can be quantified across a cohort.”
§ Deep proteomic network analysis of Alzheimer’s disease brain reveals alterations in RNA binding proteins and RNA splicing associated with disease > Abstract > Methods
plaindirect- Asserted: passes — The authors put it forward as true.
- Checkable: passes — It can be checked against evidence.
- Load-bearing: passes — The paper’s conclusions depend on it.
- Based: fails — The paper may give no reason why it holds.
Probably not a substantial claim. The paper may give no reason why it holds.
What the paper did — it cites no source for this, so there is none to check. The quote shows it is in the paper.
In the paper
“Finally, proteins with more than 23 missing log2(ratio) values were excluded from analysis, and then 11 MCI cases were dropped, leaving a matrix of n = 47 control, AsymAD, and AD cases with no more than 23 missing values (< 50%) per protein measurement, for a total of 6532 proteins.”
§ Deep proteomic network analysis of Alzheimer’s disease brain reveals alterations in RNA binding proteins and RNA splicing associated with disease > Methods > TMT quantitative data normalization
plainn = 47- Asserted: passes — The authors put it forward as true.
- Checkable: passes — It can be checked against evidence.
- Load-bearing: passes — The paper’s conclusions depend on it.
- Based: passes — The paper gives a reason why it holds.
Probably not a substantial claim. It may state two separate claims as one.
What the paper did — it cites no source for this, so there is none to check. The quote shows it is in the paper.
In the paper
“Furthermore, proteins with more than 4 unquantifiable batches (out of a total of 8 batches) due to 0 or NA value for the GIS channel 126 reporter Proteome Discoverer 2.1-normalized value (pre-ratio calculation) were excluded from consideration.”
§ Deep proteomic network analysis of Alzheimer’s disease brain reveals alterations in RNA binding proteins and RNA splicing associated with disease > Methods > TMT quantitative data normalization
plain- Asserted: passes — The authors put it forward as true.
- Checkable: passes — It can be checked against evidence.
- Load-bearing: fails — The paper’s conclusions may not depend on it.
- Based: passes — The paper gives a reason why it holds.
Probably not a substantial claim. The paper’s conclusions may not depend on it.
None of the sources cited for this claim have been checked yet.
In the paper
“One strategy to minimize the missing value problem is to measure peptide and protein levels using a multiplex tagging approach with isobaric tandem mass tags (TMTs) [8–11].”
§ Deep proteomic network analysis of Alzheimer’s disease brain reveals alterations in RNA binding proteins and RNA splicing associated with disease > Background
What the sources say
- Not checked yetcites [8] Ting L, Rad R, Gygi SP, Haas W. MS3 eliminates ratio distortion in isobaric multiplexed quantitative proteomics. Nat Methods. 2011;8:937–40. source
- Not checked yetcites [9] Rauniyar N, Yates JR 3rd. Isobaric labeling-based relative quantification in shotgun proteomics. J Proteome Res. 2014;13:5293–309. source
- Not checked yetcites [10] Ping L, Duong DM, Yin L, Gearing M, Lah JJ, Levey AI, Seyfried NT: Global quantitative analysis of the human brain proteome in Alzheimer’s and Parkinson’s Disease. Nature Scientific Data 2018.
- Not checked yetcites [11] Rangaraju S, Dammer EB, Raza SA, Gao T, Xiao H, Betarbet R, Duong DM, Webster JA, Hales CM, Lah JJ, et al. Quantitative proteomics of acutely-isolated mouse microglia identifies novel immune Alzheimer's disease-related proteins. Mol Neurodegener. 2018;13:34. source
plaindirect- Asserted: passes — The authors put it forward as true.
- Checkable: passes — It can be checked against evidence.
- Load-bearing: passes — The paper’s conclusions depend on it.
- Based: passes — The paper gives a reason why it holds.
Probably not a substantial claim.
In the paper
“We found modules of co-expressed proteins that correlated with AD phenotypes, some of which were enriched in proteins identified as risk factors for AD by genetic studies.”
§ Deep proteomic network analysis of Alzheimer’s disease brain reveals alterations in RNA binding proteins and RNA splicing associated with disease > Abstract > Background
What the sources say
- Not checked yetcites [5] Seyfried NT, Dammer EB, Swarup V, Nandakumar D, Duong DM, Yin L, Deng Q, Nguyen T, Hales CM, Wingo T, et al. A multi-network approach identifies protein-specific co-expression in asymptomatic and symptomatic Alzheimer's disease. Cell Syst. 2017;4:60–72 e64. source
plaincorrelational- Asserted: passes — The authors put it forward as true.
- Checkable: passes — It can be checked against evidence.
- Load-bearing: unclear — It is unclear whether the paper’s conclusions depend on it.
- Based: passes — The paper gives a reason why it holds.
It may state two separate claims as one.
None of the sources cited for this claim have been checked yet.
In the paper
“Systems-based approaches such as weighted gene co-expression network analysis (WGCNA) can be used to analyze biochemical and cellular changes in brain, and are useful to help capture the complexity of perturbations in biological networks that are related to disease [2–4].”
§ Deep proteomic network analysis of Alzheimer’s disease brain reveals alterations in RNA binding proteins and RNA splicing associated with disease > Background
What the sources say
- Not checked yetcites [2] Huan T, Zhang B, Wang Z, Joehanes R, Zhu J, Johnson AD, Ying S, Munson PJ, Raghavachari N, Wang R, et al. A systems biology framework identifies molecular underpinnings of coronary heart disease. Arterioscler Thromb Vasc Biol. 2013;33:1427–34. source
- Not checked yetcites [3] Miller JA, Oldham MC, Geschwind DH. A systems level analysis of transcriptional changes in Alzheimer's disease and normal aging. J Neurosci. 2008;28:1410–20. source
- Not checked yetcites [4] Oldham MC, Konopka G, Iwamoto K, Langfelder P, Kato T, Horvath S, Geschwind DH. Functional organization of the transcriptome in human brain. Nat Neurosci. 2008;11:1271–82. source
plaincorrelational- Asserted: passes — The authors put it forward as true.
- Checkable: passes — It can be checked against evidence.
- Load-bearing: passes — The paper’s conclusions depend on it.
- Based: passes — The paper gives a reason why it holds.
Probably not a substantial claim. It may state two separate claims as one.
In the paper
“In a previous study we used an unbiased label-free quantitative mass spectrometry-based proteomic approach to analyze these changes at a systems level in post-mortem cortical tissue from patients with Alzheimer’s disease (AD), asymptomatic Alzheimer’s disease (AsymAD), and controls.”
§ Deep proteomic network analysis of Alzheimer’s disease brain reveals alterations in RNA binding proteins and RNA splicing associated with disease > Abstract > Background
What the sources say
- Not checked yetcites [5] Seyfried NT, Dammer EB, Swarup V, Nandakumar D, Duong DM, Yin L, Deng Q, Nguyen T, Hales CM, Wingo T, et al. A multi-network approach identifies protein-specific co-expression in asymptomatic and symptomatic Alzheimer's disease. Cell Syst. 2017;4:60–72 e64. source
plain- Asserted: passes — The authors put it forward as true.
- Checkable: passes — It can be checked against evidence.
- Load-bearing: fails — The paper’s conclusions may not depend on it.
- Based: passes — The paper gives a reason why it holds.
Probably not a substantial claim. The paper’s conclusions may not depend on it.
What the paper did — it cites no source for this, so there is none to check. The quote shows it is in the paper.
In the paper
“Peptides from different genomic sites that were 100% homologous to the junction-spanning peptides were considered duplicates and were removed from consideration.”
§ Deep proteomic network analysis of Alzheimer’s disease brain reveals alterations in RNA binding proteins and RNA splicing associated with disease > Methods > Proteogenomic RNA alternative splicing analysis based on gapped transcriptome reads
plain- Asserted: passes — The authors put it forward as true.
- Checkable: passes — It can be checked against evidence.
- Load-bearing: fails — The paper’s conclusions may not depend on it.
- Based: passes — The paper gives a reason why it holds.
Probably not a substantial claim. The paper’s conclusions may not depend on it.
In the paper
“The Aβ17–28 peptide is a proteolytic fragment of Aβ generated by both trypsin and LysC enzymatic digestion of the full-length Aβ peptide, and therefore represents a peptide with a very large change in abundance across the sample cohort due to aggregation of Aβ into amyloid plaques in AsymAD and AD cases [5].”
§ Deep proteomic network analysis of Alzheimer’s disease brain reveals alterations in RNA binding proteins and RNA splicing associated with disease > Results > TMT quantification pipeline increases the depth of proteomic network analysis of human brain tissues
What the sources say
- Not checked yetcites [5] Seyfried NT, Dammer EB, Swarup V, Nandakumar D, Duong DM, Yin L, Deng Q, Nguyen T, Hales CM, Wingo T, et al. A multi-network approach identifies protein-specific co-expression in asymptomatic and symptomatic Alzheimer's disease. Cell Syst. 2017;4:60–72 e64. source
plaindirect- Asserted: passes — The authors put it forward as true.
- Checkable: passes — It can be checked against evidence.
- Load-bearing: unclear — It is unclear whether the paper’s conclusions depend on it.
- Based: passes — The paper gives a reason why it holds.
It may state two separate claims as one.
What the paper did — it cites no source for this, so there is none to check. The quote shows it is in the paper.
In the paper
“For the purposes of avoiding spurious correlations, no more than 25 out of 47 missing values were allowed for any peptide.”
§ Deep proteomic network analysis of Alzheimer’s disease brain reveals alterations in RNA binding proteins and RNA splicing associated with disease > Methods > Proteogenomic RNA alternative splicing analysis based on gapped transcriptome reads
plain- Asserted: passes — The authors put it forward as true.
- Checkable: passes — It can be checked against evidence.
- Load-bearing: passes — The paper’s conclusions depend on it.
- Based: passes — The paper gives a reason why it holds.
Probably not a substantial claim.
None of the sources cited for this claim have been checked yet.
In the paper
“This asymptomatic phase of AD (AsymAD) is currently considered a preclinical stage of the disease [27, 28].”
§ Deep proteomic network analysis of Alzheimer’s disease brain reveals alterations in RNA binding proteins and RNA splicing associated with disease > Results > Brain cell type changes and protein abundance differences between asymptomatic and symptomatic AD
What the sources say
- Not checked yetcites [27] Dubois B, Hampel H, Feldman HH, Scheltens P, Aisen P, Andrieu S, Bakardjian H, Benali H, Bertram L, Blennow K, et al. Preclinical Alzheimer's disease: definition, natural history, and diagnostic criteria. Alzheimers Dement. 2016;12:292–323. source
- Not checked yetcites [28] Sperling RA, Aisen PS, Beckett LA, Bennett DA, Craft S, Fagan AM, Iwatsubo T, Jack CR Jr, Kaye J, Montine TJ, et al. Toward defining the preclinical stages of Alzheimer's disease: recommendations from the National Institute on Aging-Alzheimer's Association workgroups on diagnostic guidelines for Alzheimer's disease. Alzheimers Dement. 2011;7:280–92. source
plain- Asserted: passes — The authors put it forward as true.
- Checkable: passes — It can be checked against evidence.
- Load-bearing: fails — The paper’s conclusions may not depend on it.
- Based: passes — The paper gives a reason why it holds.
Probably not a substantial claim. The paper’s conclusions may not depend on it.
In the paper
“The neuropathological changes that are quintessential for AD diagnosis—namely, the development of amyloid plaques and tau tangles—are considered to develop years before onset of the cognitive changes that characterize AD dementia [26].”
§ Deep proteomic network analysis of Alzheimer’s disease brain reveals alterations in RNA binding proteins and RNA splicing associated with disease > Results > Brain cell type changes and protein abundance differences between asymptomatic and symptomatic AD
What the sources say
- Not checked yetcites [26] Jack CR, Jr., Knopman DS, Jagust WJ, Shaw LM, Aisen PS, Weiner MW, Petersen RC, Trojanowski JQ: Hypothetical model of dynamic biomarkers of the Alzheimer's pathological cascade. Lancet Neurol 2010, 9:119–128. source
plaincorrelational- Asserted: passes — The authors put it forward as true.
- Checkable: passes — It can be checked against evidence.
- Load-bearing: passes — The paper’s conclusions depend on it.
- Based: passes — The paper gives a reason why it holds.
Probably not a substantial claim.
What the paper did — it cites no source for this, so there is none to check. The quote shows it is in the paper.
In the paper
“Threshold power Beta for reduction of false positive correlations (i.e. the beneficial effect of enforcing scale free topology) was sampled in increments of 0.5 and selected as the lowest power at which scale free topology R2 was approximately 0.80, or in the case of the cell type weight-regressed network, the power at which a horizontal asymptote (plateau) was nearly approached, near a scale free”
§ Deep proteomic network analysis of Alzheimer’s disease brain reveals alterations in RNA binding proteins and RNA splicing associated with disease > Methods > Weighted protein correlation network analysis (WPCNA)
plain- Asserted: passes — The authors put it forward as true.
- Checkable: passes — It can be checked against evidence.
- Load-bearing: passes — The paper’s conclusions depend on it.
- Based: passes — The paper gives a reason why it holds.
Probably not a substantial claim. It may state two separate claims as one.
What the paper did — it cites no source for this, so there is none to check. The quote shows it is in the paper.
In the paper
“Regression for age, sex, and PMI covariation was performed in R on all log2 transformed values except for 781 that could not be regressed due to a high number of missing values.”
§ Deep proteomic network analysis of Alzheimer’s disease brain reveals alterations in RNA binding proteins and RNA splicing associated with disease > Methods > Proteogenomic RNA alternative splicing analysis based on gapped transcriptome reads
plain- Asserted: passes — The authors put it forward as true.
- Checkable: passes — It can be checked against evidence.
- Load-bearing: passes — The paper’s conclusions depend on it.
- Based: passes — The paper gives a reason why it holds.
Probably not a substantial claim.
A conclusion the paper draws from its own results — it cites no other source for it, so there is none to check. The quote shows it is in the paper.
In the paper
“Therefore, the changes associated with progression to AsymAD are a decrease in neurons and an increase in oligodendrocytes mostly associated with amyloid burden.”
§ Deep proteomic network analysis of Alzheimer’s disease brain reveals alterations in RNA binding proteins and RNA splicing associated with disease > Results > Brain cell type changes and protein abundance differences between asymptomatic and symptomatic AD
plaincorrelational- Asserted: passes — The authors put it forward as true.
- Checkable: passes — It can be checked against evidence.
- Load-bearing: passes — The paper’s conclusions depend on it.
- Based: passes — The paper gives a reason why it holds.
It may state two separate claims as one.
What the paper did — it cites no source for this, so there is none to check. The quote shows it is in the paper.
In the paper
“All junction-spanning peptides considered were ones that had alternative events represented by other gapped reads that shared a left (5′) or right (3′) end with another set of gapped reads, and not “singleton” or brain constitutive exon-exon junctions.”
§ Deep proteomic network analysis of Alzheimer’s disease brain reveals alterations in RNA binding proteins and RNA splicing associated with disease > Methods > Proteogenomic RNA alternative splicing analysis based on gapped transcriptome reads
plainn = 6- Asserted: passes — The authors put it forward as true.
- Checkable: passes — It can be checked against evidence.
- Load-bearing: passes — The paper’s conclusions depend on it.
- Based: passes — The paper gives a reason why it holds.
Probably not a substantial claim. It may state two separate claims as one.
What the paper did — it cites no source for this, so there is none to check. The quote shows it is in the paper.
In the paper
“A second, two-pass regression scheme was performed by first considering DSA estimated cell type weight for the four Sharma dataset brain cell types (microglia, astrocytes, neurons, and oligodendroglia) as four sets of variables for regression.”
§ Deep proteomic network analysis of Alzheimer’s disease brain reveals alterations in RNA binding proteins and RNA splicing associated with disease > Methods > Regression for covariates
plainn = 47- Asserted: passes — The authors put it forward as true.
- Checkable: passes — It can be checked against evidence.
- Load-bearing: fails — The paper’s conclusions may not depend on it.
- Based: passes — The paper gives a reason why it holds.
Probably not a substantial claim. The paper’s conclusions may not depend on it.
None of the sources cited for this claim have been checked yet.
In the paper
“Genetic variants that impart increased or decreased risk for AD have been mapped by genome wide association studies (GWAS), which collectively have identified over 20 genetic loci associated with AD at genome-wide significance, and many other loci that fall below genome-wide significance [12, 25].”
§ Deep proteomic network analysis of Alzheimer’s disease brain reveals alterations in RNA binding proteins and RNA splicing associated with disease > Results > AD genetic risk factors cluster in glial modules
What the sources say
- Not checked yetcites [12] Lambert JC, Ibrahim-Verbaas CA, Harold D, Naj AC, Sims R, Bellenguez C, DeStafano AL, Bis JC, Beecham GW, Grenier-Boley B, et al. Meta-analysis of 74,046 individuals identifies 11 new susceptibility loci for Alzheimer's disease. Nat Genet. 2013;45:1452–8. source
- Not checked yetcites [25] Sims R, van der Lee SJ, Naj AC, Bellenguez C, Badarinarayan N, Jakobsdottir J, Kunkle BW, Boland A, Raybould R, Bis JC, et al. Rare coding variants in PLCG2, ABI3, and TREM2 implicate microglial-mediated innate immunity in Alzheimer's disease. Nat Genet. 2017;49:1373–84. source
plaincorrelational- Asserted: passes — The authors put it forward as true.
- Checkable: passes — It can be checked against evidence.
- Load-bearing: fails — The paper’s conclusions may not depend on it.
- Based: passes — The paper gives a reason why it holds.
Probably not a substantial claim. The paper’s conclusions may not depend on it. It may state two separate claims as one.
None of the sources cited for this claim have been checked yet.
In the paper
“The cell type “character” of each module can be assessed by examining the overlap of module protein membership with cell type specific protein expression data [5, 17].”
§ Deep proteomic network analysis of Alzheimer’s disease brain reveals alterations in RNA binding proteins and RNA splicing associated with disease > Results > TMT quantification pipeline increases the depth of proteomic network analysis of human brain tissues
What the sources say
- Not checked yetcites [5] Seyfried NT, Dammer EB, Swarup V, Nandakumar D, Duong DM, Yin L, Deng Q, Nguyen T, Hales CM, Wingo T, et al. A multi-network approach identifies protein-specific co-expression in asymptomatic and symptomatic Alzheimer's disease. Cell Syst. 2017;4:60–72 e64. source
- Not checked yetcites [17] Sharma K, Schmitt S, Bergner CG, Tyanova S, Kannaiyan N, Manrique-Hoyos N, Kongi K, Cantuti L, Hanisch UK, Philips MA, et al. Cell type- and brain region-resolved mouse brain proteome. Nat Neurosci. 2015;18:1819–31. source
plaincorrelational- Asserted: passes — The authors put it forward as true.
- Checkable: passes — It can be checked against evidence.
- Load-bearing: fails — The paper’s conclusions may not depend on it.
- Based: passes — The paper gives a reason why it holds.
Probably not a substantial claim. The paper’s conclusions may not depend on it.
What the paper did — it cites no source for this, so there is none to check. The quote shows it is in the paper.
In the paper
“Importantly, missing values did not require imputation for bootstrap covariate regression.”
§ Deep proteomic network analysis of Alzheimer’s disease brain reveals alterations in RNA binding proteins and RNA splicing associated with disease > Methods > Regression for covariates
plainn = 47- Asserted: passes — The authors put it forward as true.
- Checkable: passes — It can be checked against evidence.
- Load-bearing: fails — The paper’s conclusions may not depend on it.
- Based: fails — The paper may give no reason why it holds.
Probably not a substantial claim. The paper’s conclusions may not depend on it. The paper may give no reason why it holds.
What the paper did — it cites no source for this, so there is none to check. The quote shows it is in the paper.
In the paper
“Quantitations of within-batch normalized abundances were then scaled across batches to set the average of all GIS measurements within batch to be identical across batches.”
§ Deep proteomic network analysis of Alzheimer’s disease brain reveals alterations in RNA binding proteins and RNA splicing associated with disease > Methods > Proteogenomic RNA alternative splicing analysis based on gapped transcriptome reads
plain- Asserted: passes — The authors put it forward as true.
- Checkable: passes — It can be checked against evidence.
- Load-bearing: passes — The paper’s conclusions depend on it.
- Based: passes — The paper gives a reason why it holds.
Probably not a substantial claim.
What the paper did — it cites no source for this, so there is none to check. The quote shows it is in the paper.
In the paper
“Following normalization of cell type abundance variation across the samples, the prior age, sex, and PMI regression scheme was used to remove these covariate effects.”
§ Deep proteomic network analysis of Alzheimer’s disease brain reveals alterations in RNA binding proteins and RNA splicing associated with disease > Methods > Regression for covariates
plaindirectn = 47- Asserted: passes — The authors put it forward as true.
- Checkable: passes — It can be checked against evidence.
- Load-bearing: passes — The paper’s conclusions depend on it.
- Based: passes — The paper gives a reason why it holds.
Probably not a substantial claim.
What the paper did — it cites no source for this, so there is none to check. The quote shows it is in the paper.
In the paper
“Then age, sex, and PMI covarying components of the measurement were subtracted to arrive at a regressed protein abundance measurement set.”
§ Deep proteomic network analysis of Alzheimer’s disease brain reveals alterations in RNA binding proteins and RNA splicing associated with disease > Methods > Regression for covariates
plainn = 47- Asserted: passes — The authors put it forward as true.
- Checkable: passes — It can be checked against evidence.
- Load-bearing: passes — The paper’s conclusions depend on it.
- Based: passes — The paper gives a reason why it holds.
Probably not a substantial claim.
What the paper did — it cites no source for this, so there is none to check. The quote shows it is in the paper.
In the paper
“As part of the new analysis approach, we also relaxed the data inclusion criteria to require missing values in < 50% rather than < 10% of the samples, given that the WGCNA algorithm for coexpression network analysis well-tolerates missing values up to 50%.”
§ Deep proteomic network analysis of Alzheimer’s disease brain reveals alterations in RNA binding proteins and RNA splicing associated with disease > Results > TMT quantification pipeline increases the depth of proteomic network analysis of human brain tissues
boosted- Asserted: passes — The authors put it forward as true.
- Checkable: passes — It can be checked against evidence.
- Load-bearing: passes — The paper’s conclusions depend on it.
- Based: passes — The paper gives a reason why it holds.
It may state two separate claims as one.
- Rests on an assumption: The WGCNA algorithm for coexpression network analysis well-tolerates missing values up to 50%.
A conclusion the paper draws from its own results — it cites no other source for it, so there is none to check. The quote shows it is in the paper.
In the paper
“Progression from AsymAD to AD—that is, symptom onset—is associated with an increase in astrocytes and microglia, and is associated with neurofibrillary tangle burden.”
§ Deep proteomic network analysis of Alzheimer’s disease brain reveals alterations in RNA binding proteins and RNA splicing associated with disease > Results > Brain cell type changes and protein abundance differences between asymptomatic and symptomatic AD
plaincorrelational- Asserted: passes — The authors put it forward as true.
- Checkable: passes — It can be checked against evidence.
- Load-bearing: passes — The paper’s conclusions depend on it.
- Based: passes — The paper gives a reason why it holds.
It may state two separate claims as one.
In the paper
“This approach has previously been applied to transcriptomic data to remove the confounding effects of cell type changes on gene expression [30], but to our knowledge has not previously been applied to proteomic data.”
§ Deep proteomic network analysis of Alzheimer’s disease brain reveals alterations in RNA binding proteins and RNA splicing associated with disease > Results > Brain cell type changes and protein abundance differences between asymptomatic and symptomatic AD
What the sources say
- Not checked yetcites [30] Allen M, Wang X, Burgess JD, Watzlawik J, Serie DJ, Younkin CS, Nguyen T, Malphrus KG, Lincoln S, Carrasquillo MM, et al. Conserved brain myelination networks are altered in Alzheimer's and other neurodegenerative diseases. Alzheimers Dement. 2018;14:352–66. source
hedged- Asserted: passes — The authors put it forward as true.
- Checkable: passes — It can be checked against evidence.
- Load-bearing: fails — The paper’s conclusions may not depend on it.
- Based: passes — The paper gives a reason why it holds.
Probably not a substantial claim. The paper’s conclusions may not depend on it. It may state two separate claims as one.
A conclusion the paper draws from its own results — it cites no other source for it, so there is none to check. The quote shows it is in the paper.
In the paper
“In summary, we identified a number of alternative splicing decisions at the protein level in brain that significantly change in AD, including in AD risk factor proteins identified from GWAS.”
§ Deep proteomic network analysis of Alzheimer’s disease brain reveals alterations in RNA binding proteins and RNA splicing associated with disease > Results > Alternative splicing events associated with AD pathology and cognitive function
plaincorrelational- Asserted: passes — The authors put it forward as true.
- Checkable: passes — It can be checked against evidence.
- Load-bearing: passes — The paper’s conclusions depend on it.
- Based: passes — The paper gives a reason why it holds.
It may state two separate claims as one.
None of the sources cited for this claim have been checked yet.
In the paper
“Interestingly, our previous studies demonstrated that many of the U1 snRNPs colocalize with neurofibrillary tangles and paired helical filaments in AD brain [24, 32–34], and that accumulation of insoluble snRNPs correlates strongly with both amyloid and Tau pathology [32–37].”
§ Deep proteomic network analysis of Alzheimer’s disease brain reveals alterations in RNA binding proteins and RNA splicing associated with disease > Results > RNA binding protein enrichment in the AD brain TMT proteomic network
What the sources say
- Not checked yetcites [32] Hales CM, Dammer EB, Deng Q, Duong DM, Gearing M, Troncoso JC, Thambisetty M, Lah JJ, Shulman JM, Levey AI, Seyfried NT. Changes in the detergent-insoluble brain proteome linked to amyloid and tau in Alzheimer's disease progression. Proteomics. 2016;16:3042–53. source
- Not checked yetcites [33] Hales CM, Dammer EB, Diner I, Yi H, Seyfried NT, Gearing M, Glass JD, Montine TJ, Levey AI, Lah JJ. Aggregates of small nuclear ribonucleic acids (snRNAs) in Alzheimer's disease. Brain Pathol. 2014;24:344–51. source
- Not checked yetcites [34] Hales CM, Seyfried NT, Dammer EB, Duong D, Yi H, Gearing M, Troncoso JC, Mufson EJ, Thambisetty M, Levey AI, Lah JJ. U1 small nuclear ribonucleoproteins (snRNPs) aggregate in Alzheimer's disease due to autosomal dominant genetic mutations and trisomy 21. Mol Neurodegener. 2014;9:15. source
- Not checked yetcites [35] Ash PE, Vanderweyde TE, Youmans KL, Apicco DJ, Wolozin B. Pathological stress granules in Alzheimer's disease. Brain Res. 2014;1584:52–8. source
- Not checked yetcites [36] Maziuk BF, Apicco DJ, Cruz AL, Jiang L, Ash PEA, da Rocha EL, Zhang C, Yu WH, Leszyk J, Abisambra JF, et al. RNA binding proteins co-localize with small tau inclusions in tauopathy. Acta Neuropathol Commun. 2018;6:71. source
- Not checked yetcites [37] Vanderweyde T, Yu H, Varnum M, Liu-Yesucevitz L, Citro A, Ikezu T, Duff K, Wolozin B. Contrasting pathology of the stress granule proteins TIA-1 and G3BP in tauopathies. J Neurosci. 2012;32:8270–83. source
boostedcorrelational- Asserted: passes — The authors put it forward as true.
- Checkable: passes — It can be checked against evidence.
- Load-bearing: fails — The paper’s conclusions may not depend on it.
- Based: passes — The paper gives a reason why it holds.
Probably not a substantial claim. The paper’s conclusions may not depend on it.
A conclusion the paper draws from its own results — it cites no other source for it, so there is none to check. The quote shows it is in the paper.
In the paper
“In summary, these findings suggest that a majority of the differences in protein abundance between AsymAD and AD appear to be independent of simple brain cell type abundance changes, in contrast to the protein abundance differences between control and AsymAD and control and AD.”
§ Deep proteomic network analysis of Alzheimer’s disease brain reveals alterations in RNA binding proteins and RNA splicing associated with disease > Results > Brain cell type changes and protein abundance differences between asymptomatic and symptomatic AD
hedgedcorrelational- Asserted: passes — The authors put it forward as true.
- Checkable: passes — It can be checked against evidence.
- Load-bearing: passes — The paper’s conclusions depend on it.
- Based: passes — The paper gives a reason why it holds.
It may state two separate claims as one.
A conclusion the paper draws from its own results — it cites no other source for it, so there is none to check. The quote shows it is in the paper.
In the paper
“potentially reflecting AD “resilience” modules.”
§ Deep proteomic network analysis of Alzheimer’s disease brain reveals alterations in RNA binding proteins and RNA splicing associated with disease > Discussion
hedgedcorrelational- Asserted: passes — The authors put it forward as true.
- Checkable: passes — It can be checked against evidence.
- Load-bearing: fails — The paper’s conclusions may not depend on it.
- Based: passes — The paper gives a reason why it holds.
Probably not a substantial claim. The paper’s conclusions may not depend on it.
None of the sources cited for this claim have been checked yet.
In the paper
“We have previously shown that U1 snRNPs are a major component of the AD insoluble proteome [24, 32–34].”
§ Deep proteomic network analysis of Alzheimer’s disease brain reveals alterations in RNA binding proteins and RNA splicing associated with disease > Results > Alternative splicing events associated with AD pathology and cognitive function
What the sources say
- Not checked yetcites [24] Bai B, Hales CM, Chen PC, Gozal Y, Dammer EB, Fritz JJ, Wang X, Xia Q, Duong DM, Street C, et al. U1 small nuclear ribonucleoprotein complex and RNA splicing alterations in Alzheimer's disease. Proc Natl Acad Sci U S A. 2013;110:16562–7. source
- Not checked yetcites [32] Hales CM, Dammer EB, Deng Q, Duong DM, Gearing M, Troncoso JC, Thambisetty M, Lah JJ, Shulman JM, Levey AI, Seyfried NT. Changes in the detergent-insoluble brain proteome linked to amyloid and tau in Alzheimer's disease progression. Proteomics. 2016;16:3042–53. source
- Not checked yetcites [33] Hales CM, Dammer EB, Diner I, Yi H, Seyfried NT, Gearing M, Glass JD, Montine TJ, Levey AI, Lah JJ. Aggregates of small nuclear ribonucleic acids (snRNAs) in Alzheimer's disease. Brain Pathol. 2014;24:344–51. source
- Not checked yetcites [34] Hales CM, Seyfried NT, Dammer EB, Duong D, Yi H, Gearing M, Troncoso JC, Mufson EJ, Thambisetty M, Levey AI, Lah JJ. U1 small nuclear ribonucleoproteins (snRNPs) aggregate in Alzheimer's disease due to autosomal dominant genetic mutations and trisomy 21. Mol Neurodegener. 2014;9:15. source
boosted- Asserted: passes — The authors put it forward as true.
- Checkable: passes — It can be checked against evidence.
- Load-bearing: fails — The paper’s conclusions may not depend on it.
- Based: passes — The paper gives a reason why it holds.
Probably not a substantial claim. The paper’s conclusions may not depend on it.
A conclusion the paper draws from its own results — it cites no other source for it, so there is none to check. The quote shows it is in the paper.
In the paper
“Modules that are enriched in alt-EEjxns do not overlap significantly with RNA binding protein modules, but many are located within the unique region of the TMT network and correlate with molecular markers of AD pathology.”
§ Deep proteomic network analysis of Alzheimer’s disease brain reveals alterations in RNA binding proteins and RNA splicing associated with disease > Results > Alternative splicing events associated with AD pathology and cognitive function
plaincorrelational- Asserted: passes — The authors put it forward as true.
- Checkable: passes — It can be checked against evidence.
- Load-bearing: passes — The paper’s conclusions depend on it.
- Based: passes — The paper gives a reason why it holds.
It may state two separate claims as one.
A conclusion the paper draws from its own results — it cites no other source for it, so there is none to check. The quote shows it is in the paper.
In the paper
“Some of these modules are strongly enriched with alt-EEjxns and correlate with cognitive function.”
§ Deep proteomic network analysis of Alzheimer’s disease brain reveals alterations in RNA binding proteins and RNA splicing associated with disease > Results > Alternative splicing events associated with AD pathology and cognitive function
boostedcorrelational- Asserted: passes — The authors put it forward as true.
- Checkable: passes — It can be checked against evidence.
- Load-bearing: passes — The paper’s conclusions depend on it.
- Based: passes — The paper gives a reason why it holds.
It may state two separate claims as one.
None of the sources cited for this claim have been checked yet.
In the paper
“The correlation between inflammation and tangle formation has also been noted in other tauopathies, such as frontotemporal dementia and chronic traumatic encephalopathy [42–45].”
§ Deep proteomic network analysis of Alzheimer’s disease brain reveals alterations in RNA binding proteins and RNA splicing associated with disease > Discussion
What the sources say
- Not checked yetcites [42] Bellucci A, Bugiani O, Ghetti B, Spillantini MG. Presence of reactive microglia and neuroinflammatory mediators in a case of frontotemporal dementia with P301S mutation. Neurodegener Dis. 2011;8:221–9. source
- Not checked yetcites [43] Cherry JD, Tripodis Y, Alvarez VE, Huber B, Kiernan PT, Daneshvar DH, Mez J, Montenigro PH, Solomon TM, Alosco ML, et al. Microglial neuroinflammation contributes to tau accumulation in chronic traumatic encephalopathy. Acta Neuropathol Commun. 2016;4:112. source
- Not checked yetcites [44] Maphis N, Xu G, Kokiko-Cochran ON, Jiang S, Cardona A, Ransohoff RM, Lamb BT, Bhaskar K. Reactive microglia drive tau pathology and contribute to the spreading of pathological tau in the brain. Brain. 2015;138:1738–55. source
- Not checked yetcites [45] Yoshiyama Y, Higuchi M, Zhang B, Huang SM, Iwata N, Saido TC, Maeda J, Suhara T, Trojanowski JQ, Lee VM. Synapse loss and microglial activation precede tangles in a P301S tauopathy mouse model. Neuron. 2007;53:337–51. source
plaincorrelational- Asserted: passes — The authors put it forward as true.
- Checkable: passes — It can be checked against evidence.
- Load-bearing: fails — The paper’s conclusions may not depend on it.
- Based: passes — The paper gives a reason why it holds.
Probably not a substantial claim. The paper’s conclusions may not depend on it.
A conclusion the paper draws from its own results — it cites no other source for it, so there is none to check. The quote shows it is in the paper.
In the paper
“Overall, we found that RNA binding proteins are enriched within specific network modules, and that these modules are generally positively correlated with AD pathology and negatively correlated with cognitive function.”
§ Deep proteomic network analysis of Alzheimer’s disease brain reveals alterations in RNA binding proteins and RNA splicing associated with disease > Results > Alternative splicing events associated with AD pathology and cognitive function
plaincorrelational- Asserted: passes — The authors put it forward as true.
- Checkable: passes — It can be checked against evidence.
- Load-bearing: passes — The paper’s conclusions depend on it.
- Based: passes — The paper gives a reason why it holds.
It may state two separate claims as one.
In the paper
“This finding lends validity to the previous LFQ network generated from the BLSA cohort, and by extension to LFQ-based networks of other cohorts we have analyzed ([41], unpublished data).”
§ Deep proteomic network analysis of Alzheimer’s disease brain reveals alterations in RNA binding proteins and RNA splicing associated with disease > Discussion
What the sources say
- Not checked yetcites [41] Umoh ME, Dammer EB, Dai J, Duong DM, Lah JJ, Levey AI, Gearing M, Glass JD, Seyfried NT. A proteomic network approach across the ALS-FTD disease spectrum resolves clinical phenotypes and genetic vulnerability in human brain. EMBO Mol Med. 2018;10:48–62. source
plaindirect- Asserted: passes — The authors put it forward as true.
- Checkable: passes — It can be checked against evidence.
- Load-bearing: passes — The paper’s conclusions depend on it.
- Based: passes — The paper gives a reason why it holds.
It may state two separate claims as one.
In the paper
“TPI1 is involved in gluconeogenesis, but has also been identified as interacting directly with the Parkin protein, a ubiquitin protein ligase, and potentially affecting mitochondrial function [39].”
§ Deep proteomic network analysis of Alzheimer’s disease brain reveals alterations in RNA binding proteins and RNA splicing associated with disease > Results > Alternative splicing events associated with modules enriched in AD risk factor proteins
What the sources say
- Not checked yetcites [39] Davison EJ, Pennington K, Hung CC, Peng J, Rafiq R, Ostareck-Lederer A, Ostareck DH, Ardley HC, Banks RE, Robinson PA. Proteomic analysis of increased Parkin expression and its interactants provides evidence for a role in modulation of mitochondrial function. Proteomics. 2009;9:4284–97. source
hedgedconditional- Asserted: passes — The authors put it forward as true.
- Checkable: passes — It can be checked against evidence.
- Load-bearing: fails — The paper’s conclusions may not depend on it.
- Based: passes — The paper gives a reason why it holds.
Probably not a substantial claim. The paper’s conclusions may not depend on it. It may state two separate claims as one.
What the paper did — it cites no source for this, so there is none to check. The quote shows it is in the paper.
In the paper
“However, missing values are not eliminated in the TMT approach as it still relies on data-dependent acquisition techniques within each batch, and therefore not all batches contain the protein measurement of interest.”
§ Deep proteomic network analysis of Alzheimer’s disease brain reveals alterations in RNA binding proteins and RNA splicing associated with disease > Discussion
plaindirect- Asserted: passes — The authors put it forward as true.
- Checkable: passes — It can be checked against evidence.
- Load-bearing: unclear — It is unclear whether the paper’s conclusions depend on it.
- Based: passes — The paper gives a reason why it holds.
It may state two separate claims as one.
In the paper
“Phosphorylation of tau at T231 has been associated with AD [38], and levels of this peptide are moderately correlated with tau tangle burden (Additional file 10: Figure S3D).”
§ Deep proteomic network analysis of Alzheimer’s disease brain reveals alterations in RNA binding proteins and RNA splicing associated with disease > Results > Alternative splicing events associated with AD pathology and cognitive function
What the sources say
- Not checked yetcites [38] Hampel H, Blennow K, Shaw LM, Hoessler YC, Zetterberg H, Trojanowski JQ. Total and phosphorylated tau protein as biological markers of Alzheimer's disease. Exp Gerontol. 2010;45:30–40. source
plaincorrelational- Asserted: passes — The authors put it forward as true.
- Checkable: passes — It can be checked against evidence.
- Load-bearing: fails — The paper’s conclusions may not depend on it.
- Based: passes — The paper gives a reason why it holds.
Probably not a substantial claim. The paper’s conclusions may not depend on it.
What the paper did — it cites no source for this, so there is none to check. The quote shows it is in the paper.
In the paper
“The databases we generated to identify alt-EEjxn peptides from brain were based on RNAseq data from relatively few control and AD brains from the University of Kentucky Brain Bank.”
§ Deep proteomic network analysis of Alzheimer’s disease brain reveals alterations in RNA binding proteins and RNA splicing associated with disease > Discussion
plain- Asserted: passes — The authors put it forward as true.
- Checkable: passes — It can be checked against evidence.
- Load-bearing: fails — The paper’s conclusions may not depend on it.
- Based: passes — The paper gives a reason why it holds.
Probably not a substantial claim. The paper’s conclusions may not depend on it.
In the paper
“as well as proteins with low complexity domains such as U1-70K that bind to RNA and that have been associated with other neurodegenerative conditions such as frontotemporal dementia [49].”
§ Deep proteomic network analysis of Alzheimer’s disease brain reveals alterations in RNA binding proteins and RNA splicing associated with disease > Discussion
What the sources say
- Not checked yetcites [49] King OD, Gitler AD, Shorter J. The tip of the iceberg: RNA-binding proteins with prion-like domains in neurodegenerative disease. Brain Res. 2012;1462:61–80. source
plaincorrelational- Asserted: passes — The authors put it forward as true.
- Checkable: passes — It can be checked against evidence.
- Load-bearing: fails — The paper’s conclusions may not depend on it.
- Based: passes — The paper gives a reason why it holds.
Probably not a substantial claim. The paper’s conclusions may not depend on it. It may state two separate claims as one.
In the paper
“given that tangle burden is more closely correlated with cortical atrophy and cognitive decline [46]”
§ Deep proteomic network analysis of Alzheimer’s disease brain reveals alterations in RNA binding proteins and RNA splicing associated with disease > Discussion
What the sources say
- Not checked yetcites [46] Nelson PT, Alafuzoff I, Bigio EH, Bouras C, Braak H, Cairns NJ, Castellani RJ, Crain BJ, Davies P, Del Tredici K, et al. Correlation of Alzheimer disease neuropathologic changes with cognitive status: a review of the literature. J Neuropathol Exp Neurol. 2012;71:362–81. source
plaincorrelational- Asserted: passes — The authors put it forward as true.
- Checkable: passes — It can be checked against evidence.
- Load-bearing: passes — The paper’s conclusions depend on it.
- Based: passes — The paper gives a reason why it holds.
Probably not a substantial claim.
In the paper
“unlike modules such as M4 and M7 which we have previously found to be astroglial and strongly associated with AD [5].”
§ Deep proteomic network analysis of Alzheimer’s disease brain reveals alterations in RNA binding proteins and RNA splicing associated with disease > Discussion
What the sources say
- Not checked yetcites [5] Seyfried NT, Dammer EB, Swarup V, Nandakumar D, Duong DM, Yin L, Deng Q, Nguyen T, Hales CM, Wingo T, et al. A multi-network approach identifies protein-specific co-expression in asymptomatic and symptomatic Alzheimer's disease. Cell Syst. 2017;4:60–72 e64. source
boostedcorrelational- Asserted: passes — The authors put it forward as true.
- Checkable: passes — It can be checked against evidence.
- Load-bearing: fails — The paper’s conclusions may not depend on it.
- Based: passes — The paper gives a reason why it holds.
Probably not a substantial claim. The paper’s conclusions may not depend on it. It may state two separate claims as one.
None of the sources cited for this claim have been checked yet.
In the paper
“Although we have previously observed that snRNP alterations are associated with deficits in RNA splicing in AD brain [24, 32]—a finding recently confirmed by others [52]”
§ Deep proteomic network analysis of Alzheimer’s disease brain reveals alterations in RNA binding proteins and RNA splicing associated with disease > Discussion
What the sources say
- Not checked yetcites [24] Bai B, Hales CM, Chen PC, Gozal Y, Dammer EB, Fritz JJ, Wang X, Xia Q, Duong DM, Street C, et al. U1 small nuclear ribonucleoprotein complex and RNA splicing alterations in Alzheimer's disease. Proc Natl Acad Sci U S A. 2013;110:16562–7. source
- Not checked yetcites [32] Hales CM, Dammer EB, Deng Q, Duong DM, Gearing M, Troncoso JC, Thambisetty M, Lah JJ, Shulman JM, Levey AI, Seyfried NT. Changes in the detergent-insoluble brain proteome linked to amyloid and tau in Alzheimer's disease progression. Proteomics. 2016;16:3042–53. source
- Not checked yetcites [52] Raj T, Li Y, Wong G, Ramdhani S, Wang Y-c, Ng B, Wang M, Gupta I, Haroutunian V, Zhang B, et al: Integrative analyses of splicing in the aging brain: role in susceptibility to Alzheimer's disease. bioRxiv 2017.
plaincorrelational- Asserted: passes — The authors put it forward as true.
- Checkable: passes — It can be checked against evidence.
- Load-bearing: fails — The paper’s conclusions may not depend on it.
- Based: passes — The paper gives a reason why it holds.
Probably not a substantial claim. The paper’s conclusions may not depend on it. It may state two separate claims as one.
A conclusion the paper draws from its own results — it cites no other source for it, so there is none to check. The quote shows it is in the paper.
In the paper
“This is likely the case because trypsin digestion is more efficient than LysC and provides deeper coverage of the proteome”
§ Deep proteomic network analysis of Alzheimer’s disease brain reveals alterations in RNA binding proteins and RNA splicing associated with disease > Discussion
hedgeddirect- Asserted: passes — The authors put it forward as true.
- Checkable: passes — It can be checked against evidence.
- Load-bearing: passes — The paper’s conclusions depend on it.
- Based: passes — The paper gives a reason why it holds.
Probably not a substantial claim. It may state two separate claims as one.
In the paper
“Because brain contains a large number of alternatively spliced proteins [50]”
§ Deep proteomic network analysis of Alzheimer’s disease brain reveals alterations in RNA binding proteins and RNA splicing associated with disease > Discussion
What the sources say
- Not checked yetcites [50] Yeo G, Holste D, Kreiman G, Burge CB. Variation in alternative splicing across human tissues. Genome Biol. 2004;5. source
plain- Asserted: passes — The authors put it forward as true.
- Checkable: passes — It can be checked against evidence.
- Load-bearing: fails — The paper’s conclusions may not depend on it.
- Based: passes — The paper gives a reason why it holds.
Probably not a substantial claim. The paper’s conclusions may not depend on it.
A conclusion the paper draws from its own results — it cites no other source for it, so there is none to check. The quote shows it is in the paper.
In the paper
“we consider it likely that deeper characterization of protein splice variants in brain will uncover even more local splice variations that are translated into protein, with some being potentially relevant to disease.”
§ Deep proteomic network analysis of Alzheimer’s disease brain reveals alterations in RNA binding proteins and RNA splicing associated with disease > Discussion
hedgedconditional- Asserted: passes — The authors put it forward as true.
- Checkable: fails — It may be too vague to check against evidence.
- Load-bearing: fails — The paper’s conclusions may not depend on it.
- Based: passes — The paper gives a reason why it holds.
Probably not a substantial claim. It may be too vague to check against evidence. The paper’s conclusions may not depend on it. It may state two separate claims as one.
A conclusion the paper draws from its own results — it cites no other source for it, so there is none to check. The quote shows it is in the paper.
In the paper
“but it seems likely based on abundant steady state transcript levels that a majority of these splice isoforms are translated into protein.”
§ Deep proteomic network analysis of Alzheimer’s disease brain reveals alterations in RNA binding proteins and RNA splicing associated with disease > Discussion
hedgedconditional- Asserted: passes — The authors put it forward as true.
- Checkable: passes — It can be checked against evidence.
- Load-bearing: fails — The paper’s conclusions may not depend on it.
- Based: passes — The paper gives a reason why it holds.
Probably not a substantial claim. The paper’s conclusions may not depend on it.
None of the sources cited for this claim have been checked yet.
In the paper
“which is consistent with recent transcriptomic data suggesting alterations in oligodendrocyte and myelination biology in AD brain [30, 47].”
§ Deep proteomic network analysis of Alzheimer’s disease brain reveals alterations in RNA binding proteins and RNA splicing associated with disease > Discussion
What the sources say
- Not checked yetcites [30] Allen M, Wang X, Burgess JD, Watzlawik J, Serie DJ, Younkin CS, Nguyen T, Malphrus KG, Lincoln S, Carrasquillo MM, et al. Conserved brain myelination networks are altered in Alzheimer's and other neurodegenerative diseases. Alzheimers Dement. 2018;14:352–66. source
- Not checked yetcites [47] McKenzie AT, Moyon S, Wang M, Katsyv I, Song WM, Zhou X, Dammer EB, Duong DM, Aaker J, Zhao Y, et al. Multiscale network modeling of oligodendrocytes reveals molecular components of myelin dysregulation in Alzheimer's disease. Mol Neurodegener. 2017;12:82. source
hedgedcorrelational- Asserted: passes — The authors put it forward as true.
- Checkable: passes — It can be checked against evidence.
- Load-bearing: fails — The paper’s conclusions may not depend on it.
- Based: passes — The paper gives a reason why it holds.
Probably not a substantial claim. The paper’s conclusions may not depend on it.
None of the sources cited for this claim have been checked yet.
In the paper
“This may be due to the fact that U1 spliceosome proteins undergo a dramatic shift in solubility in AD brain, and aggregate in close proximity to neurofibrillary tangles [24, 32–34].”
§ Deep proteomic network analysis of Alzheimer’s disease brain reveals alterations in RNA binding proteins and RNA splicing associated with disease > Discussion
What the sources say
- Not checked yetcites [24] Bai B, Hales CM, Chen PC, Gozal Y, Dammer EB, Fritz JJ, Wang X, Xia Q, Duong DM, Street C, et al. U1 small nuclear ribonucleoprotein complex and RNA splicing alterations in Alzheimer's disease. Proc Natl Acad Sci U S A. 2013;110:16562–7. source
- Not checked yetcites [32] Hales CM, Dammer EB, Deng Q, Duong DM, Gearing M, Troncoso JC, Thambisetty M, Lah JJ, Shulman JM, Levey AI, Seyfried NT. Changes in the detergent-insoluble brain proteome linked to amyloid and tau in Alzheimer's disease progression. Proteomics. 2016;16:3042–53. source
- Not checked yetcites [33] Hales CM, Dammer EB, Diner I, Yi H, Seyfried NT, Gearing M, Glass JD, Montine TJ, Levey AI, Lah JJ. Aggregates of small nuclear ribonucleic acids (snRNAs) in Alzheimer's disease. Brain Pathol. 2014;24:344–51. source
- Not checked yetcites [34] Hales CM, Seyfried NT, Dammer EB, Duong D, Yi H, Gearing M, Troncoso JC, Mufson EJ, Thambisetty M, Levey AI, Lah JJ. U1 small nuclear ribonucleoproteins (snRNPs) aggregate in Alzheimer's disease due to autosomal dominant genetic mutations and trisomy 21. Mol Neurodegener. 2014;9:15. source
hedgedcorrelational- Asserted: passes — The authors put it forward as true.
- Checkable: passes — It can be checked against evidence.
- Load-bearing: passes — The paper’s conclusions depend on it.
- Based: passes — The paper gives a reason why it holds.
It may state two separate claims as one.
The paper relies on this without support.
The altered biochemical and cellular processes that eventually lead to changes in cognition and pathology in AD are not well understood.
“While AD is currently defined by cognitive decline in the presence of amyloid plaque and tau tangle accumulation within the brain, the altered biochemical and cellular processes that eventually lead to changes in cognition and pathology are not well understood.”
The paper relies on this without support.
The WGCNA algorithm for coexpression network analysis well-tolerates missing values up to 50%.
“As part of the new analysis approach, we also relaxed the data inclusion criteria to require missing values in < 50% rather than < 10% of the samples, given that the WGCNA algorithm for coexpression network analysis well-tolerates missing values up to 50%.”
The paper relies on this without support.
Changes in RNA splicing leading to the expression of different protein isoforms may be a useful indicator of AD pathology and cause downstream cellular and network dysfunction leading to cognitive decline.
“Changes in RNA splicing leading to the expression of different protein isoforms may be a useful indicator of AD pathology and cause downstream cellular and network dysfunction leading to cognitive decline.”
The paper relies on this without support.
Either the 3-repeat or the 4-repeat microtubule binding domain isoform of tau can be considered constitutively expressed in humans.
“because either isoform can be considered constitutively expressed in humans.”
The paper relies on this without support.
The tau pT231 peptide lies within the proline-rich region of tau and is separate from the microtubule-binding region that aggregates into neurofibrillary tangles.
“which lies within the proline-rich region of tau and is separate from the microtubule-binding region that aggregates into neurofibrillary tangles.”
The paper relies on this without support.
Most of the common alternatively spliced transcripts present in DLPFC control and AD brain were represented in the RNAseq-based database used to identify alt-EEjxn peptides.
“However, most of the common alternatively spliced transcripts present in DLPFC control and AD brain were likely represented in this database.”
The paper relies on this without support.
FERMT2 is an AD risk factor protein.
“with the exception of FERMT2, which has been identified as an AD risk factor protein.”
Claims other papers make about this one
Each is checked against this paper’s own text: does it say what the citing paper says it does?
The cited source doesn’t support the claim as written.
In the citing paper
“The AD brain network proteome also features conserved upregulation of oligodendrocyte-enriched modules associated with myelination (Fig. 1).”
From Systems-based proteomics to resolve the biology of Alzheimer’s disease beyond amyloid and tau (2021) · cites this paper as [74]
Checked by a reasoning model — may be wrong.
Experimental — accuracy not yet measuredThe source backs part of the claim, not all of it — or backs it for a different population, condition or comparison.
In the citing paper
“Modules enriched with RNA binding and splicing proteins are also consistently upregulated in the AD network proteome (Fig. 1).”
From Systems-based proteomics to resolve the biology of Alzheimer’s disease beyond amyloid and tau (2021) · cites this paper as [74]
Experimental — accuracy not yet measuredThe check wasn’t confident either way, so it gives no verdict — never disputed.
In the citing paper
“suggesting it maintains a causal role in disease pathogenesis [62, 64, 74, 96].”
From Systems-based proteomics to resolve the biology of Alzheimer’s disease beyond amyloid and tau (2021) · cites this paper as [74]
Experimental — accuracy not yet measuredIn the citing paper
“Nearly a dozen informative network-based analyses of the AD proteome have been performed in the human brain [62–64, 74, 78, 96, 104–108], including the dorsolateral prefrontal cortex (DLPFC), temporal cortex, and other cortical regions heavily affected in AD.”
From Systems-based proteomics to resolve the biology of Alzheimer’s disease beyond amyloid and tau (2021) · cites this paper as [74]
In the citing paper
“Johnson et al. demonstrated this advantage in one of the first TMT-MS network proteomes of the AD brain [74], which quantified 6533 proteins across 47 brain tissues compared to just 2736 proteins quantified by LFQ-MS when applied to the same samples.”
From Systems-based proteomics to resolve the biology of Alzheimer’s disease beyond amyloid and tau (2021) · cites this paper as [74]
In the citing paper
“this study and others have noted that the MSN module is enriched with AD genetic risk factors”
From Systems-based proteomics to resolve the biology of Alzheimer’s disease beyond amyloid and tau (2021) · cites this paper as [74]
In the citing paper
“Johnson et al. identified several AD-associated RNA-binding/splicing modules notably increased in asymptomatic and symptomatic AD.”
From Systems-based proteomics to resolve the biology of Alzheimer’s disease beyond amyloid and tau (2021) · cites this paper as [74]
In the citing paper
“The authors subsequently concluded that RNA-binding proteins may drive the proteopathic “biochemical” phase of AD.”
From Systems-based proteomics to resolve the biology of Alzheimer’s disease beyond amyloid and tau (2021) · cites this paper as [74]
In the citing paper
“proteomic network analyses of the AD brain have demonstrated modest upregulation of a highly conserved oligodendrocyte-enriched myelination module in both asymptomatic and symptomatic disease [62–64, 74, 96].”
From Systems-based proteomics to resolve the biology of Alzheimer’s disease beyond amyloid and tau (2021) · cites this paper as [74]
In the citing paper
“The disease-associated alterations in these protein modules were independent of cell type, persisting even after the dataset was regressed for cell type-specific effects [74].”
From Systems-based proteomics to resolve the biology of Alzheimer’s disease beyond amyloid and tau (2021) · cites this paper as [74]
Citations
Cites
WGCNA: an R package for weighted correlation network analysis
Langfelder, P., & Horvath, S. (2008) · BMC Bioinformatics · doi:10.1186/1471-2105-9-559 · Cited by 27,252 · cited 1×
“The covariate-unregressed, normalized abundance matrix described above was collapsed to average protein abundance measurements for unique gene symbols (n = 5,839) using WGCNA::collapseRows() function [16].”
MethodSperling, R. A., Aisen, P. S., Beckett, L. A., Bennett, D. A., Craft, S., Fagan, A. M., Iwatsubo, T., Jack, C. R., Kaye, J., Montine, T. J., et al. (2011) · Alzheimer's & Dementia · doi:10.1016/j.jalz.2011.03.003 · Cited by 7,155 · cited 1×
“This asymptomatic phase of AD (AsymAD) is currently considered a preclinical stage of the disease [27, 28].”
BackgroundHypothetical model of dynamic biomarkers of the Alzheimer's pathological cascade
Jack, C. R., Knopman, D. S., Jagust, W. J., Shaw, L. M., Aisen, P. S., Weiner, M. W., Petersen, R. C., & Trojanowski, J. Q. (2010) · The Lancet Neurology · doi:10.1016/s1474-4422(09)70299-6 · Cited by 4,806
Meta-Analysis of 74,046 Individuals Identifies 11 New Susceptibility Loci for Alzheimer’s Disease
(EADI), E. A. D. I., Lambert, J.-C., (GERAD), G. A. E. R. I. A. D., Alzheimer's Disease Genetic Consortium (ADGC), (CHARGE), C. F. H. A. A. R. I. G. E., Ibrahim-Verbaas, C. A., Harold, D., Naj, A. C., Sims, R., Bellenguez, C., et al. (2013) · Nature Genetics · doi:10.1038/ng.2802 · Cited by 4,336
Mapping identifiers for the integration of genomic datasets with the R/Bioconductor package biomaRt
Durinck, S., Spellman, P. T., Birney, E., & Huber, W. K. (2009) · Nature Protocols · doi:10.1038/nprot.2009.97 · Cited by 4,226
MAGMA: Generalized Gene-Set Analysis of GWAS Data
de Leeuw, C. A., Mooij, J. M., Heskes, T., & Posthuma, D. (2015) · PLOS Computational Biology · doi:10.1371/journal.pcbi.1004219 · Cited by 3,653 · cited 3×
“We assessed whether the proteins encoded within these AD risk loci preferentially cluster within any of the modules in the TMT network [5, 22].”
BackgroundMethodInfluentialSemi-supervised learning for peptide identification from shotgun proteomics datasets
Käll, L., Canterbury, J. D., Weston, J., Noble, W. S., & MacCoss, M. J. (2007) · Nature Methods · doi:10.1038/nmeth1113 · Cited by 2,424
Enrichment Map: A Network-Based Method for Gene-Set Enrichment Visualization and Interpretation
Merico, D., Isserlin, R., Stueker, O., Emili, A., & Bader, G. D. (2010) · PLoS ONE · doi:10.1371/journal.pone.0013984 · Cited by 2,235
Synapse Loss and Microglial Activation Precede Tangles in a P301S Tauopathy Mouse Model
Yoshiyama, Y., Higuchi, M., Zhang, B., Huang, S.-M., Iwata, N., Saido, T. C., Maeda, J., Suhara, T., Trojanowski, J. Q., & Lee, V. M.-Y. (2007) · Neuron · doi:10.1016/j.neuron.2007.01.010 · Cited by 2,208
Nelson, P. T., Alafuzoff, I., Bigio, E. H., Bouras, C., Braak, H., Cairns, N. J., Castellani, R. J., Crain, B. J., Davies, P., Tredici, K. D., et al. (2012) · Journal of Neuropathology & Experimental Neurology · doi:10.1097/nen.0b013e31825018f7 · Cited by 2,050
Self-citation
Research works printed but not linked: 1
- Prince M, Wimo A, Guerchet M, Ali G, Wu Y, Prina M. World Alzheimer report 2015: the global impact of dementia. In book world Alzheimer report 2015: the global impact of dementia (editor ed.^eds.). City: Alzheimer's Disease International; 2015.
Cited by
Sorted by citations
Items 101–200 of 232
Tau, RNA, and RNA-Binding Proteins: Complex Interactions in Health and Neurodegenerative Diseases
Lester, E., & Parker, R. (2023) · The Neuroscientist · doi:10.1177/10738584231154551 · Cited by 16
Localized proteomic differences in the choroid plexus of Alzheimer's disease and epilepsy patients
Leitner, D., Kanshin, E., Faustin, A., Thierry, M., Friedman, D. J., Devore, S., Ueberheide, B. M., Devinsky, O., & Wısnıewskı, T. (2023) · Frontiers in Neurology · doi:10.3389/fneur.2023.1221775 · Cited by 17
Weiner, S., Blennow, K., Zetterberg, H., & Gobom, J. (2023) · Expert Review of Proteomics · doi:10.1080/14789450.2023.2255752 · Cited by 15
Proteomic differences in hippocampus and cortex of sudden unexplained death in childhood
Leitner, D., William, C. M., Faustin, A., Askenazi, M., Kanshin, E., Snuderl, M., McGuone, D., Wısnıewskı, T., Ueberheide, B. M., Gould, L., et al. (2022) · Acta Neuropathologica · doi:10.1007/s00401-022-02414-7 · Cited by 14
“Group sizes were determined based on the number of cases with significant findings as previously reported [33, 50, 65], including our previous study in epilepsy cases with similar methods [60].”
MethodMontoliu‐Gaya, L., Bian, S., Dammer, E. B., Alcolea, D. A., Sauer, M., Martá-Ariza, M., Ashton, N. J., Belbin, O., Fuchs, J., Watson, C. M., et al. (2025) · Nature Communications · doi:10.1038/s41467-025-61054-z · Cited by 18
“Proteomic analysis of LOAD brain tissue and cerebrospinal fl uid (CSF) over the past decade has illustrated the complex molecular pathology related to A β plaques, tau neuro fi brillary tangles (NFTs), and cognitive decline in LOAD 14 – 20 , the most commonform of AD.”
Self-citationBroad Kinase Inhibition Mitigates Early Neuronal Dysfunction in Tauopathy
Koren, S. A., Hamm, M. J., Cloyd, R., Fontaine, S. N., Chishti, E. A., Lanzillotta, C., Rodriguez-Rivera, J., Ingram, A., Bell, M. C., Escobar, S. M. G., et al. (2021) · International Journal of Molecular Sciences · doi:10.3390/ijms22031186 · Cited by 13
Self-citationKumar, A., Doan, V. M., Kunkli, B., & Csősz, É. (2021) · Frontiers in Genetics · doi:10.3389/fgene.2021.633050 · Cited by 12
“The modifications related to RNA metabolism were demonstrated in AD as RNA-binding proteins, and RNA splicing was shown to be important in the worsening of the symptoms of AD (Johnson et al., 2018).”
BackgroundmRNA isoform balance in neuronal development and disease
LaForce, G. R., Philippidou, P., & Schaffer, A. E. (2022) · Wiley Interdisciplinary Reviews - RNA · doi:10.1002/wrna.1762 · Cited by 15
“…EWSR1, and CLP1, have been associated with splicing and 30 end processing defects within a subset of genes in AD neurons, and correlate with disease pathology and cognitive impairment, respectively (Barbash et al., 2017; E. C. B. Johnson et al., 2018; Marques-Coelho et al., 2021; Raj et al., 2018).”
Backgroundİş, Ö., Min, Y., Wang, X., Oatman, S. R., Daniel, A. A., & Ertekin‐Taner, N. (2024) · Glia · doi:10.1002/glia.24652 · Cited by 13
Using Proteomics to Understand Alzheimer’s Disease Pathogenesis
Drummond, E., & Wısnıewskı, T. (2019) · Codon Publications eBooks · doi:10.15586/alzheimersdisease.2019.ch3 · Cited by 13
“The most comprehensive studies have been conducted by researchers at Emory University, USA (17, 30, 31).”
BackgroundPandey, R. S., Kotredes, K. P., Sasner, M., Howell, G. R., & Carter, G. W. (2023) · BMC Genomics · doi:10.1186/s12864-023-09280-x · Cited by 11
“events by predicting alternative exon-exon junction splicing events across symptomatic AD (n = 20), asymptomatic AD (n = 14), and control (n = 13) cases [1].”
BackgroundMethodResultInfluentialDEAD-Box Helicase 17 Promotes Amyloidogenesis by Regulating BACE1 Translation
Liu, Y., Zhou, G., Li, S., Wen, Q., Xie, S., Chen, L., Wang, L., Xie, X., Chen, X., Pu, Y., et al. (2023) · Brain Sciences · doi:10.3390/brainsci13050745 · Cited by 12
“In recent years, accumulating evidences have suggested that alterations in RNA processing and RBPs are involved in AD [56].”
Fujita, K., Ishizuka, T., Mitsukawa, M., Kurata, M., & Masuda, S. (2020) · International Journal of Molecular Sciences · doi:10.3390/ijms21062026 · Cited by 13
“In the brains of patients with AD, increased aggregation of insoluble U1 snRNP was identified by proteomic analysis [137].”
BackgroundProteomic Insight Into Alzheimer's Disease Pathogenesis Pathways
Ryu, T., Kim, K., Asiimwe, N., & Na, C. H. (2025) · PROTEOMICS · doi:10.1002/pmic.202400298 · Cited by 12
Ishunina, T. A. (2021) · Handbook of clinical neurology · doi:10.1016/b978-0-12-819973-2.00012-5 · Cited by 11
Variant biomarker discovery using mass spectrometry-based proteogenomics
Reilly, L., Seddighi, S., Singleton, A., Cookson, M., Ward, M. E., & Qi, Y. A. (2023) · Frontiers in Aging · doi:10.3389/fragi.2023.1191993 · Cited by 13
“From these modules, the investigators then identified a number of differentially expressed, novel alternative splice variant proteins (Johnson et al., 2018).”
BackgroundGuo, Q. J., Ping, L., Dammer, E. B., Duong, D. M., Yin, L., Xu, K., Shantaraman, A., Fox, E. J., Johnson, E. C. B., Roberts, B. R., et al. (2023) · bioRxiv (Cold Spring Harbor Laboratory) · doi:10.1101/2023.11.06.565824 · Cited by 11
Self-citationSong, L., Pan, Q., Zhou, G., Liu, S., Zhu, B., Lin, P., Hu, X., Zha, J., Long, Y., Luo, B., et al. (2024) · Advanced Science · doi:10.1002/advs.202305260 · Cited by 10
Walker, C. K., Greathouse, K. M., Tuscher, J. J., Dammer, E. B., Weber, A. J., Liu, E., Curtis, K. A., Boros, B. D., Freeman, C. D., Seo, J. V., et al. (2023) · Journal of Neuroscience · doi:10.1523/jneurosci.2102-22.2023 · Cited by 12
“However, studies with a similar pergroup sample size were able to capture disease-associated changes that were also detected by proteomic studies with larger sample sizes (Seyfried et al., 2017; Johnson et al., 2018; Zhang et al., 2018; Carlyle et al., 2021).”
Self-citationTargeting the post-synaptic proteome has therapeutic potential for psychosis in Alzheimer Disease
Krivinko, J. M., DeChellis-Marks, M. R., Zeng, L., Fan, P., López, O. L., Ding, Y., Wang, L., Kofler, J., MacDonald, M. L., & Sweet, R. A. (2023) · Communications Biology · doi:10.1038/s42003-023-04961-5 · Cited by 10
Proteomic Analysis of Hypoxia-Induced Senescence of Human Bone Marrow Mesenchymal Stem Cells
Mai, L., He, G., Chen, J., Zhu, J.-N., Chen, S., Hou, X., Yang, H., Zhang, M., Wu, Y., Lin, Q., et al. (2021) · Stem Cells International · doi:10.1155/2021/5555590 · Cited by 10
“The instrument was run with the peptide recognition mode enabled [33].”
MethodNelson, R. S., Dammer, E. B., Santiago, J. V., Seyfried, N. T., & Rangaraju, S. (2022) · Frontiers in Neuroscience · doi:10.3389/fnins.2022.902146 · Cited by 10
“, discerned that RBPs were a class of proteins which were differentially expressed in asymptomatic AD (persons with presumed preclinical disease, or a high pathologic load still below the threshold that generates cognitive impairment), and symptomatic AD (Johnson et al., 2018).”
BackgroundSelf-citationNery, T. G. M., da Silva, E. M. G., Tavares, R., & Passetti, F. (2018) · Journal of Molecular Neuroscience · doi:10.1007/s12031-018-1220-1 · Cited by 10
Acharya, V., Fan, K.-H., Snitz, B. E., Ganguli, M., DeKosky, S. T., López, O. L., Feingold, E., & Kamboh, M. I. (2023) · Alzheimer s & Dementia · doi:10.1002/alz.13064 · Cited by 13
Unveiling the Molecular Footprint: Proteome-Based Biomarkers for Alzheimer’s Disease
Jain, M., Dhariwal, R., Patil, N., Ojha, S., Tendulkar, R., Tendulkar, M., Dhanda, P. S., Yadav, A., & Kaushik, P. (2023) · Proteomes · doi:10.3390/proteomes11040033 · Cited by 11
“This significantly lowers the extreme biochemical diversification and enhances proteomic coverage to as much as 10,000 proteins [154].”
BackgroundTopological Dissection of Proteomic Changes Linked to the Limbic Stage of Alzheimer’s Disease
Velásquez, E., Szeitz, B., Gil, J., Murillo, J. R., Palkovits, M., Renner, É., Hortobágyi, T., Döme, P., Nogueira, F. C. S., Marko‐Varga, G., et al. (2021) · Frontiers in Immunology · doi:10.3389/fimmu.2021.750665 · Cited by 8
“In conjunction with these changes, we also observed the alteration of proteins linked to mRNA processing, mTOR and Wnt signaling, cytoskeleton regulation, metabolism, and synaptic functions, as previously reported by similar studies (14, 15, 18).”
ResultMikolaskova, B., Jurcik, M., Čipáková, I., et al. (2021) · International Journal of Molecular Sciences · doi:10.3390/ijms22137011 · Cited by 8
Li, C., Zhou, G., Xie, X., Wang, L., Chen, X., Pan, Q., Pu, Y., Yang, J., Li, S., & Chen, G. (2024) · Experimental Neurology · doi:10.1016/j.expneurol.2024.114805 · Cited by 9
Faura, J., Heeman, B., Pottier, C. P., Baker, M., DeJesus‐Hernandez, M., Küçükali, F., Heiß, L., Wynants, S., den Broeck, M. V., Rijk, P. D., et al. (2025) · Acta Neuropathologica · doi:10.1007/s00401-025-02901-7 · Cited by 9
“Deep proteomics analyses in AD brains revealed an enrichment for RNA-binding proteins (RBPs) in hubs of differentially abundant proteins [30] that do not seem to be cell-type specific, as revealed in multiple single-nuclei RNAseq datasets [62].”
Shapley, S. M., Shantaraman, A., Gadhavi, J. D., Kearney, M. A., Dammer, E. B., Duong, D. M., Bowen, C. A., Watson, C. M., Bagchi, P., Guo, Q., et al. (2025) · Molecular & Cellular Proteomics · doi:10.1016/j.mcpro.2025.101458 · Cited by 9
Self-citationZhang, Z., Dong, L., Tao, H., Dong, Y., Xiang, W., Tao, F., & Zhao, Y. (2024) · BMC Genomics · doi:10.1186/s12864-024-10181-w · Cited by 7
Jang, S., Choi, B., Lim, C., Kim, M., Lee, J., Lee, H., Baek, E., & Cho, K. S. (2024) · PLoS Genetics · doi:10.1371/journal.pgen.1011475 · Cited by 8
Wang, M., Jiang, F., Wei, K., et al. (2021) · Technology in Cancer Research & Treatment · doi:10.1177/15330338211004936 · Cited by 7
“Provided that RBPs serve multiple essential functions in post-transcriptional activities, it is shocking that variations in RBPs are strongly associated with the production and growth of numerous human diseases.(11,12) Nevertheless, RBPs remain largely unexplored throughout the origin and development of cancer.”
BackgroundMitochondrial Respiratory Chain Protein Co-Regulation in the Human Brain
Trumpff, C., Owusu-Ansah, E., Klein, H., Lee, A., Petyuk, V., Wingo, T. S., Wingo, A. P., Thambisetty, M., Ferrucci, L., Seyfried, N. T., et al. (2021) · Heliyon · doi:10.1016/j.heliyon.2022.e09353 · Cited by 7
“The samples (N1⁄4 400) and the pooled global internal standards (GIS) (N 1⁄4 100) were labelled using the TMT 10-plex kit (ThermoFisher 90406) as previously described in (Johnson et al., 2018; Ping et al., 2018).”
MethodSelf-citationCXCL10/IgG1 Axis in Multiple Sclerosis as a Potential Predictive Biomarker of Disease Activity
Welsh, N. C., DiSano, K. D., Linzey, M. R., Pike, S. C., Smith, A. D., Pachner, A. R., & Gilli, F. (2024) · Neurology Neuroimmunology & Neuroinflammation · doi:10.1212/nxi.0000000000200200 · Cited by 6
Anastacio, H. T. D., Matosin, N., & Ooi, L. (2024) · Life · doi:10.3390/life14050625 · Cited by 6
“Lower expression of GluA1 has been reported in the frontal cortex [80–82] and cerebellum [83] of AD brains, while no differences were observed in the temporal cortex compared to healthy individuals [69], suggesting there is a brain region-specific phenotype.”
BackgroundBoileau, E., Doroudgar, S., Riechert, E., Jürgensen, L., Ho, T. C., Katus, H. A., Völkers, M., & Dieterich, C. (2020) · Frontiers in Genetics · doi:10.3389/fgene.2020.583124 · Cited by 5
“Eigengenes have been largely regarded as robust biomarkers (Oldham et al., 2008; Johnson et al., 2018; Zhang et al., 2018; Di et al., 2019).”
BackgroundAlzheimer’s disease protein relevance analysis using human and mouse model proteomics data
Shi, C., Gottschalk, W. K., Colton, C. A., Mukherjee, S., & Lutz, M. W. (2023) · Frontiers in Systems Biology · doi:10.3389/fsysb.2023.1085577 · Cited by 6
Abiose, O., Rutledge, J., Losada, P. M., Belloy, M. E., Wilson, E. N., He, Z., Trelle, A. N., Channappa, D., Romero, A., Park, J., et al. (2023) · Alzheimer s & Dementia · doi:10.1002/alz.13576 · Cited by 6
Watson, C. M., Dammer, E. B., Ping, L., et al. (2022) · medRxiv · doi:10.1101/2022.08.30.22279370 · Cited by 6
“For biomarker measurements, CSF samples from all individuals were assayed for Aβ(1-42), total Tau, and pTau using the Roche Diagnostics Elecsys® immunoassay platform 20(22).”
BackgroundMethodInfluentialSelf-citationTrautwig, A. N., Shantaraman, A., Chung, M., Dammer, E. B., Ping, L., Duong, D. M., Petrucelli, L., Ward, M. E., Glass, J. D., Nelson, P. T., et al. (2025) · bioRxiv (Cold Spring Harbor Laboratory) · doi:10.1101/2025.05.30.656396 · Cited by 6
Self-citationProteome Network Analysis Identifies Potential Biomarkers for Brain Aging
Short, M. I., Fohner, A. E., Skjellegrind, H. K., Beiser, A., Gonzales, M. M., Satizábal, C. L., Austin, T. R., Longstreth, W. T., Bis, J. C., López, O. L., et al. (2023) · Journal of Alzheimer s Disease · doi:10.3233/jad-230145 · Cited by 6
“…analyses of the brain proteome have iden-tified modules of proteins or “hub” proteins that are cross-sectionally associated with AD disease status [14–17], some of which are involved in astrocytic and microglial anti-inflammatory processes [18], as well as RNA splicing and protein binding [19].”
Proteomics for Target Identification in Psychiatric and Neurodegenerative Disorders
Antunes, A. S. L. M., de Almeida, V., Crunfli, F., Carregari, V. C., & Martins‐de‐Souza, D. (2021) · Advances in experimental medicine and biology · doi:10.1007/978-3-030-55035-6_17 · Cited by 5
Lumpkin, C. J., Patel, H., Potts, G. K., Chaurasia, S., Gibilisco, L., Srivastava, G. P., Lee, J. Y., Brown, N. J., Amarante, P., Williams, J. D., et al. (2024) · Molecular Brain · doi:10.1186/s13041-024-01099-1 · Cited by 5
“RBPs were enriched in modules that correlated with AD pathology while aberrant interaction of mutant huntingtin oligomers with RBPs has also been reported [48–50].”
BackgroundProteomic networks of gray and white matter reveal tissue‐specific changes in human tauopathy
Johnson, A. G., Dammer, E. B., Webster, J. A., Duong, D. M., Seyfried, N. T., & Hales, C. M. (2024) · Annals of Clinical and Translational Neurology · doi:10.1002/acn3.52134 · Cited by 5
“The ratio network approach revealed six mitochondria-associated modules which demonstrated elevated WM: GM ratios in one or more disease groups relative to con-trol: modules (M) 21, 16, 9, 13, 14, and 30 (File S6).”
Self-citationPrecision health in Alzheimer disease: Risk assessment‐based strategies
Azar, J., Salama, M., Chidambaram, S. B., Al‐Balushi, B., Essa, M. M., & Qoronfleh, M. W. (2021) · Precision Medical Sciences · doi:10.1002/prm2.12036 · Cited by 7
Yao, Y., Liu, K., Wu, Y., Zhou, J., Jin, H., Zhang, Y., & Zhu, Y. (2022) · Frontiers in Molecular Biosciences · doi:10.3389/fmolb.2022.962412 · Cited by 6
“Central nervous system RNA-binding protein mutations can lead to the aggregation of abnormal proteins that contribute to the progression of various neurodegenerative diseases (Johnson et al., 2018; Duan et al., 2019).”
BackgroundProteomic cellular signatures of kinase inhibitor-induced cardiotoxicity
Xiong, Y., Liu, T., Chen, T., Hansen, J., Hu, B., Chen, Y., Jayaraman, G., Schürer, S. C., Vidović, D., Goldfarb, J., et al. (2022) · Scientific Data · doi:10.1038/s41597-021-01114-3 · Cited by 6
Compilation of all known protein changes in the human Alzheimer’s disease brainPreprint
Askenazi, M., Kavanagh, T., Pires, G., Ueberheide, B. M., Wısnıewskı, T., & Drummond, E. (2023) · bioRxiv (Cold Spring Harbor Laboratory) · doi:10.1101/2023.04.13.536828 · Cited by 4
fSuSiE enables fine-mapping of QTLs from genome-scale molecular profilesPreprint
Denault, W. R. P., Sun, H. H., Carbonetto, P. S., Liu, A., Jager, P. L. D., Bennett, D., Wang, G., & Stephens, M. (2025) · bioRxiv (Cold Spring Harbor Laboratory) · doi:10.1101/2025.08.17.670732 · Cited by 8
Pareja-Navarro, K. A., King, C. D., Kauwe, G., Ngwala, Y. Y., Lokitiyakul, D., Wong, I., Vira, A., Liu, Y., Chen, J. H., Sharma, M., et al. (2026) · Molecular Neurodegeneration · doi:10.1186/s13024-026-00928-2 · Cited by 6
Mapping the human brain proteome: opportunities, challenges, and clinical potential
Cartas‐Cejudo, P., Cortés, A., Lachén‐Montes, M., Anaya‐Cubero, E., Peral, E., Ausín, K., Díaz, R., Fernández‐Irigoyen, J., & Santamaría, E. (2024) · Expert Review of Proteomics · doi:10.1080/14789450.2024.2313073 · Cited by 4
The Impact of Apolipoprotein E Allelic Variants on Alzheimer’s Disease
Serrano, E., Sanz, P. G., & Barrantes, F. J. (2021) · Springer eBooks · doi:10.1007/978-3-030-61721-9_29 · Cited by 4
Carlyle, B. C., Kandigian, S. E., Kreuzer, J., Das, S., Trombetta, B. A., Kuo, Y., Bennett, D. A., Schneider, J. A., Petyuk, V., Kitchen, R. R., et al. (2020) · bioRxiv (Cold Spring Harbor Laboratory) · doi:10.1101/2020.07.31.230680 · Cited by 4
“Immune and inflammation related terms were also enriched in all Dementia-AD contrasts, in agreement with previous whole tissue studies (Johnson et al., 2018a; Wingo et al., 2019; Zhang et al., 2018).”
BackgroundResultInfluentialHigginbotham, L. A., Carter, K., Dammer, E. B., Haque, R. U., Johnson, E. C. B., Duong, D. M., Yin, L., Jager, P. L. D., Bennett, D. A., Lah, J. J., et al. (2022) · bioRxiv (Cold Spring Harbor Laboratory) · doi:10.1101/2022.07.22.501017 · Cited by 4
Self-citationFlores, C. C., Lee, Y., Davis, C. J., Solverson, P. M., & Gerstner, J. R. (2025) · Biomolecules · doi:10.3390/biom15101432 · Cited by 3
“Recent proteomics studies show a strong link between AD severity and astrocyte-related metabolic proteins [74,75].”
MtDNA‐depleted neuronal cell transcriptomes reveal Alzheimer's disease‐related changes
Menta, B. W., Schueddig, E., Ranjan, A., Li, Y., Andrews, S. J., Wilkins, H., Pei, D., & Swerdlow, R. H. (2025) · Alzheimer s & Dementia · doi:10.1002/alz.70929 · Cited by 4
“66,67 Both ρ 0linesshoweddirectandprofoundchangestoRNAbiology.”
Pharmacologic inhibition of PCBP2 biomolecular condensates relieves Alzheimer’s disease
Wang, L., Xie, X., Pan, Q., Zhang, J., Zhou, G., Zhang, Q., Yan, X., Xiang, Y., Li, C., He, Y., et al. (2025) · Nature Communications · doi:10.1038/s41467-025-65547-9 · Cited by 5
“Although alteration of RBPs is the prominent feature and independent risk factor of AD 32,33 , only a fraction of RBPs is presented in cytoplasmic granules 8 .”
Programmable macromolecule-based RNA-targeting therapies to treat human neurological disorders
Morelli, K. H., Smargon, A. A., & Yeo, G. W.-M. (2023) · RNA · doi:10.1261/rna.079519.122 · Cited by 4
“These include Alzheimer’s disease (AD)—the most common manifestation of neurodegeneration—as well as Parkinson’s disease (PD), Huntington’s disease (HD), and amyotrophic lateral sclerosis (ALS) (Dawson and Dawson 2003; Vance et al. 2009; Barmada et al. 2010; Belzil et al. 2013; Nussbacher et al. 2015; Johnson et al. 2…”
BackgroundInfluentialZhou, H., Lin, W., Labra, S. R., Lipton, S. A., Elman, J. A., Schork, N. J., & Rangan, A. V. (2024) · IEEE Transactions on Computational Biology and Bioinformatics · doi:10.1109/tcbb.2024.3487434 · Cited by 3
Hurst, C., Pugh, D. A., Abreha, M. H., Duong, D., Dammer, E., Bennett, D. A., Herskowitz, J. H., & Seyfried, N. (2022) · bioRxiv · doi:10.1101/2022.06.15.496285 · Cited by 3
“Labeling was performed as described (18, 70-72).”
Self-citationUbiquitin-Proteasome System Dysregulation in Alzheimer’s Disease Impacts Protein AbundancePreprint
Collins, M. A., Friedrich, C., Elcheikhali, M., Stewart, P., Derks, J., Connors, T. R., Altig, K., Melloni, A. N., Petelski, A. A., Oakley, D. H., et al. (2025) · bioRxiv (Cold Spring Harbor Laboratory) · doi:10.1101/2025.05.29.656728 · Cited by 5
Trautwig, A. N., Shantaraman, A., Chung, M., Dammer, E. B., Ping, L., Duong, D. M., Watson, C. M., Petrucelli, L., Ward, M. E., Glass, J. D., et al. (2026) · Cell Reports · doi:10.1016/j.celrep.2026.117142 · Cited by 10
Self-citationMulti-ancestry studies in multi-omics of Alzheimer’s disease: Recent insights and future directions
Shir, D., Seifar, F., & Ertekin‐Taner, N. (2026) · Current Opinion in Neurobiology · doi:10.1016/j.conb.2026.103205 · Cited by 2
Kurihara, M., Mano, T., Eto, F., Yao, I., Sato, K., Ohtomo, G., Bannai, T., Shibata, S., Ishiura, H., Ikemura, M., et al. (2023) · Neurobiology of Disease · doi:10.1016/j.nbd.2023.105989 · Cited by 2
Hsieh, Y., Guo, C., Yalamanchili, H. K., et al. (2019) · SSRN Electronic Journal · doi:10.2139/ssrn.3334426 · Cited by 2
Self-citationCSF Proteomics and Machine Learning Reveal Distinct Stages Across the Alzheimer’s Disease ContinuumPreprint
Rathore, S., Dammer, E. B., Shantaraman, A., et al. (2025) · medRxiv · doi:10.1101/2025.11.05.25339138 · Cited by 2
Self-citationBoers-Escuder, C., Kater, M. S. J., van der Zwan, M., Gouwenberg, Y., Klaassen, R. V., Huffels, C. F. M., Pekny, M., Hol, E. M., Smit, A. B., & Verheijen, M. H. G. (2026) · bioRxiv (Cold Spring Harbor Laboratory) · doi:10.64898/2026.03.24.713865 · Cited by 2
Ryu, T., Kim, S., Thuraisamy, T., Shin, J., Jang, Y., Kam, T., & Na, C. H. (2025) · Advanced Science · doi:10.1002/advs.202409318 · Cited by 1
Brazhnikov, M., Kusainova, T. T., Kopeykina, A. S., & Tarasova, I. A. (2025) · Journal of Proteome Research · doi:10.1021/acs.jproteome.5c00426 · Cited by 1
PROTECT: Protein circadian time prediction using unsupervised learning
Ogholbake, A. A., & Cheng, Q. S. (2025) · iScience · doi:10.1016/j.isci.2025.113605 · Cited by 2
Hou, X., Zhang, W., Kang, K., Jin, Y., Ren, P., Wang, L., Li, Z., Li, Y., You, J., Zhang, B., et al. (2026) · Alzheimer s & Dementia · doi:10.1002/alz.71106 · Cited by 2
“41,42 Notably, previous research suggestedthatspecificcircularRNAswerecrucialinregulatingA β production, metabolism, autophagy, and neuroinflammatory pathways.”
Tau and amyloid-β imaging with proteomics and genomics
Chinnathambi, S., Baisya, U., & Ananthanarayana, V. (2026) · Advances in protein chemistry and structural biology · doi:10.1016/bs.apcsb.2026.02.009 · Cited by 1
Translating Alzheimer’s disease proteomics into drug discovery opportunities
Drummond, E., Werry, E. L., Kavanagh, T., Genoud, S., Cho, A., Chen, S., Du, J., Hibbs, D. E., & Kassiou, M. (2026) · Molecular Neurodegeneration Advances · doi:10.1186/s44477-026-00035-y · Cited by 2
Doolen, S., Ayoubi, R., Laflamme, C., Betarbet, R. S., Zoeller, E. L., Williams, S. G., Fu, H., Levey, A. I., & Rizzo, S. J. S. (2023) · F1000Research · doi:10.12688/f1000research.138354.1 · Cited by 2
“2020; Johnson et al .”
Self-citationSnyder, K. L., Dixon, C. E., Henchir, J. J., Gorse, K., Vagni, V., Janesko‐Feldman, K. L., Kochanek, P. M., & Jackson, T. C. (2024) · Experimental Neurology · doi:10.1016/j.expneurol.2024.114690 · Cited by 1
Rico, E. M. G., Joseph, P., Noutsos, C., & Poon, K. (2024) · Neuroscience · doi:10.1016/j.neuroscience.2024.07.007 · Cited by 1
Xiong, Y., Liu, T., Chen, T., Hansen, J., Hu, B., Chen, Y., Jayaraman, G., Schürer, S. C., Vidović, D., Goldfarb, J., et al. (2020) · bioRxiv (Cold Spring Harbor Laboratory) · doi:10.1101/2020.02.26.966606 · Cited by 1
Broad kinase inhibition mitigates early neuronal dysfunction and cognitive deficits in tauopathyPreprint
Koren, S. A., Hamm, M. J., Cloyd, R., Fontaine, S. N., Chishti, E. A., Lanzillotta, C., Rodriguez-Rivera, J., Ingram, A., Bell, M. C., Escobar, S. M. G., et al. (2020) · bioRxiv (Cold Spring Harbor Laboratory) · doi:10.1101/2020.07.31.229583 · Cited by 1
Self-citationGedik, H., Peterson, R. E., Chatzinakos, C., Dozmorov, M. G., Vladimirov, V. I., Riley, B. P., & Bacanu, S. (2024) · medRxiv · doi:10.1101/2024.04.14.24305811 · Cited by 1
“Brain pQTL data were obtained from a recent study (Wingo et al., 2022), for which subjects (n = 722) were assayed using mass spectrometry-based method (Johnson et al., 2018).”
Irmady, K., Scheckel, C., Singer, R. A., Carroll, T., & Darnell, R. B. (2024) · bioRxiv (Cold Spring Harbor Laboratory) · doi:10.1101/2024.11.18.622571 · Cited by 1
Adeola, H. A., & Robinson, R. A. S. (2025) · ACS Bio & Med Chem Au · doi:10.1021/acsbiomedchemau.5c00074 · Cited by 1
Cerebrospinal fluid proteomics for predictive assessment of Alzheimer’s Disease riskPreprint
Rathore, S., Dammer, E. B., Shantaraman, A., Wu, F., Duong, D. M., Fox, E. J., Johnson, E. C. B., Lah, J. J., Initiative, A. D. N., Seyfried, N. T., et al. (2025) · medRxiv · doi:10.1101/2025.10.24.25337921 · Cited by 1
“S1-S2 ), enabling deep proteome coverage with high precision 29,30 .”
Self-citationDammer, E. B., Afshar, S., Bian, S., Seyfried, N. T., Levey, A. I., Fortea, J., & Johnson, E. C. B. (2026) · medRxiv · doi:10.64898/2026.02.14.26346321 · Cited by 1
Self-citationLeitner, D., Mills, J. D., Pires, G., Faustin, A., Drummond, E., Kanshin, E., Nayak, S., Askenazi, M., Verducci, C., Chen, B. J., et al. (2020) · bioRxiv (Cold Spring Harbor Laboratory) · doi:10.1101/2020.07.27.223446
Jiang, L., Lin, W., Zhang, C., Verma, M., Kwan, J., van Vliet, E., Ash, P. E. A., Cruz, A. L., Boudeau, S., Maziuk, B. F., et al. (2020) · bioRxiv (Cold Spring Harbor Laboratory) · doi:10.1101/2020.12.03.409334
“The interaction of oTau with HNRNPA2B1 is consistent with accumulating proteomic studies of neurodegenerative diseases in which HNRNPs appear prominently, as well as a recent study showing increases in m6A in the brains of AD cases (Han et al., 2020; Johnson et al., 2020; Johnson et al., 2018; Umoh et al., 2018).”
BackgroundRahman, M. A., Hossain, S., Abdullah, N., & Aminudin, N. (2020) · doi:10.21203/rs.3.rs-104135/v1
Goshadrou, F., Yekta, R. F., Oskouie, A. A., & Eslami, M. (2021) · کومش · doi:10.29252/koomesh.23.1.105
Neuroproteomics: How a Multitude of Proteins Reflect Brain Functions
Гомазков, О. А. (2021) · Biology Bulletin Reviews · doi:10.1134/s2079086421020043 · Cited by 1
“In the cerebral cortex, proteins involved in the pathogenesis of general and asymptomatic forms of AD were identified (Johnson et al., 2018).”
BackgroundJiang, L., Lin, W., Zhang, C., Verma, M., Kwan, J., van Vliet, E., Ash, P. E. A., Cruz, A. L., Boudeau, S., Maziuk, B. F., et al. (2020) · SSRN Electronic Journal · doi:10.2139/ssrn.3751054
21116 基礎浮き上がり構造物の地震応答に及ぼす入力地震動位相特性の影響(相互作用(4):モデル化と応答,構造II)
氏家, 大., 麻里, 哲., & 緑川, 光. (2011) · 学術講演梗概集. B-2, 構造II, 振動, 原子力プラント
UT's Project Quest Reaches Deep into Instruction and Research
Danielson, W. A. (1988) · T.H.E. Journal Technological Horizons in Education
Swerdlow, R. H. (2020) · Faculty Opinions – Post-Publication Peer Review of the Biomedical Literature · doi:10.3410/f.737734695.793575216
Yao, Y., Liu, K., Wu, Y., Zhou, J., Jin, H., Zhang, Y., & Zhu, Y. (2022) · Research Square · doi:10.21203/rs.3.rs-1484394/v1
VanDusen, K. W., Qi, W., Li, Y.-J., et al. (2020) · doi:10.21203/rs.3.rs-35959/v1
Rahman, M. A. (2021) · Neurology & Neurotherapy Open Access Journal · doi:10.23880/nnoaj-16000155
Bai, B., Vanderwall, D., Li, Y., Wang, X., Poudel, S., Wang, H., Dey, K. K., Chen, P., Yang, K., & Peng, J. (2021) · Figshare · doi:10.6084/m9.figshare.15162179
Unveiling RNA Dysfunction: A Key Player in Neurodegeneration
Pandey, P., Mukherjee, T., Modak, O., & Mutsuddi, M. (2024) · Springer eBooks · doi:10.1007/978-981-97-4288-2_10 · Cited by 1
CPNE7 Regulates Amyloidogenesis Through CAP1 ‐Dependent ADAM10 Translation
Yang, J., Pu, Y., Pan, Q., Wang, L., Li, C., Xie, X., Chen, X., Li, X., Bai, D., Zhu, B., et al. (2025) · Journal of Neurochemistry · doi:10.1111/jnc.70026
“Dysfunction of RNA-binding proteins (RBPs) is a prominent feature in neurodegenerative disorders such as AD (Gebauer et al. 2021; Johnson et al. 2018).”
Metadata
- Authors
- Johnson, E. C. B., Dammer, E. B., Duong, D. M., Yin, L., Thambisetty, M., Troncoso, J. C., Lah, J. J., Levey, A. I., & Seyfried, N. T.
- Affiliations
- Emory University (US)
- National Institutes of Health (US)
- Johns Hopkins University (US)
- Corresponding author
- Johnson, Erik C. B.
- Seyfried, Nicholas T.
- ORCID
- Venue
- Molecular Neurodegeneration
- Published
- 2018-10-04
- Volume
- 13
- Issue
- 1
- Pages
- 52-52
- ISSN
- 1750-1326 (ISSN-L)
- PMC
- PMC6172707
- OpenAlex
- W2895694428
- Cited by
- 225
- References
- 53
- Citations by year
- 2026: 17 · 2025: 23 · 2024: 37 · 2023: 29 · 2022: 22 · 2021: 45 · 2020: 36 · 2019: 11 · 2018: 3
- FWCI
- 16.50
- Type
- journal article
- Language
- en
- Open access
- gold
- doi.org
- Locations
- Molecular Neurodegeneration (publishedVersion, cc-by)
- Europe PMC (PubMed Central) (publishedVersion, other-oa)
- PubMed Central (publishedVersion, cc-by)
- PubMed (publishedVersion)
- DOAJ (DOAJ: Directory of Open Access Journals) (submittedVersion, cc-by-sa)
- Funders
- Accelerating Medicine Partnership AD (U01AG046161-02)
- National Institute on Aging (5R01AG053960, RF1AG057471, P50AG05146, P50AG025688, R21AG054206, RF1AG057470)
- National Institute of Neurological Disorders and Stroke (P30NS055077)
- Alzheimer's Association (11060)
- Alzheimer’s Research UK
- Michael J. Fox Foundation for Parkinson's Research
- Weston Brain Institute
- BrightFocus Foundation (A2015332S)
- NIA Division of Intramural Research
- Topics
- Life Sciences › Neuroscience › Cellular and Molecular Neuroscience › Alzheimer's disease research and treatments
- Physical Sciences › Chemistry › Spectroscopy › Advanced Proteomics Techniques and Applications
- Health Sciences › Medicine › Psychiatry and Mental health › Dementia and Cognitive Impairment Research
- Keywords
- Alzheimer's disease, brain proteome, RNA-binding proteins, RNA splicing, alternative splicing, protein isoforms, asymptomatic Alzheimer's disease, proteogenomics, BIN1, PICALM, Pyk2, FERMT2, differential protein abundance, cognitive decline
- MeSH terms
- Alzheimer Disease, Brain, Cognition, Humans, RNA Splicing, RNA-Binding Proteins, Alternative Splicing, Proteomics, Tandem Mass Spectrometry, Cognitive Dysfunction
About these checks
Registry, retraction, Cites and statistics results are computed, not judged, with one exception: a printed reference that no index lists is read once by a model before it counts as a citation error. Claims are extracted by a model and kept only when their quote appears verbatim in the text; each cited source is then checked, with a model’s help, for whether it says what the claim relies on. Those verdicts can be wrong — read the claim’s quote and the cited source before relying on one.
A language model drew the claims from the paper on 2026-10-10, under version 3 of the claim definition (model deepseek-v4.1-flash, prompt extract-v3).
A second model labelled each claim on 2026-10-10 (model jev-1.13-20260917, definition revision gold-guideline-v0.2).
Statistics and arithmetic are recomputed, not judged.
Confidence bands are shown only for fields calibrated on our annotated test set. None is calibrated yet, so no band is shown.
What counts as a claim ›How we measure confidence ›How we check this ›
Are you an author, or do you see a problem with this page? Request a review
