

The DOI matches its Crossref record; 52 of the 53 references it cites were found in a registry or an index.
Plaque-associated human microglia accumulate lipid droplets in a chimeric model of Alzheimer’s disease
Open accessAbstract
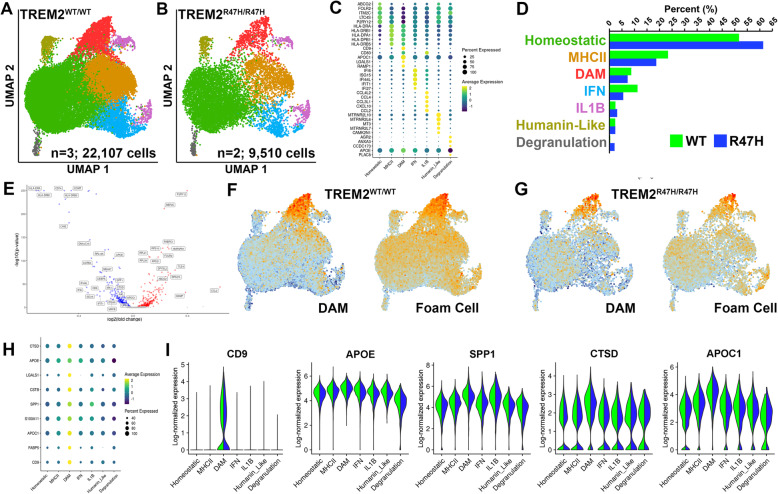
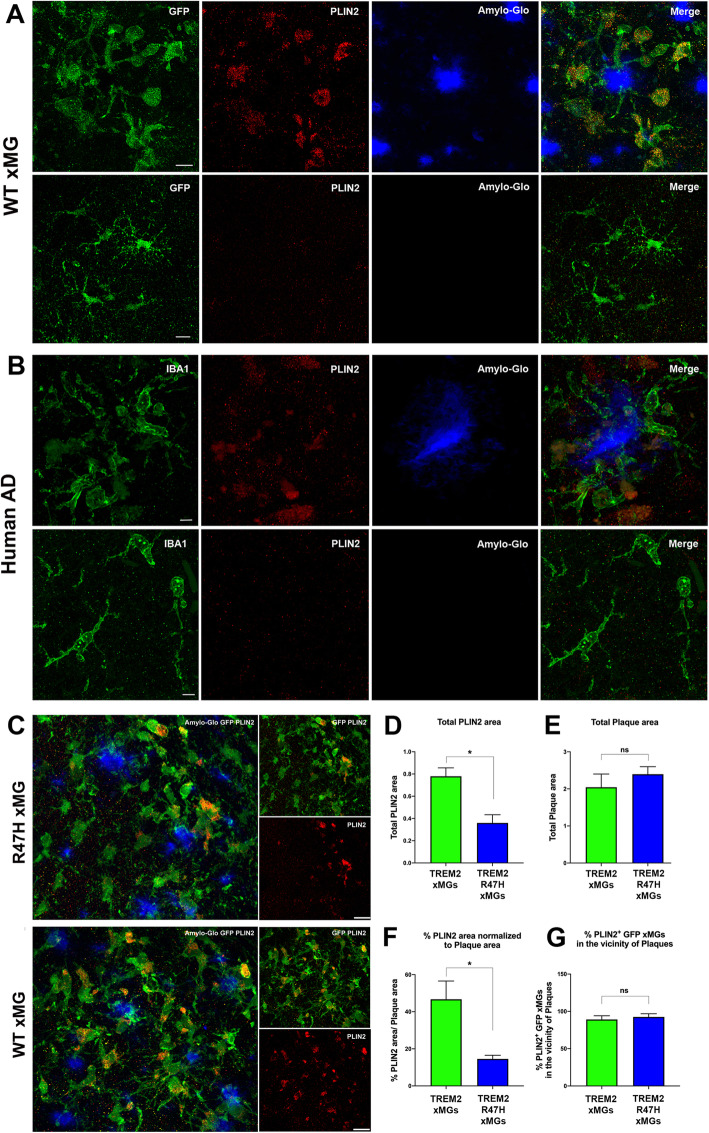
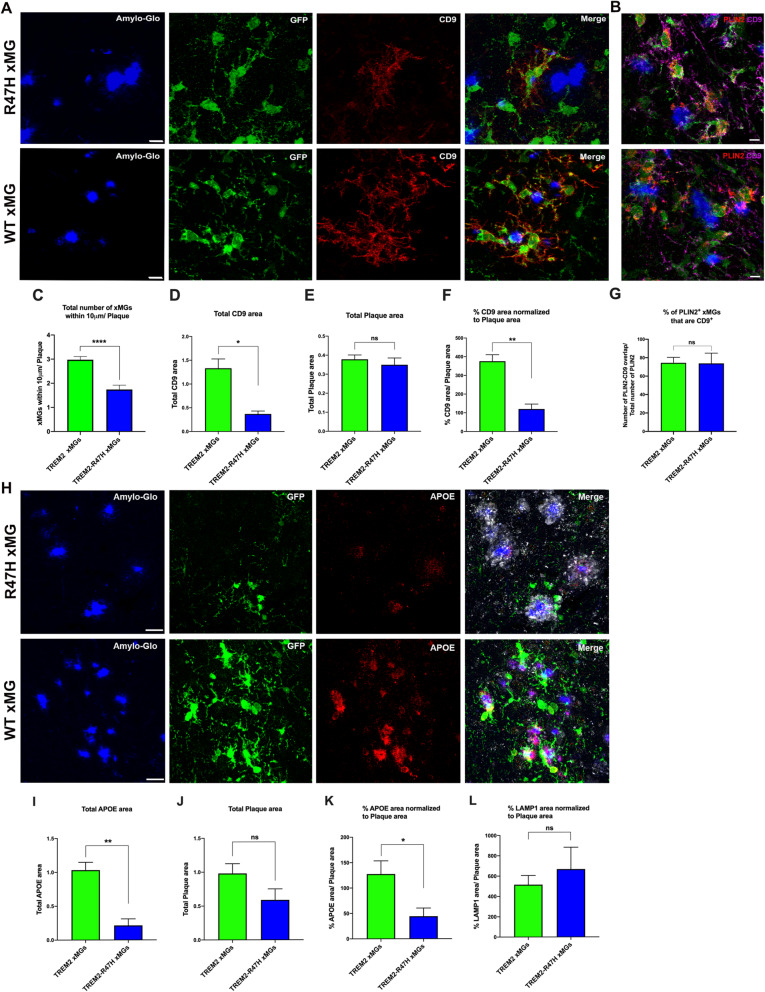
Background: Disease-associated microglia (DAMs), that surround beta-amyloid plaques, represent a transcriptionally-distinct microglial profile in Alzheimer’s disease (AD). Activation of DAMs is dependent on triggering receptor expressed on myeloid cells 2 (TREM2) in mouse models and the AD TREM2-R47H risk variant reduces microglial activation and plaque association in human carriers. Interestingly, TREM2 has also been identified as a microglial lipid-sensor, and recent data indicates lipid droplet accumulation in aged microglia, that is in turn associated with a dysfunctional proinflammatory phenotype. However, whether lipid droplets (LDs) are present in human microglia in AD and how the R47H mutation affects this remains unknown. Methods: To determine the impact of the TREM2 R47H mutation on human microglial function in vivo, we transplanted wild-type and isogenic TREM2-R47H iPSC-derived microglial progenitors into our recently developed chimeric Alzheimer mouse model. At 7 months of age scRNA-seq and histological analyses were performed. Results: Here we report that the transcriptome of human wild-type TREM2 and isogenic TREM2-R47H DAM xenografted microglia (xMGs), isolated from chimeric AD mice, closely resembles that of human atherosclerotic foam cells. In addition, much like foam cells, plaque-bound xMGs are highly enriched in lipid droplets. Somewhat surprisingly and in contrast to a recent in vitro study, TREM2-R47H mutant xMGs exhibit an overall reduction in the accumulation of lipid droplets in vivo. Notably, TREM2-R47H xMGs also show overall reduced reactivity to plaques, including diminished plaque-proximity, reduced CD9 expression, and lower secretion of plaque-associated APOE. Conclusions: Altogether, these results indicate lipid droplet accumulation occurs in human DAM xMGs in AD, but is reduced in TREM2-R47H DAM xMGs, as it occurs secondary to TREM2-mediated changes in plaque proximity and reactivity.
Overview
The claims and statistics of this paper haven’t been checked yet.
Run the check — free, no account needed. It reads the open-access text and checks the sources it cites.
Integrity signals
Registry
Cites
Statistics
Figures
Verification
Claims the paper makes
The claims and statistics of this paper haven’t been checked yet.
Run the check — free, no account needed. It reads the open-access text and checks the sources it cites.
Claims other papers make about this one
Each is checked against this paper’s own text: does it say what the citing paper says it does?
The cited source doesn’t support the claim as written.
In the citing paper
“Mutations affecting the TREM2 function impair microglial activation (37) and reduce their ability to accumulate LDs in the AD brain (38).”
From Reducing microglial lipid load enhances β amyloid phagocytosis in an Alzheimer’s disease mouse model (2025) · cites this paper as [38]
Checked by a reasoning model — may be wrong.
Experimental — accuracy not yet measuredThe cited source says what the claim attributes to it.
In the citing paper
“LDAM were also observed in chimaeric human–mouse AD models6.”
From APOE4/4 is linked to damaging lipid droplets in Alzheimer’s disease microglia (2024) · cites this paper as [6]
The cited source says what the claim attributes to it.
In the citing paper
“human iPSC-derived microglia were enriched in LDs in a chimeric mouse model of AD37”
From Amyloid-β induces lipid droplet-mediated microglial dysfunction via the enzyme DGAT2 in Alzheimer’s disease (2025) · cites this paper as [37]
Self-check
Percentages, sums and reported differences re-computed from the paper’s own numbers.
The self-check needs the paper’s full text.
Citations
Cites
Integrating single-cell transcriptomic data across different conditions, technologies, and species
Butler, A., Hoffman, P., Smibert, P., Papalexi, E., & Satija, R. (2018) · Nature Biotechnology · doi:10.1038/nbt.4096 · Cited by 13,174
A Unique Microglia Type Associated with Restricting Development of Alzheimer’s Disease
Keren-Shaul, H., Spinrad, A., Weiner, A., Matcovitch-Natan, O., Dvir-Szternfeld, R., Ulland, T. K., David, E., Baruch, K., Lara-Astaiso, D., Toth, B., et al. (2017) · Cell · doi:10.1016/j.cell.2017.05.018 · Cited by 5,493
Oakley, H., Cole, S. L., Logan, S., Maus, E., Shao, P., Craft, J., Guillozet-Bongaarts, A., Ohno, M., Disterhoft, J., Van Eldik, L., et al. (2006) · The Journal of Neuroscience · doi:10.1523/jneurosci.1202-06.2006 · Cited by 3,530 · cited 2×
“ease (FAD) mutant APP (Swedish, Florida, and London) and mutant FAD PS1 (M146L and L286V) [45].”
BackgroundTREM2 Variants in Alzheimer's Disease
Guerreiro, R., Wojtas, A., Bras, J., Carrasquillo, M., Rogaeva, E., Majounie, E., Cruchaga, C., Sassi, C., Kauwe, J. S. K., Younkin, S., et al. (2013) · New England Journal of Medicine · doi:10.1056/nejmoa1211851 · Cited by 3,020
Krasemann, S., Madore, C., Cialic, R., Baufeld, C., Calcagno, N., El Fatimy, R., Beckers, L., O’Loughlin, E., Xu, Y., Fanek, Z., et al. (2017) · Immunity · doi:10.1016/j.immuni.2017.08.008 · Cited by 2,979
Thomas, A. C., & Campbell, J. H. (2000) · Cited by 2,800
Variant of TREM2 Associated with the Risk of Alzheimer's Disease
Jonsson, T., Stefansson, H., Steinberg, S., Jonsdottir, I., Jonsson, P. V., Snaedal, J., Bjornsson, S., Huttenlocher, J., Levey, A. I., Lah, J. J., et al. (2013) · New England Journal of Medicine · doi:10.1056/nejmoa1211103 · Cited by 2,558
TREM2 Lipid Sensing Sustains the Microglial Response in an Alzheimer’s Disease Model
Wang, Y., Cella, M., Mallinson, K., Ulrich, J. D., Young, K. L., Robinette, M. L., Gilfillan, S., Krishnan, G. M., Sudhakar, S., Zinselmeyer, B. H., et al. (2015) · Cell · doi:10.1016/j.cell.2015.01.049 · Cited by 1,736
An english translation of alzheimer’s 1907 paper, “über eine eigenartige erkankung der hirnrinde”
Stelzmann, R. A., Norman Schnitzlein, H., & Reed Murtagh, F. (1995) · Clinical Anatomy · doi:10.1002/ca.980080612 · Cited by 1,455
Marschallinger, J., Iram, T., Zardeneta, M., Lee, S. E., Lehallier, B., Haney, M. S., Pluvinage, J. V., Mathur, V., Hahn, O., Morgens, D. W., et al. (2020) · Nature Neuroscience · doi:10.1038/s41593-019-0566-1 · Cited by 1,384 · cited 20×
“These data indicate the reduction in total PLIN2 area observed in R47H xMG transplanted mice is due to a reduced number of DAM xMGs, but not a reduced potential of R47H xMGs to accumulate lipid droplets.”
BackgroundMethodInfluential
Cited by
Sorted by citations
ApoE in Alzheimer’s disease: pathophysiology and therapeutic strategies
Raulin, A.-C., Doss, S. V., Trottier, Z. A., Ikezu, T. C., Bu, G., & Liu, C.-C. (2022) · Molecular Neurodegeneration · doi:10.1186/s13024-022-00574-4 · Cited by 756
Neuroinflammation in Alzheimer disease
Heneka, M. T., van der Flier, W. M., Jessen, F., Hoozemanns, J., Thal, D. R., Boche, D., Brosseron, F., Teunissen, C., Zetterberg, H., Jacobs, A. H., et al. (2025) · Nature Reviews Immunology · doi:10.1038/s41577-024-01104-7 · Cited by 638
APOE4/4 is linked to damaging lipid droplets in Alzheimer’s disease microglia
Haney, M. S., Pálovics, R., Munson, C. N., Long, C., Johansson, P. K., Yip, O., Dong, W., Rawat, E., West, E., Schlachetzki, J. C. M., et al. (2024) · Nature · doi:10.1038/s41586-024-07185-7 · Cited by 536
TREM2 drives microglia response to amyloid-β via SYK-dependent and -independent pathways
Wang, S., Sudan, R., Peng, V., Zhou, Y., Du, S., Yuede, C. M., Lei, T., Hou, J., Cai, Z., Cella, M., et al. (2022) · Cell · doi:10.1016/j.cell.2022.09.033 · Cited by 471
Metabolic regulation of the immune system in health and diseases: mechanisms and interventions
Hu, T., Liu, C., Lei, M., Zeng, Q., Li, L., Tang, H., & Zhang, N. (2024) · Signal Transduction and Targeted Therapy · doi:10.1038/s41392-024-01954-6 · Cited by 438
Metadata
- Authors
- Claes, C., Danhash, E. P., Hasselmann, J., Chadarevian, J. P., Shabestari, S. K., England, W. E., Lim, T. E., Hidalgo, J. L. S., Spitale, R. C., Davtyan, H., & Blurton-Jones, M.
- Affiliations
- University of California, Irvine (US)
- Corresponding author
- Claes, Christel
- Blurton-Jones, Mathew
- ORCID
- Venue
- Molecular Neurodegeneration
- Published
- 2021-07-23
- Volume
- 16
- Issue
- 1
- Pages
- 50-50
- ISSN
- 1750-1326 (ISSN-L)
- PMC
- PMC8305935
- OpenAlex
- W3184188306
- Cited by
- 197
- References
- 53
- Citations by year
- 2026: 38 · 2025: 44 · 2024: 44 · 2023: 31 · 2022: 38 · 2021: 1
- FWCI
- 11.41
- Type
- journal article
- Language
- en
- Open access
- gold
- doi.org
- Locations
- Molecular Neurodegeneration (publishedVersion, cc-by)
- PubMed Central (publishedVersion, cc-by)
- PubMed (publishedVersion)
- eScholarship (California Digital Library) (submittedVersion, cc-by)
- DOAJ (DOAJ: Directory of Open Access Journals) (submittedVersion, cc-by-sa)
- eScholarship (California Digital Library) (submittedVersion)
- Funders
- BrightFocus Foundation (A2020451F)
- National Institutes of Health (AG048099, AG056303, AG061895)
- Topics
- Life Sciences › Neuroscience › Neurology › Neuroinflammation and Neurodegeneration Mechanisms
- Life Sciences › Neuroscience › Cellular and Molecular Neuroscience › Alzheimer's disease research and treatments
- Life Sciences › Biochemistry, Genetics and Molecular Biology › Molecular Biology › Inflammasome and immune disorders
- Keywords
- Alzheimer's disease, disease-associated microglia, lipid droplets, TREM2, amyloid plaques, chimeric mouse model, CD9, apoE secretion, microglial activation, foam cells
- MeSH terms
- Alzheimer Disease, Animals, Brain, Chimera, Disease Models, Animal, Humans, Membrane Glycoproteins, Receptors, Immunologic, Microglia, Mice, Heterografts, Lipid Droplets
About these checks
Registry, retraction, Cites and statistics results are computed, not judged, with one exception: a printed reference that no index lists is read once by a model before it counts as a citation error. Claims are extracted by a model and kept only when their quote appears verbatim in the text; each cited source is then checked, with a model’s help, for whether it says what the claim relies on. Those verdicts can be wrong — read the claim’s quote and the cited source before relying on one.
Statistics and arithmetic are recomputed, not judged.
Confidence bands are shown only for fields calibrated on our annotated test set. None is calibrated yet, so no band is shown.
What counts as a claim ›How we measure confidence ›How we check this ›
Are you an author, or do you see a problem with this page? Request a review
