

The DOI matches its Crossref record; 106 of the 106 references it cites were found in a registry or an index.
Transcript and protein expression decoupling reveals RNA binding proteins and miRNAs as potential modulators of human aging
Open accessAbstract
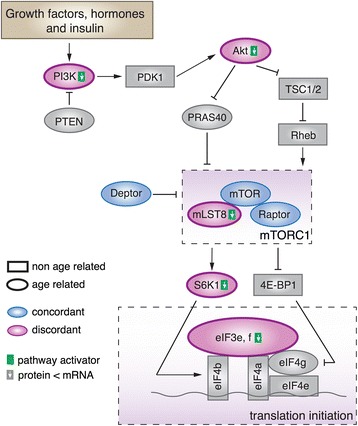
Background: In studies of development and aging, the expression of many genes has been shown to undergo drastic changes at mRNA and protein levels. The connection between mRNA and protein expression level changes, as well as the role of posttranscriptional regulation in controlling expression level changes in postnatal development and aging, remains largely unexplored. Results: Here, we survey mRNA and protein expression changes in the prefrontal cortex of humans and rhesus macaques over developmental and aging intervals of both species’ lifespans. We find substantial decoupling of mRNA and protein expression levels in aging, but not in development. Genes showing increased mRNA/protein disparity in primate brain aging form expression patterns conserved between humans and macaques and are enriched in specific functions involving mammalian target of rapamycin ( mTOR ) signaling, mitochondrial function and neurodegeneration. Mechanistically, aging-dependent mRNA/protein expression decoupling could be linked to a specific set of RNA binding proteins and, to a lesser extent, to specific microRNAs. Conclusions: Increased decoupling of mRNA and protein expression profiles observed in human and macaque brain aging results in specific co-expression profiles composed of genes with shared functions and shared regulatory signals linked to specific posttranscriptional regulators. Genes targeted and predicted to be targeted by the aging-dependent posttranscriptional regulation are associated with biological processes known to play important roles in aging and lifespan extension. These results indicate the potential importance of posttranscriptional regulation in modulating aging-dependent changes in humans and other species.
Overview
The claims and statistics of this paper haven’t been checked yet.
Run the check — free, no account needed. It reads the open-access text and checks the sources it cites.
Integrity signals
Registry
Cites
Statistics
Figures
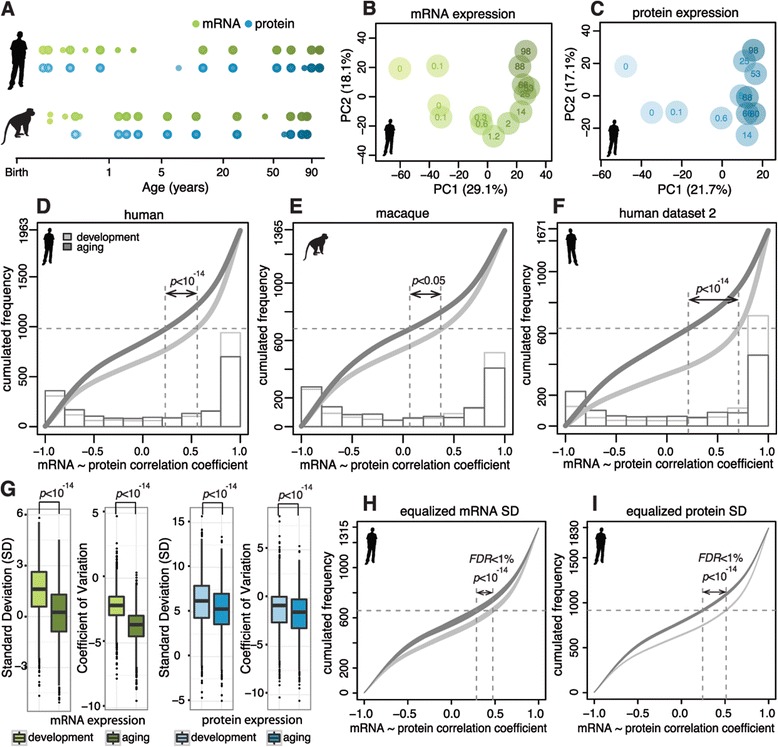
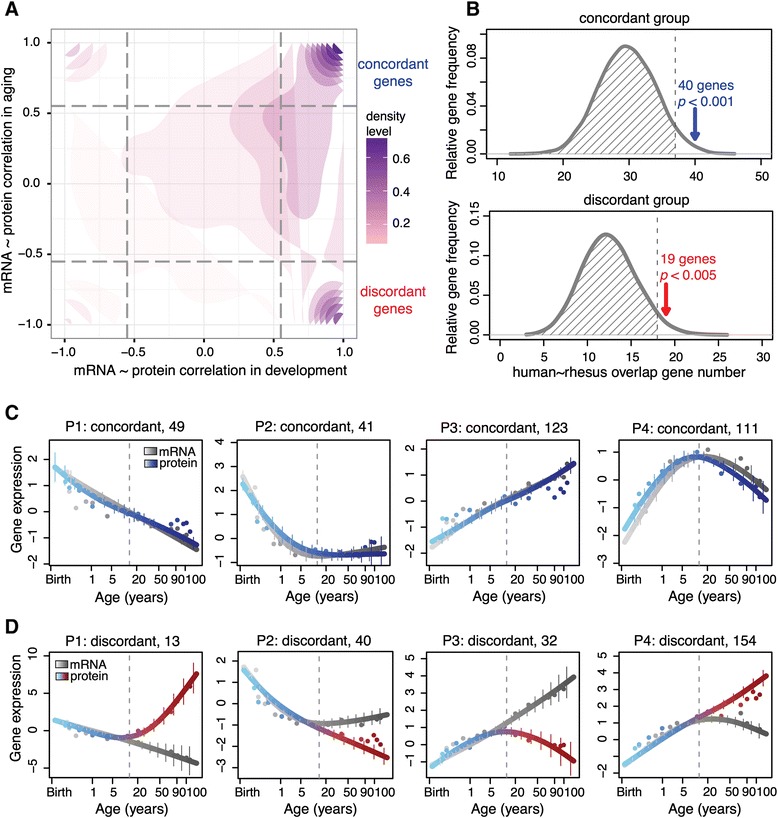
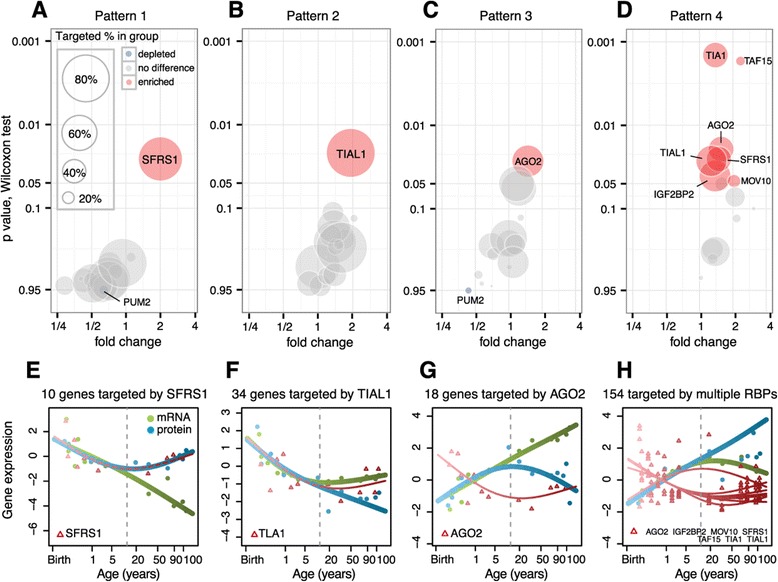
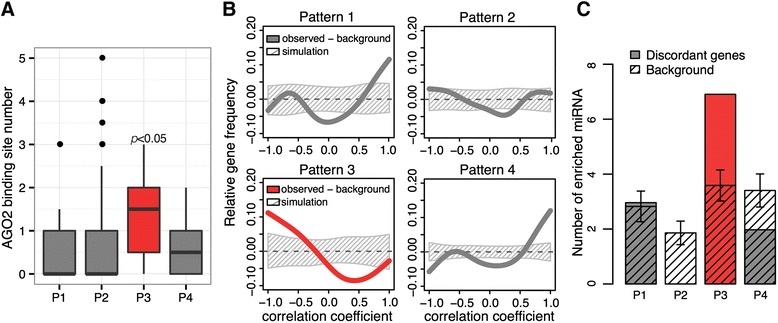
Verification
Claims the paper makes
The claims and statistics of this paper haven’t been checked yet.
Run the check — free, no account needed. It reads the open-access text and checks the sources it cites.
Claims other papers make about this one
Each is checked against this paper’s own text: does it say what the citing paper says it does?
The cited source says what the claim attributes to it.
In the citing paper
“The discordance or decoupling in mRNA and protein expression of the same genes has been reported in studies with human aging [67] and neurodegenerative disorders such as tauopathy [68] and AD [69]”
From Sex specific molecular networks and key drivers of Alzheimer’s disease (2023) · cites this paper as [67]
Self-check
Percentages, sums and reported differences re-computed from the paper’s own numbers.
The self-check needs the paper’s full text.
Citations
Cites
The Sequence Alignment/Map format and SAMtools
Li, H., Handsaker, B., Wysoker, A., Fennell, T., Ruan, J., Homer, N., Marth, G., Abecasis, G., Durbin, R., & 1000 Genome Project Data Processing Subgroup (2009) · Bioinformatics · doi:10.1093/bioinformatics/btp352 · Cited by 62,041
STAR: ultrafast universal RNA-seq aligner
Dobin, A., Davis, C. A., Schlesinger, F., Drenkow, J., Zaleski, C., Jha, S., Batut, P., Chaisson, M., & Gingeras, T. R. (2013) · Bioinformatics · doi:10.1093/bioinformatics/bts635 · Cited by 51,709
MUSCLE: multiple sequence alignment with high accuracy and high throughput
Edgar, R. C. (2004) · Nucleic Acids Research · doi:10.1093/nar/gkh340 · Cited by 44,662
Ultrafast and memory-efficient alignment of short DNA sequences to the human genome.
Langmead, B., Trapnell, C., Pop, M., & Salzberg, S. L. (2009) · Genome Biology · doi:10.1186/gb-2009-10-3-r25 · Cited by 21,849
Lewis, B. P., Burge, C. B., & Bartel, D. P. (2005) · Cell · doi:10.1016/j.cell.2004.12.035 · Cited by 11,855
Database resources of the National Center for Biotechnology Information: update
Wheeler, D. L. (2003) · Nucleic Acids Research · doi:10.1093/nar/gkh073 · Cited by 10,695
NCBI GEO: archive for functional genomics data sets—update
Barrett, T., Wilhite, S. E., Ledoux, P., Evangelista, C., Kim, I. F., Tomashevsky, M., Marshall, K. A., Phillippy, K. H., Sherman, P. M., Holko, M., et al. (2012) · Nucleic Acids Research · doi:10.1093/nar/gks1193 · Cited by 10,418
GENCODE: The reference human genome annotation for The ENCODE Project
Harrow, J., Frankish, A., Gonzalez, J. M., Tapanari, E., Diekhans, M., Kokocinski, F., Aken, B. L., Barrell, D., Zadissa, A., Searle, S., et al. (2012) · Genome Research · doi:10.1101/gr.135350.111 · Cited by 4,585
miRBase: microRNA sequences, targets and gene nomenclature
Griffiths-Jones, S. (2006) · Nucleic Acids Research · doi:10.1093/nar/gkj112 · Cited by 3,950
miRBase: integrating microRNA annotation and deep-sequencing data
Kozomara, A., & Griffiths-Jones, S. (2011) · Nucleic Acids Research · doi:10.1093/nar/gkq1027 · Cited by 3,634
Cited by
Sorted by citations
Items 101–141 of 141
A comprehensive multi-organ proteomic atlas of human aging across 50 years
Dong, W., Klosa, P. C., Beyer, A., Lin, X., & Liu, C. (2025) · Protein & Cell · doi:10.1093/procel/pwaf081
Qiu, H., Wang, H., Zhou, Q., Guo, J., & Sha, Z. (2025) · Aquaculture Reports · doi:10.1016/j.aqrep.2025.103160
Additional file 11 of Sex specific molecular networks and key drivers of Alzheimer’s disease
Guo, L., Cao, J., Hou, J., Li, Y., Huang, M., Zhu, L., Zhang, L., Lee, Y., Duarte, M. L., Zhou, X., et al. (2024) · Figshare · doi:10.6084/m9.figshare.26598377
Additional file 2 of Sex specific molecular networks and key drivers of Alzheimer’s disease
Guo, L., Cao, J., Hou, J., Li, Y., Huang, M., Zhu, L., Zhang, L., Lee, Y., Duarte, M. L., Zhou, X., et al. (2024) · Figshare · doi:10.6084/m9.figshare.26598350
Additional file 13 of Sex specific molecular networks and key drivers of Alzheimer’s disease
Guo, L., Cao, J., Hou, J., Li, Y., Huang, M., Zhu, L., Zhang, L., Lee, Y., Duarte, M. L., Zhou, X., et al. (2024) · Figshare · doi:10.6084/m9.figshare.26598383
Pauls, E., Bayod, S., Mateo, L., Alcalde, V., Juan-Blanco, T., Sánchez‐Soto, M., Saido, T. C., Saito, T., Berrenguer-Llergo, A., Attolini, C. S., et al. (2021) · Figshare · doi:10.6084/m9.figshare.16880438
Additional file 1 of Sex specific molecular networks and key drivers of Alzheimer’s disease
Guo, L., Cao, J., Hou, J., Li, Y., Huang, M., Zhu, L., Zhang, L., Lee, Y., Duarte, M. L., Zhou, X., et al. (2024) · Figshare · doi:10.6084/m9.figshare.26598347
Additional file 5 of Sex specific molecular networks and key drivers of Alzheimer’s disease
Guo, L., Cao, J., Hou, J., Li, Y., Huang, M., Zhu, L., Zhang, L., Lee, Y., Duarte, M. L., Zhou, X., et al. (2024) · Figshare · doi:10.6084/m9.figshare.26598359
Additional file 23 of Sex specific molecular networks and key drivers of Alzheimer’s disease
Guo, L., Cao, J., Hou, J., Li, Y., Huang, M., Zhu, L., Zhang, L., Lee, Y., Duarte, M. L., Zhou, X., et al. (2024) · Figshare · doi:10.6084/m9.figshare.26598413
Additional file 20 of Sex specific molecular networks and key drivers of Alzheimer’s disease
Guo, L., Cao, J., Hou, J., Li, Y., Huang, M., Zhu, L., Zhang, L., Lee, Y., Duarte, M. L., Zhou, X., et al. (2024) · Figshare · doi:10.6084/m9.figshare.26598404
Additional file 25 of Sex specific molecular networks and key drivers of Alzheimer’s disease
Guo, L., Cao, J., Hou, J., Li, Y., Huang, M., Zhu, L., Zhang, L., Lee, Y., Duarte, M. L., Zhou, X., et al. (2024) · Figshare · doi:10.6084/m9.figshare.26598419
Additional file 4 of Sex specific molecular networks and key drivers of Alzheimer’s disease
Guo, L., Cao, J., Hou, J., Li, Y., Huang, M., Zhu, L., Zhang, L., Lee, Y., Duarte, M. L., Zhou, X., et al. (2024) · Figshare · doi:10.6084/m9.figshare.26598356
Additional file 7 of Sex specific molecular networks and key drivers of Alzheimer’s disease
Guo, L., Cao, J., Hou, J., Li, Y., Huang, M., Zhu, L., Zhang, L., Lee, Y., Duarte, M. L., Zhou, X., et al. (2024) · Figshare · doi:10.6084/m9.figshare.26598365
Additional file 26 of Sex specific molecular networks and key drivers of Alzheimer’s disease
Guo, L., Cao, J., Hou, J., Li, Y., Huang, M., Zhu, L., Zhang, L., Lee, Y., Duarte, M. L., Zhou, X., et al. (2024) · Figshare · doi:10.6084/m9.figshare.26598422
Additional file 18 of Sex specific molecular networks and key drivers of Alzheimer’s disease
Guo, L., Cao, J., Hou, J., Li, Y., Huang, M., Zhu, L., Zhang, L., Lee, Y., Duarte, M. L., Zhou, X., et al. (2024) · Figshare · doi:10.6084/m9.figshare.26598398
Additional file 29 of Sex specific molecular networks and key drivers of Alzheimer’s disease
Guo, L., Cao, J., Hou, J., Li, Y., Huang, M., Zhu, L., Zhang, L., Lee, Y., Duarte, M. L., Zhou, X., et al. (2024) · Figshare · doi:10.6084/m9.figshare.26598431
Additional file 3 of Sex specific molecular networks and key drivers of Alzheimer’s disease
Guo, L., Cao, J., Hou, J., Li, Y., Huang, M., Zhu, L., Zhang, L., Lee, Y., Duarte, M. L., Zhou, X., et al. (2024) · Figshare · doi:10.6084/m9.figshare.26598353
Additional file 8 of Sex specific molecular networks and key drivers of Alzheimer’s disease
Guo, L., Cao, J., Hou, J., Li, Y., Huang, M., Zhu, L., Zhang, L., Lee, Y., Duarte, M. L., Zhou, X., et al. (2024) · Figshare · doi:10.6084/m9.figshare.26598368
Additional file 14 of Sex specific molecular networks and key drivers of Alzheimer’s disease
Guo, L., Cao, J., Hou, J., Li, Y., Huang, M., Zhu, L., Zhang, L., Lee, Y., Duarte, M. L., Zhou, X., et al. (2024) · Figshare · doi:10.6084/m9.figshare.26598386
Additional file 6 of Sex specific molecular networks and key drivers of Alzheimer’s disease
Guo, L., Cao, J., Hou, J., Li, Y., Huang, M., Zhu, L., Zhang, L., Lee, Y., Duarte, M. L., Zhou, X., et al. (2024) · Figshare · doi:10.6084/m9.figshare.26598362
Additional file 16 of Sex specific molecular networks and key drivers of Alzheimer’s disease
Guo, L., Cao, J., Hou, J., Li, Y., Huang, M., Zhu, L., Zhang, L., Lee, Y., Duarte, M. L., Zhou, X., et al. (2024) · Figshare · doi:10.6084/m9.figshare.26598392
Additional file 9 of Sex specific molecular networks and key drivers of Alzheimer’s disease
Guo, L., Cao, J., Hou, J., Li, Y., Huang, M., Zhu, L., Zhang, L., Lee, Y., Duarte, M. L., Zhou, X., et al. (2024) · Figshare · doi:10.6084/m9.figshare.26598371
Liu, Y., Peng, L., Chen, J., Chen, L., Wu, Y., Cheng, M., Chen, M., Ye, X., & Jin, Y. (2023) · Figshare · doi:10.6084/m9.figshare.22606937
Additional file 10 of Sex specific molecular networks and key drivers of Alzheimer’s disease
Guo, L., Cao, J., Hou, J., Li, Y., Huang, M., Zhu, L., Zhang, L., Lee, Y., Duarte, M. L., Zhou, X., et al. (2024) · Figshare · doi:10.6084/m9.figshare.26598374
Additional file 27 of Sex specific molecular networks and key drivers of Alzheimer’s disease
Guo, L., Cao, J., Hou, J., Li, Y., Huang, M., Zhu, L., Zhang, L., Lee, Y., Duarte, M. L., Zhou, X., et al. (2024) · Figshare · doi:10.6084/m9.figshare.26598425
Additional file 15 of Sex specific molecular networks and key drivers of Alzheimer’s disease
Guo, L., Cao, J., Hou, J., Li, Y., Huang, M., Zhu, L., Zhang, L., Lee, Y., Duarte, M. L., Zhou, X., et al. (2024) · Figshare · doi:10.6084/m9.figshare.26598389
Additional file 17 of Sex specific molecular networks and key drivers of Alzheimer’s disease
Guo, L., Cao, J., Hou, J., Li, Y., Huang, M., Zhu, L., Zhang, L., Lee, Y., Duarte, M. L., Zhou, X., et al. (2024) · Figshare · doi:10.6084/m9.figshare.26598395
Additional file 30 of Sex specific molecular networks and key drivers of Alzheimer’s disease
Guo, L., Cao, J., Hou, J., Li, Y., Huang, M., Zhu, L., Zhang, L., Lee, Y., Duarte, M. L., Zhou, X., et al. (2024) · Figshare · doi:10.6084/m9.figshare.26598434
Additional file 22 of Sex specific molecular networks and key drivers of Alzheimer’s disease
Guo, L., Cao, J., Hou, J., Li, Y., Huang, M., Zhu, L., Zhang, L., Lee, Y., Duarte, M. L., Zhou, X., et al. (2024) · Figshare · doi:10.6084/m9.figshare.26598410
Additional file 12 of Sex specific molecular networks and key drivers of Alzheimer’s disease
Guo, L., Cao, J., Hou, J., Li, Y., Huang, M., Zhu, L., Zhang, L., Lee, Y., Duarte, M. L., Zhou, X., et al. (2024) · Figshare · doi:10.6084/m9.figshare.26598380
Additional file 21 of Sex specific molecular networks and key drivers of Alzheimer’s disease
Guo, L., Cao, J., Hou, J., Li, Y., Huang, M., Zhu, L., Zhang, L., Lee, Y., Duarte, M. L., Zhou, X., et al. (2024) · Figshare · doi:10.6084/m9.figshare.26598407
Additional file 24 of Sex specific molecular networks and key drivers of Alzheimer’s disease
Guo, L., Cao, J., Hou, J., Li, Y., Huang, M., Zhu, L., Zhang, L., Lee, Y., Duarte, M. L., Zhou, X., et al. (2024) · Figshare · doi:10.6084/m9.figshare.26598416
Additional file 19 of Sex specific molecular networks and key drivers of Alzheimer’s disease
Guo, L., Cao, J., Hou, J., Li, Y., Huang, M., Zhu, L., Zhang, L., Lee, Y., Duarte, M. L., Zhou, X., et al. (2024) · Figshare · doi:10.6084/m9.figshare.26598401
Additional file 28 of Sex specific molecular networks and key drivers of Alzheimer’s disease
Guo, L., Cao, J., Hou, J., Li, Y., Huang, M., Zhu, L., Zhang, L., Lee, Y., Duarte, M. L., Zhou, X., et al. (2024) · Figshare · doi:10.6084/m9.figshare.26598428
Translational Changes upon Aging and Dietary Restriction in Progeroid DNA-Repair-Deficient Mice
Vermeij, W. P., van Galen, I., Ozinga, R. A., Hofman, D. A., van Dinter, J. T., Engels, S. A. G., Smit, K., van Heesch, S., & Hoeijmakers, J. H. J. (2026) · Aging Biology · doi:10.59368/agingbio.20260043
Yoo, S., Vannur, L., Li, L., Young, C., Liu, Q., Wen, Z., Zhang, Y., Florens, L. A., Si, K., Zhuang, J., et al. (2026) · bioRxiv (Cold Spring Harbor Laboratory) · doi:10.64898/2026.02.26.708310
Cai, M., & Xu, M. (2026) · International Journal of Molecular Sciences · doi:10.3390/ijms27156808
Zakar‐Polyák, E., & Kerepesi, C. (2026) · bioRxiv (Cold Spring Harbor Laboratory) · doi:10.64898/2026.08.09.743737
RNA dysregulation as a determinant of aging and neurodegenerative vulnerability
Randles, S., & Yeo, G. W.-M. (2026) · Trends in Cell Biology · doi:10.1016/j.tcb.2026.08.008
Surface Chemistry Shapes Nanoplastic Mixture Responses in Developing Amniote Embryos
Duan, X., Wang, X., Helal, M., Laghrissi, A., Tollefsen, K. E., Burggren, W. W., Chen, H., Wang, S., Wei, R., Wu, C., et al. (2026) · Environmental Science & Technology · doi:10.1021/acs.est.6c12246
Zhang, J., Su, W., Duan, J., Sun, Y., & Liu, B. (2026) · The Innovation Life · doi:10.59717/j.xinn-life.2026.100262
Metadata
- Authors
- Wei, Y.-N., Hu, H.-Y., Xie, G.-C., Fu, N., Ning, Z.-B., Zeng, R., & Khaitovich, P.
- Affiliations
- Chinese Academy of Sciences (CN)
- Skolkovo Institute of Science and Technology (RU)
- Corresponding author
- Zeng, Rong
- Khaitovich, Philipp
- Venue
- Genome Biology
- Published
- 2015-02-22
- Volume
- 16
- Issue
- 1
- Pages
- 41-41
- ISSN
- 1465-6906 (ISSN-L)
- PMC
- PMC4375924
- OpenAlex
- W1989635088
- Cited by
- 117
- References
- 106
- Citations by year
- 2026: 10 · 2025: 15 · 2024: 27 · 2023: 11 · 2022: 6 · 2021: 10 · 2020: 8 · 2019: 3 · 2018: 4 · 2017: 10 · 2016: 5 · 2015: 8
- FWCI
- 3.60
- Type
- journal article
- Language
- en
- Open access
- gold
- doi.org
- Locations
- Genome biology (publishedVersion, cc-by)
- PubMed Central (publishedVersion, cc-by)
- PubMed (publishedVersion)
- uO Research (University of Ottawa) (submittedVersion, public-domain)
- Max Planck Digital Library (submittedVersion, other-oa)
- MPG.PuRe (Max Planck Society) (submittedVersion, other-oa)
- Funders
- National Natural Science Foundation of China (31171232, 91331203)
- Chinese Academy of Sciences (XDB13010200)
- Ministry of Science and Technology of the People's Republic of China (2011CB910200)
- Bureau of International Cooperation, Chinese Academy of Sciences (GJHZ201313)
- Russian Science Foundation (14‐28‐00234)
- Topics
- Life Sciences › Biochemistry, Genetics and Molecular Biology › Aging › Genetics, Aging, and Longevity in Model Organisms
- Life Sciences › Biochemistry, Genetics and Molecular Biology › Molecular Biology › RNA Research and Splicing
- Life Sciences › Biochemistry, Genetics and Molecular Biology › Molecular Biology › Single-cell and spatial transcriptomics
- Keywords
- post-transcriptional regulation, human aging, rhesus monkeys, prefrontal cortex, RNA-binding proteins, microRNA, mTOR signaling, mitochondrial function, neurodegeneration, gene co-expression, lifespan extension, developmental gene expression
- MeSH terms
- Aging, Animals, Humans, Macaca mulatta, RNA, Messenger, Signal Transduction, RNA-Binding Proteins, Prefrontal Cortex, Gene Expression Regulation, Developmental, Gene Expression Profiling, MicroRNAs
About these checks
Registry, retraction, Cites and statistics results are computed, not judged, with one exception: a printed reference that no index lists is read once by a model before it counts as a citation error. Claims are extracted by a model and kept only when their quote appears verbatim in the text; each cited source is then checked, with a model’s help, for whether it says what the claim relies on. Those verdicts can be wrong — read the claim’s quote and the cited source before relying on one.
Statistics and arithmetic are recomputed, not judged.
Confidence bands are shown only for fields calibrated on our annotated test set. None is calibrated yet, so no band is shown.
What counts as a claim ›How we measure confidence ›How we check this ›
Are you an author, or do you see a problem with this page? Request a review
