

The DOI matches its Crossref record; 26 of the 26 references it cites were found in a registry or an index.
Comparison of Hi-C results using in-solution versus in-nucleus ligation
Open accessAbstract
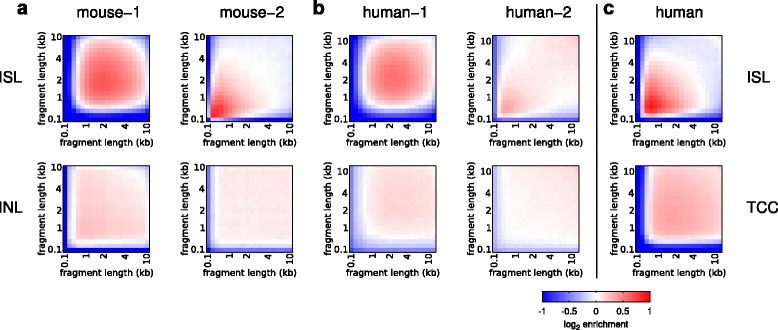
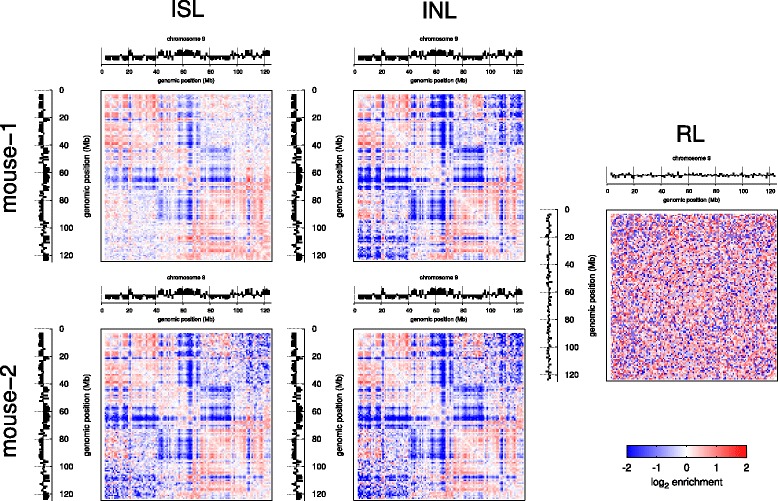
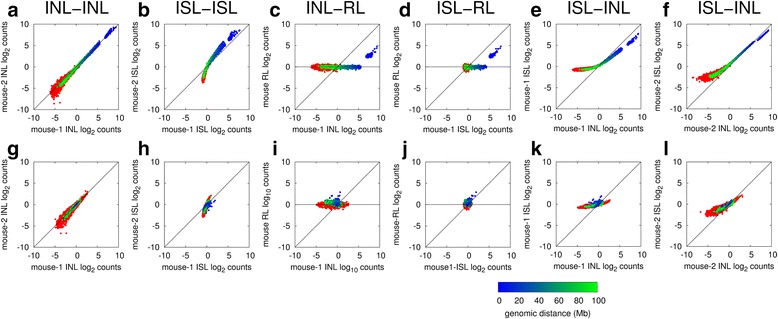
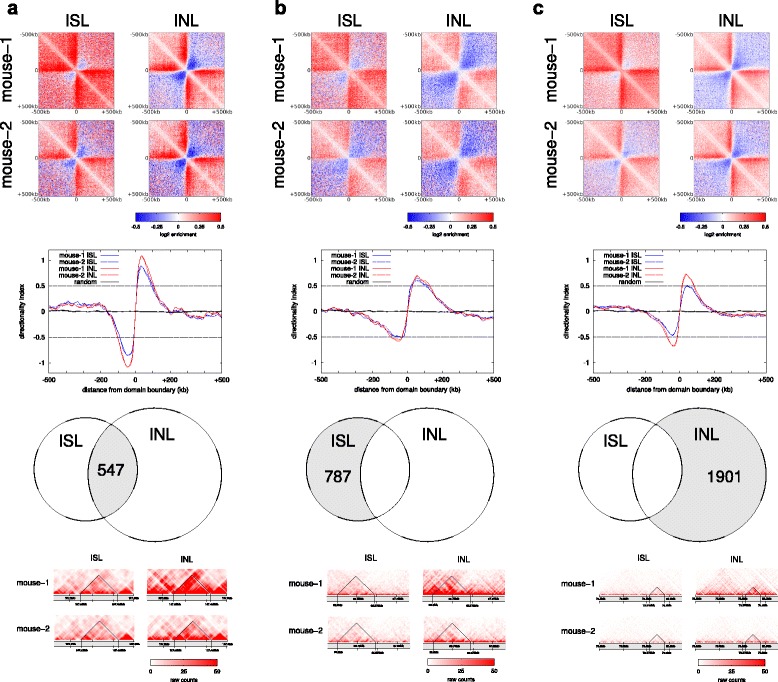
BACKGROUND: Chromosome conformation capture and various derivative methods such as 4C, 5C and Hi-C have emerged as standard tools to analyze the three-dimensional organization of the genome in the nucleus. These methods employ ligation of diluted cross-linked chromatin complexes, intended to favor proximity-dependent, intra-complex ligation. During development of single-cell Hi-C, we devised an alternative Hi-C protocol with ligation in preserved nuclei rather than in solution. Here we directly compare Hi-C methods employing in-nucleus ligation with the standard in-solution ligation. RESULTS: We show in-nucleus ligation results in consistently lower levels of inter-chromosomal contacts. Through chromatin mixing experiments we show that a significantly large fraction of inter-chromosomal contacts are the result of spurious ligation events formed during in-solution ligation. In-nucleus ligation significantly reduces this source of experimental noise, and results in improved reproducibility between replicates. We also find that in-nucleus ligation eliminates restriction fragment length bias found with in-solution ligation. These improvements result in greater reproducibility of long-range intra-chromosomal and inter-chromosomal contacts, as well as enhanced detection of structural features such as topologically associated domain boundaries. CONCLUSIONS: We conclude that in-nucleus ligation captures chromatin interactions more consistently over a wider range of distances, and significantly reduces both experimental noise and bias. In-nucleus ligation creates higher quality Hi-C libraries while simplifying the experimental procedure. We suggest that the entire range of 3C applications are likely to show similar benefits from in-nucleus ligation.
Overview
The claims and statistics of this paper haven’t been checked yet.
Run the check — free, no account needed. It reads the open-access text and checks the sources it cites.
Integrity signals
Registry
Cites
Statistics
Figures
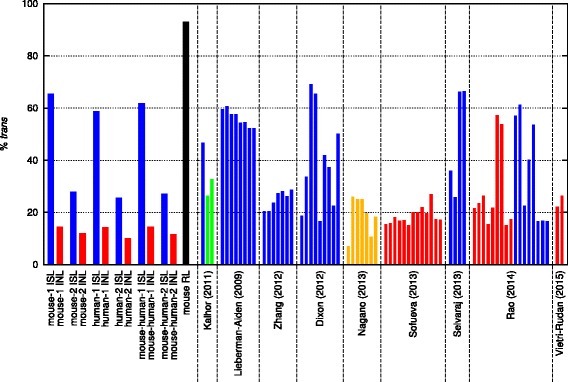
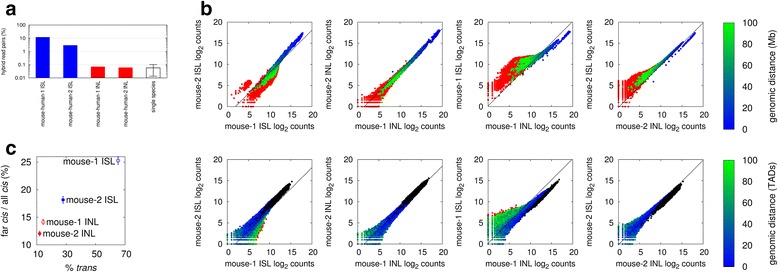
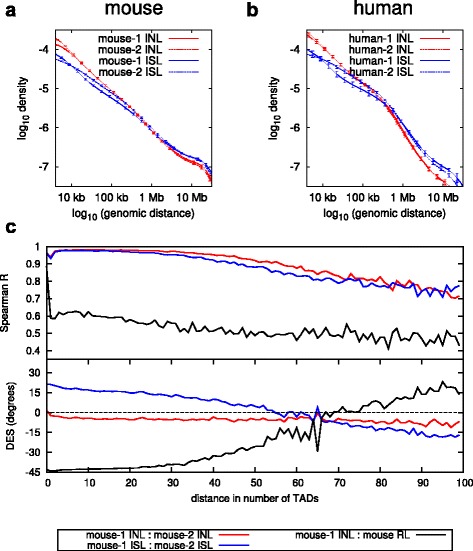
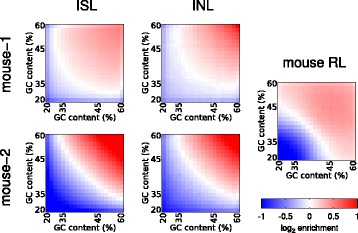
Verification
Claims the paper makes
The claims and statistics of this paper haven’t been checked yet.
Run the check — free, no account needed. It reads the open-access text and checks the sources it cites.
Claims other papers make about this one
Each is checked against this paper’s own text: does it say what the citing paper says it does?
In the citing paper
“indicative of high library quality13”
From Cell-cycle dynamics of chromosomal organization at single-cell resolution (2017) · cites this paper as [13]
Self-check
Percentages, sums and reported differences re-computed from the paper’s own numbers.
The self-check needs the paper’s full text.
Citations
Cites
An integrated encyclopedia of DNA elements in the human genome
The ENCODE Project Consortium (2012) · Nature · doi:10.1038/nature11247 · Cited by 18,072
Heinz, S., Benner, C., Spann, N., Bertolino, E., Lin, Y. C., Laslo, P., Cheng, J. X., Murre, C., Singh, H., & Glass, C. K. (2010) · Molecular Cell · doi:10.1016/j.molcel.2010.05.004 · Cited by 13,382
A 3D Map of the Human Genome at Kilobase Resolution Reveals Principles of Chromatin Looping
Rao, S. S. P., Huntley, M. H., Durand, N. C., Stamenova, E. K., Bochkov, I. D., Robinson, J. T., Sanborn, A. L., Machol, I., Omer, A. D., Lander, E. S., et al. (2014) · Cell · doi:10.1016/j.cell.2014.11.021 · Cited by 9,212
Comprehensive Mapping of Long-Range Interactions Reveals Folding Principles of the Human Genome
Lieberman-Aiden, E., van Berkum, N. L., Williams, L., Imakaev, M., Ragoczy, T., Telling, A., Amit, I., Lajoie, B. R., Sabo, P. J., Dorschner, M. O., et al. (2009) · Science · doi:10.1126/science.1181369 · Cited by 8,898
Topological domains in mammalian genomes identified by analysis of chromatin interactions
Dixon, J. R., Selvaraj, S., Yue, F., Kim, A., Li, Y., Shen, Y., Hu, M., Liu, J. S., & Ren, B. (2012) · Nature · doi:10.1038/nature11082 · Cited by 6,829
Spatial partitioning of the regulatory landscape of the X-inactivation centre
Nora, E. P., Lajoie, B. R., Schulz, E. G., Giorgetti, L., Okamoto, I., Servant, N., Piolot, T., van Berkum, N. L., Meisig, J., Sedat, J., et al. (2012) · Nature · doi:10.1038/nature11049 · Cited by 2,895
Three-dimensional folding and functional organization principles of the Drosophila genome
Sexton, T., Yaffe, E., Kenigsberg, E., Bantignies, F., Leblanc, B., Hoichman, M., Parrinello, H., Tanay, A., & Cavalli, G. (2012) · Cell · doi:10.1016/j.cell.2012.01.010 · Cited by 1,983
Single-cell Hi-C reveals cell-to-cell variability in chromosome structure
Nagano, T., Lubling, Y., Stevens, T. J., Schoenfelder, S., Yaffe, E., Dean, W., Laue, E. D., Tanay, A., & Fraser, P. (2013) · Nature · doi:10.1038/nature12593 · Cited by 1,589
Self-citationIterative correction of Hi-C data reveals hallmarks of chromosome organization
Imakaev, M., Fudenberg, G., McCord, R. P., Naumova, N., Goloborodko, A., Lajoie, B. R., Dekker, J., & Mirny, L. A. (2012) · Nature Methods · doi:10.1038/nmeth.2148 · Cited by 1,423
A map of the cis-regulatory sequences in the mouse genome
Shen, Y., Yue, F., McCleary, D. F., Ye, Z., Edsall, L., Kuan, S., Wagner, U., Dixon, J., Lee, L., Lobanenkov, V. V., et al. (2012) · Nature · doi:10.1038/nature11243 · Cited by 1,361 · cited 1×
“This was done by multiplying the eigenvector by −1 if the Pearson correlation coefficient of the eigenvector and the H3K4me3 histone modification mark ChIPseq [19, 28] profile was negative.”
MethodAnalyzing and minimizing PCR amplification bias in Illumina sequencing libraries
Aird, D., Ross, M. G., Chen, W.-S., Danielsson, M., Fennell, T., Russ, C., Jaffe, D. B., Nusbaum, C., & Gnirke, A. (2011) · Genome Biology · doi:10.1186/gb-2011-12-2-r18 · Cited by 1,174
Exploring the three-dimensional organization of genomes: Interpreting chromatin interaction data
Dekker, J., Marti-Renom, M. A., & Mirny, L. A. (2013) · Nature Reviews Genetics · doi:10.1038/nrg3454 · Cited by 1,068
Comparative Hi-C Reveals that CTCF Underlies Evolution of Chromosomal Domain Architecture
Vietri Rudan, M., Barrington, C., Henderson, S., Ernst, C., Odom, D. T., Tanay, A., & Hadjur, S. (2015) · Cell Reports · doi:10.1016/j.celrep.2015.02.004 · Cited by 680 · cited 1×
“trans-chromosomal contacts to be intermediate between in-solution and in-nucleus Hi-C ligation [10, 13, 14, 20].”
BackgroundYaffe, E., & Tanay, A. (2011) · Nature Genetics · doi:10.1038/ng.947 · Cited by 614
Spatial Organization of the Mouse Genome and Its Role in Recurrent Chromosomal Translocations
Zhang, Y., McCord, R. P., Ho, Y.-J., Lajoie, B. R., Hildebrand, D. G., Simon, A. C., Becker, M. S., Alt, F. W., & Dekker, J. (2012) · Cell · doi:10.1016/j.cell.2012.02.002 · Cited by 572
Kalhor, R., Tjong, H., Jayathilaka, N., Alber, F., & Chen, L. (2011) · Nature Biotechnology · doi:10.1038/nbt.2057 · Cited by 554
The pluripotent regulatory circuitry connecting promoters to their long-range interacting elements
Schoenfelder, S., Furlan-Magaril, M., Mifsud, B., Tavares-Cadete, F., Sugar, R., Javierre, B.-M., Nagano, T., Katsman, Y., Sakthidevi, M., Wingett, S. W., et al. (2015) · Genome Research · doi:10.1101/gr.185272.114 · Cited by 460
Self-citationCohesin-mediated interactions organize chromosomal domain architecture
Sofueva, S., Yaffe, E., Chan, W., Georgopoulou, D., Vietri Rudan, M., Mira‐Bontenbal, H., Pollard, S. M., Schroth, G. P., Tanay, A., & Hadjur, S. (2013) · The EMBO Journal · doi:10.1038/emboj.2013.237 · Cited by 394
The three 'C' s of chromosome conformation capture: controls, controls, controls
Dekker, J. (2005) · Nature Methods · doi:10.1038/nmeth823 · Cited by 358
Whole-genome haplotype reconstruction using proximity-ligation and shotgun sequencing
Selvaraj, S., Dixon, J. R., Bansal, V., & Ren, B. (2013) · Nature Biotechnology · doi:10.1038/nbt.2728 · Cited by 294
Targeted sequencing by proximity ligation for comprehensive variant detection and local haplotyping
de Vree, P. J. P., de Wit, E., Yilmaz, M., van de Heijning, M., Klous, P., Verstegen, M. J. A. M., Wan, Y., Teunissen, H., Krijger, P. H. L., Geeven, G., et al. (2014) · Nature Biotechnology · doi:10.1038/nbt.2959 · Cited by 274
Unbiased analysis of potential targets of breast cancer susceptibility loci by Capture Hi-CPreprint
Dryden, N. H., Broome, L. R., Dudbridge, F., Johnson, N., Orr, N., Schoenfelder, S., Nagano, T., Andrews, S., Wingett, S., Kozarewa, I., et al. (2014) · Genome Research · doi:10.1101/gr.175034.114 · Cited by 261
Self-citationCapture Hi-C identifies the chromatin interactome of colorectal cancer risk loci
Jäger, R., Migliorini, G., Henrion, M., Kandaswamy, R., Speedy, H. E., Heindl, A., Whiffin, N., Carnicer, M. J., Broome, L. R., Dryden, N. H., et al. (2015) · Nature Communications · doi:10.1038/ncomms7178 · Cited by 216
Self-citationComet, I. V., Schuettengruber, B., Sexton, T., & Cavalli, G. (2011) · Proceedings of the National Academy of Sciences · doi:10.1073/pnas.1002059108 · Cited by 126
Gavrilov, A. A., Gushchanskaya, E. S., Strelkova, O., Zhironkina, O., Kireev, I. I., Iarovaia, O. V., & Razin, S. V. (2013) · Nucleic Acids Research · doi:10.1093/nar/gkt067 · Cited by 87
SnapShot: Chromosome Conformation Capture
Hakim, O., & Misteli, T. (2012) · Cell · doi:10.1016/j.cell.2012.02.019 · Cited by 64
Research works printed but not linked: 1
- Datasets deposited at Gene Expression Omnibus, GSE70181. http://www.ncbi.nlm.nih.gov/geo/query/acc.cgi?token=wtmfywywjrshbip&acc=GSE70181 .
Cited by
Sorted by citations
HiChIP: efficient and sensitive analysis of protein-directed genome architecture
Mumbach, M. R., Rubin, A. J., Flynn, R. A., Dai, C., Khavari, P. A., Greenleaf, W. J., & Chang, H. Y. (2016) · Nature Methods · doi:10.1038/nmeth.3999 · Cited by 1,139
Javierre, B. M., Burren, O. S., Wilder, S. P., Kreuzhuber, R., Hill, S. M., Sewitz, S., Cairns, J., Wingett, S. W., Várnai, C., Thiecke, M. J., et al. (2016) · Cell · doi:10.1016/j.cell.2016.09.037 · Cited by 1,046
Self-citationYY1 Is a Structural Regulator of Enhancer-Promoter Loops
Weintraub, A. S., Li, C. H., Zamudio, A. V., Sigova, A. A., Hannett, N. M., Day, D. S., Abraham, B. J., Cohen, M. A., Nabet, B., Buckley, D. L., et al. (2017) · Cell · doi:10.1016/j.cell.2017.11.008 · Cited by 992
Wutz, G., Várnai, C., Nagasaka, K., Cisneros, D. A., Stocsits, R. R., Tang, W., Schoenfelder, S., Jessberger, G., Muhar, M., Hossain, M. J., et al. (2017) · The EMBO Journal · doi:10.15252/embj.201798004 · Cited by 864
Self-citationCell-cycle dynamics of chromosomal organization at single-cell resolution
Nagano, T., Lubling, Y., Várnai, C., Dudley, C., Leung, W., Baran, Y., Mendelson Cohen, N., Wingett, S., Fraser, P., & Tanay, A. (2017) · Nature · doi:10.1038/nature23001 · Cited by 794
Self-citation
Metadata
- Authors
- Nagano, T., Várnai, C., Schoenfelder, S., Javierre, B.-M., Wingett, S. W., & Fraser, P.
- Affiliations
- Babraham Institute (GB)
- Corresponding author
- Nagano, Takashi
- Fraser, Peter
- ORCID
- Venue
- Genome Biology
- Published
- 2015-08-26
- Volume
- 16
- Issue
- 1
- Pages
- 175-175
- ISSN
- 1465-6906 (ISSN-L)
- 1474-760X
- PMC
- PMC4580221
- OpenAlex
- W2116261028
- Cited by
- 166
- References
- 26
- Citations by year
- 2026: 4 · 2025: 5 · 2024: 8 · 2023: 8 · 2022: 11 · 2021: 20 · 2020: 17 · 2019: 23 · 2018: 25 · 2017: 27 · 2016: 12 · 2015: 5
- FWCI
- 9.99
- Type
- journal article
- Language
- en
- Open access
- gold
- doi.org
- Licence
- Locations
- Genome biology (publishedVersion, cc-by)
- PubMed Central (publishedVersion, cc-by)
- PubMed (publishedVersion)
- University of Birmingham Research Portal (University of Birmingham) (submittedVersion, cc-by)
- Apollo (University of Cambridge) (submittedVersion, cc-by)
- Apollo (cc-by)
- Funders
- European Research Council (111608)
- BBSRC (BBS/E/B/000C0405)
- Topics
- Life Sciences › Biochemistry, Genetics and Molecular Biology › Molecular Biology › Genomics and Chromatin Dynamics
- Life Sciences › Biochemistry, Genetics and Molecular Biology › Genetics › Chromosomal and Genetic Variations
- Life Sciences › Biochemistry, Genetics and Molecular Biology › Genetics › Genomic variations and chromosomal abnormalities
- Keywords
- Hi-C, chromosome conformation capture, 3D genome organization, topologically associating domains, single-cell Hi-C
- MeSH terms
- Animals, Cell Nucleus, Cells, Cultured, Chromatin, Humans, Mice, Inbred C57BL, Genomics, Mice
About these checks
Registry, retraction, Cites and statistics results are computed, not judged, with one exception: a printed reference that no index lists is read once by a model before it counts as a citation error. Claims are extracted by a model and kept only when their quote appears verbatim in the text; each cited source is then checked, with a model’s help, for whether it says what the claim relies on. Those verdicts can be wrong — read the claim’s quote and the cited source before relying on one.
Statistics and arithmetic are recomputed, not judged.
Confidence bands are shown only for fields calibrated on our annotated test set. None is calibrated yet, so no band is shown.
What counts as a claim ›How we measure confidence ›How we check this ›
Are you an author, or do you see a problem with this page? Request a review
