

The DOI matches its Crossref record; 65 of the 66 references it cites were found in a registry or an index.
An integrated genetic-epigenetic analysis of schizophrenia: evidence for co-localization of genetic associations and differential DNA methylation
Open accessAbstract
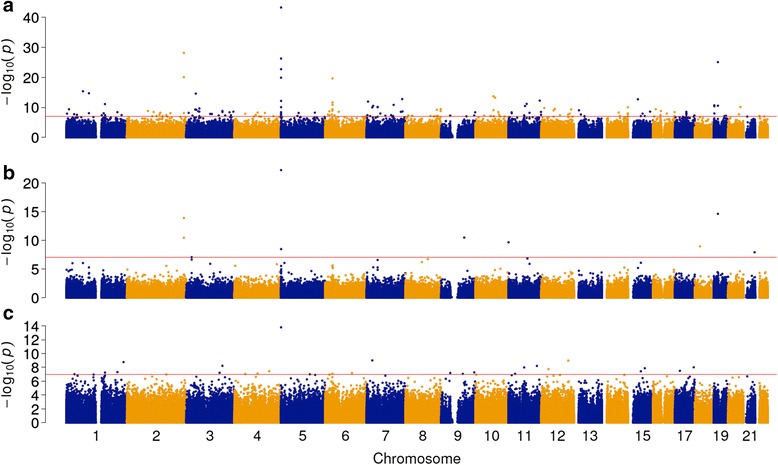
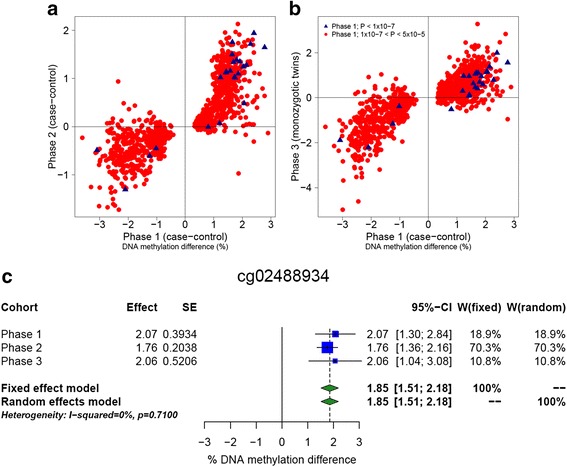
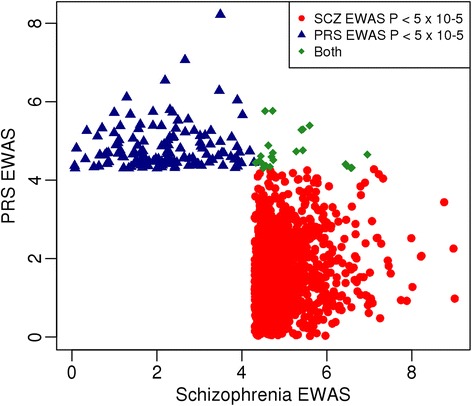
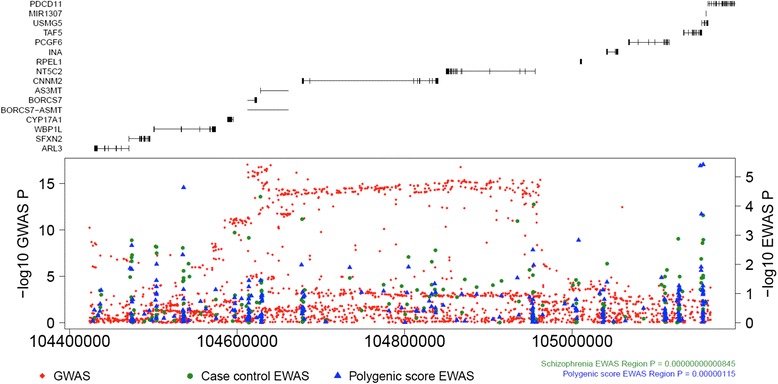
BACKGROUND: Schizophrenia is a highly heritable, neuropsychiatric disorder characterized by episodic psychosis and altered cognitive function. Despite success in identifying genetic variants associated with schizophrenia, there remains uncertainty about the causal genes involved in disease pathogenesis and how their function is regulated. RESULTS: We performed a multi-stage epigenome-wide association study, quantifying genome-wide patterns of DNA methylation in a total of 1714 individuals from three independent sample cohorts. We have identified multiple differentially methylated positions and regions consistently associated with schizophrenia across the three cohorts; these effects are independent of important confounders such as smoking. We also show that epigenetic variation at multiple loci across the genome contributes to the polygenic nature of schizophrenia. Finally, we show how DNA methylation quantitative trait loci in combination with Bayesian co-localization analyses can be used to annotate extended genomic regions nominated by studies of schizophrenia, and to identify potential regulatory variation causally involved in disease. CONCLUSIONS: This study represents the first systematic integrated analysis of genetic and epigenetic variation in schizophrenia, introducing a methodological approach that can be used to inform epigenome-wide association study analyses of other complex traits and diseases. We demonstrate the utility of using a polygenic risk score to identify molecular variation associated with etiological variation, and of using DNA methylation quantitative trait loci to refine the functional and regulatory variation associated with schizophrenia risk variants. Finally, we present strong evidence for the co-localization of genetic associations for schizophrenia and differential DNA methylation.
Overview
The claims and statistics of this paper haven’t been checked yet.
Run the check — free, no account needed. It reads the open-access text and checks the sources it cites.
Integrity signals
Registry
Cites
Statistics
Figures
Verification
Claims the paper makes
The claims and statistics of this paper haven’t been checked yet.
Run the check — free, no account needed. It reads the open-access text and checks the sources it cites.
Claims other papers make about this one
Each is checked against this paper’s own text: does it say what the citing paper says it does?
The source backs part of the claim, not all of it — or backs it for a different population, condition or comparison.
In the citing paper
“An EWAS by Montano et al. (Montano et al. 2016) found differences in DNAm in genes involved in T-cell development in the blood of SCZ patients (ZC3H12D, TCF3, and IKZF4); other EWAS have also reported an enrichment in the immune system pathway by differently methylated genes”
From Can epigenetics shine a light on the biological pathways underlying major mental disorders? (2022) · cites this paper as Hannon et al., 2016
Experimental — accuracy not yet measuredThe cited source says what the claim attributes to it.
In the citing paper
“The confounding effect of smoking is clearly evidenced in an EWAS study on peripheral blood of SCZ patients (Hannon et al., 2016).”
From Can epigenetics shine a light on the biological pathways underlying major mental disorders? (2022) · cites this paper as Hannon et al., 2016
Self-check
Percentages, sums and reported differences re-computed from the paper’s own numbers.
The self-check needs the paper’s full text.
Citations
Cites
PLINK: a tool set for whole-genome association and population-based linkage analyses.
Purcell, S., Neale, B., Todd-Brown, K., Thomas, L., Ferreira, M. A. R., Bender, D., Maller, J., Sklar, P., de Bakker, P. I. W., Daly, M. J., et al. (2007) · The American Journal of Human Genetics · doi:10.1086/519795 · Cited by 34,089
An integrated encyclopedia of DNA elements in the human genome
The ENCODE Project Consortium (2012) · Nature · doi:10.1038/nature11247 · Cited by 18,072
Biological insights from 108 schizophrenia-associated genetic loci
Schizophrenia Working Group of the Psychiatric Genomics Consortium (2014) · Nature · doi:10.1038/nature13595 · Cited by 7,577
Self-citationDNA methylation age of human tissues and cell types
Horvath, S. (2013) · Genome Biology · doi:10.1186/gb-2013-14-10-r115 · Cited by 7,075
Whiteford, H. A., Degenhardt, L., Rehm, J., Baxter, A. J., Ferrari, A. J., Erskine, H. E., Charlson, F. J., Norman, R. E., Flaxman, A. D., Johns, N., et al. (2013) · The Lancet · doi:10.1016/s0140-6736(13)61611-6 · Cited by 6,006
Common polygenic variation contributes to risk of schizophrenia and bipolar disorder
The International Schizophrenia Consortium (2009) · Nature · doi:10.1038/nature08185 · Cited by 4,821
Giambartolomei, C., Vukcevic, D., Schadt, E. E., Franke, L., Hingorani, A. D., Wallace, C., & Plagnol, V. (2014) · PLoS Genetics · doi:10.1371/journal.pgen.1004383 · Cited by 4,261
Systematic Localization of Common Disease-Associated Variation in Regulatory DNA
Maurano, M. T., Humbert, R., Rynes, E., Thurman, R. E., Haugen, E., Wang, H., Reynolds, A. P., Sandstrom, R., Qu, H., Brody, J., et al. (2012) · Science · doi:10.1126/science.1222794 · Cited by 3,716
DNA methylation arrays as surrogate measures of cell mixture distribution
Houseman, E. A., Accomando, W. P., Koestler, D. C., Christensen, B. C., Marsit, C. J., Nelson, H. H., Wiencke, J. K., & Kelsey, K. T. (2012) · BMC Bioinformatics · doi:10.1186/1471-2105-13-86 · Cited by 3,175
Mapping and analysis of chromatin state dynamics in nine human cell types
Ernst, J., Kheradpour, P., Mikkelsen, T. S., Shoresh, N., Ward, L. D., Epstein, C. B., Zhang, X., Wang, L., Issner, R., Coyne, M., et al. (2011) · Nature · doi:10.1038/nature09906 · Cited by 2,898
Cited by
Sorted by citations
Items 201–300 of 352
Zhang, J., Fan, Y., Zhou, J., Ma, T., Gao, K., Xu, M., Xiao, Y., & Zhu, Y. (2021) · Psychopharmacology · doi:10.1007/s00213-021-05968-8 · Cited by 9
DNA methylation of the KLK8 gene in depression symptomatology
Starnawska, A., Bukowski, L., Chernomorchenko, A., Elfving, B., Müller, H. K., van den Oord, E. J. C. G., Åberg, K. A., Guintivano, J., Grove, J., Mors, O. N., et al. (2021) · Clinical Epigenetics · doi:10.1186/s13148-021-01184-5 · Cited by 9
Girdhar, K., Rahman, S., Dong, P., Fullard, J. F., & Roussos, P. (2022) · Biological Psychiatry · doi:10.1016/j.biopsych.2022.04.018 · Cited by 9
Aytaç, H. M., Pehlıvan, S., Pehlıvan, M., & Oyacı, Y. (2022) · Irish Journal of Medical Science (1971 -) · doi:10.1007/s11845-022-03030-w · Cited by 9
Epigenetic studies of schizophrenia: current status and future directions
Migdalska‐Richards, A., & Mill, J. S. (2019) · Current Opinion in Behavioral Sciences · doi:10.1016/j.cobeha.2018.12.003 · Cited by 9
Self-citationIdentification of bovine CpG SNPs as potential targets for epigenetic regulation via DNA methylation
Maldonado, M. B. C., Neto, N. B. D. R., Nagamatsu, S. T., Carazzolle, M. F., Hoff, J. L., Whitacre, L. K., Schnabel, R. D., Behura, S. K., McKay, S., Taylor, J. F., et al. (2019) · PLoS ONE · doi:10.1371/journal.pone.0222329 · Cited by 9
Chen, J., Cao, H., Kaufmann, T., Westlye, L. T., Tost, H., Meyer‐Lindenberg, A., & Schwarz, E. (2020) · Schizophrenia Bulletin · doi:10.1093/schbul/sbaa047 · Cited by 9
Chiba, H., Kakuta, Y., Kinouchi, Y., Kawai, Y., Watanabe, K., Nagao, M., Naito, T., Onodera, M., Moroi, R., Kuroha, M., et al. (2019) · PLoS ONE · doi:10.1371/journal.pone.0212148 · Cited by 8
Conditional GWAS analysis identifies putative disorder-specific SNPs for psychiatric disordersPreprint
Byrne, E. M., Zhu, Z., Qi, T., Skene, N., Bryois, J., Pardiñas, A. F., Stahl, E. A., Smoller, J. W., Rietschel, M., Owen, M. J., et al. (2019) · bioRxiv (Cold Spring Harbor Laboratory) · doi:10.1101/592899 · Cited by 9
Why most Principal Component Analyses (PCA) in population genetic studies are wrongPreprint
Elhaik, E. (2021) · bioRxiv (Cold Spring Harbor Laboratory) · doi:10.1101/2021.04.11.439381 · Cited by 9
Grigoroiu‐Serbânescu, M., van der Veen, T., Bigdeli, T. B., Herms, S., Diaconu, C. C., Neagu, A. I., Bass, N. J., Thygesen, J. H., Forstner, A. J., Nöthen, M. M., et al. (2024) · Journal of Affective Disorders · doi:10.1016/j.jad.2024.04.066 · Cited by 8
Self-citationMendelian Randomization Reveals Causalities Between DNA Methylation and Schizophrenia
Wang, D., Li, D., Dang, X., Mu, C., Liu, C., Zeng, Y., Yuan, Y., Teng, Z., Li, Y., & Luo, X. (2025) · Biological Psychiatry · doi:10.1016/j.biopsych.2025.03.012 · Cited by 8
Liu, J., Chen, J., Perrone‐Bizzozero, N. I., & Calhoun, V. D. (2018) · Frontiers in Genetics · doi:10.3389/fgene.2018.00343 · Cited by 8
Mo, X., Zhang, Y.-H., & Lei, S. (2020) · Molecular Immunology · doi:10.1016/j.molimm.2020.12.021 · Cited by 8
Chen, X., Huang, N.-X., Cheng, Y.-J., Cai, Q., Tian, Y., Chen, X.-S., & Xiao, L. (2021) · Frontiers in Neuroscience · doi:10.3389/fnins.2021.659853 · Cited by 8
Altered DNA methylation of CYP2E1 gene in schizophrenia patients with tardive dyskinesia
Zhang, P., Li, Y., Wang, K., Huang, J., Su, B., Xu, C. D., Wang, Z., Tan, S., Yang, F., & Tan, Y. (2022) · BMC Medical Genomics · doi:10.1186/s12920-022-01404-8 · Cited by 8
Ruzicka, W. B., Subburaju, S., Coyle, J. T., & Benes, F. M. (2017) · Human Molecular Genetics · doi:10.1093/hmg/ddx395 · Cited by 8
Evaluation of chromatin accessibility in prefrontal cortex of schizophrenia cases and controls
Bryois, J., Garrett, M. E., Song, L., Safi, A., Giusti-Rodriguez, P., Johnson, G. D., Demur, A. B., Fullard, J. F., Roussos, P., Sklar, P., et al. (2017) · bioRxiv (Cold Spring Harbor Laboratory) · doi:10.1101/141986 · Cited by 7
Banerjee, N., Polushina, T. V., Bettella, F., Steen, V. M., Andreassen, O. A., & Hellard, S. L. (2018) · Schizophrenia Research · doi:10.1016/j.schres.2018.11.025 · Cited by 13
Role of different omics data in the diagnosis of schizophrenia disorder: A machine learning study
Varathan, A., Senthooran, S., & Jeyananthan, P. (2024) · Schizophrenia Research · doi:10.1016/j.schres.2024.07.026 · Cited by 7
Guo, X., Robertson, J. A., Aparicio, A., Seale, K., Chen, Q., Richmond, A., Du, Z., Sulaiman, M., Zheng, S., Ballestar, E., et al. (2025) · Advanced Science · doi:10.1002/advs.202505922 · Cited by 7
Cai, J., Xu, Y., Zhang, W., Ding, S., Sun, Y., Lyu, J., Duan, M., Liu, S., Huang, L., & Zhou, F. (2020) · Briefings in Bioinformatics · doi:10.1093/bib/bbaa253 · Cited by 6
Wang, Z., Zhu, Y., Ye, L., Li, Q., Guo, B., Zhao, H., Bao, X., Zhuo, Q., Yang, T., Li, Z., et al. (2020) · Schizophrenia · doi:10.1038/s41537-021-00159-y · Cited by 8
Hop, P. J., Zwamborn, R., Hannon, E., Shireby, G., Nabais, M. F., Walker, E., van Rheenen, W., van Vugt, J. V., Dekker, A. M., Westeneng, H., et al. (2021) · medRxiv · doi:10.1101/2021.03.12.21253115 · Cited by 9
Self-citationPolakkattil, B. K., Vellichirammal, N. N., Nair, I. V., Nair, C. M., & Banerjee, M. (2024) · Frontiers in Psychiatry · doi:10.3389/fpsyt.2024.1297760 · Cited by 6
Ohi, K., Fujikane, D., Takai, K., Kuramitsu, A., Muto, Y., Sugiyama, S., & Shioiri, T. (2024) · Psychiatry Research · doi:10.1016/j.psychres.2024.115984 · Cited by 8
Shirai, T., Okazaki, S., Tanifuji, T., Numata, S., Nakayama, T., Yoshida, T., Mouri, K., Otsuka, I., Hiroi, N., & Hishimoto, A. (2024) · Schizophrenia · doi:10.1038/s41537-024-00531-8 · Cited by 6
Алфимова, М. В., Kondratyev, N. V., Golov, A. K., & Голимбет, В. Е. (2020) · Scientific Reports · doi:10.1038/s41598-020-61671-2 · Cited by 6
A Comprehensive Evaluation of Cross-Omics Blood-Based Biomarkers for Neuropsychiatric Disorders
Song, W., Wang, W., Liu, Z., Cai, W., Yu, S., Zhao, M., & Lin, G. N. (2021) · Journal of Personalized Medicine · doi:10.3390/jpm11121247 · Cited by 7
Washer, S. J., Flynn, R. J., Oguro‐Ando, A., Hannon, E. J., Burrage, J., Jeffries, A. R., Mill, J. S., & Dempster, E. L. (2022) · American Journal of Medical Genetics Part B Neuropsychiatric Genetics · doi:10.1002/ajmg.b.32905 · Cited by 7
Self-citationMap of epigenetic age acceleration: a worldwide meta-analysisPreprint
Yusipov, I., Kalyakulina, A., Franceschi, C., & Ivanchenko, M. (2024) · bioRxiv (Cold Spring Harbor Laboratory) · doi:10.1101/2024.03.17.585398 · Cited by 6
ComputAgeBench: Epigenetic Aging Clocks BenchmarkPreprint
Kriukov, D. V., Efimov, E., Kuzmina, E., Dudkovskaia, A., Khrameeva, E. E., & Dylov, D. V. (2024) · bioRxiv (Cold Spring Harbor Laboratory) · doi:10.1101/2024.06.06.597715 · Cited by 6
Borrego-Ruiz, A., & Borrego, J. J. (2025) · Children · doi:10.3390/children12081063 · Cited by 10
Intergenerational transmission of complex traits and the offspring methylome
Hagenbeek, F. A., Pool, R., Asselt, A. J. V., Ehli, E. A., Smit, A. B., Bartels, M., Hottenga, J., Dolan, C. V., van Dongen, J., & Boomsma, D. I. (2025) · Molecular Psychiatry · doi:10.1038/s41380-025-02981-7 · Cited by 6
Chagnon, Y. C., Maziade, M., Paccalet, T., Croteau, J., Fournier, A., Roy, M., & Bureau, A. (2019) · European Journal of Human Genetics · doi:10.1038/s41431-019-0526-y · Cited by 6
Sun, R., Weng, H., Men, R., Xia, X., Chong, K. C., Wu, W. K. K., Zee, B. C.-Y., & Wang, M. H. (2018) · BMC Proceedings · doi:10.1186/s12919-018-0143-8 · Cited by 5
Reisinger, S. N., & Hannan, A. J. (2025) · Nature Mental Health · doi:10.1038/s44220-025-00495-3 · Cited by 5
Schuurmans, I. K., Smajlagić, D., Baltramonaityte, V., Malmberg, A., Neumann, A., Creasey, N., Felix, J. F., Tiemeier, H. W., Pingault, J., Czamara, D., et al. (2025) · Biological Psychiatry · doi:10.1016/j.biopsych.2025.09.005 · Cited by 6
Guidelines on optimizing DNA methylation reference panels for cell-type deconvolution
Guo, X., & Teschendorff, A. E. (2026) · Communications Biology · doi:10.1038/s42003-026-09745-1 · Cited by 4
Khodasevich, D., Holland, N., van der Laan, L. W. P., & Cárdenas, A. (2025) · PLoS Computational Biology · doi:10.1371/journal.pcbi.1012768 · Cited by 4
Thong, L. Y., McRae, A. F., Sirota, M., Giudice, L. C., Montgomery, G. W., & Mortlock, S. (2025) · International Journal of Molecular Sciences · doi:10.3390/ijms26083760 · Cited by 5
Mendoza-García, S., García‐Mieres, H., López‐Carrilero, R., Sevilla‐Llewellyn‐Jones, J., Birulés, I., Barajas, A., Lorente‐Rovira, E., Gutiérrez‐Zotes, A., Grasa, E., Pousa, E., et al. (2022) · Journal of Personalized Medicine · doi:10.3390/jpm12101732 · Cited by 4
Brinkman, H. R., Kowalchyk, M. L., Cahn, L., Aaronson, C. J., Böttche, M., Presseau, C., Markowitz, J. C., Litz, B. T., Huckins, L. M., Yehuda, R., et al. (2021) · International Journal of Clinical Trials · doi:10.18203/2349-3259.ijct20212843 · Cited by 4
Hyper-Coordinated DNA Methylation is Altered in Schizophrenia and Associated with Brain Function
Chen, J., Schwarz, K., Zang, Z., Braun, U., Harneit, A., Kremer, T. L., Ma, R., Schweiger, J. I., Moessnang, C., Geiger, L. S., et al. (2021) · Schizophrenia Bulletin Open · doi:10.1093/schizbullopen/sgab036 · Cited by 4
Barbu, M. C., Harris, M. A., Shen, X., Stolicyn, A., Green, C., Amador, C., Walker, R. M., Morris, S. W., Adams, M. J., Sandu, A., et al. (2021) · Epigenetics · doi:10.1080/15592294.2021.1997404 · Cited by 4
Xu, K., Li, S., Pandey, P., Kang, A. Y., Morimoto, L. M., Mancuso, N., Ma, X., Metayer, C., Wiemels, J. L., & de Smith, A. J. (2022) · Human Molecular Genetics · doi:10.1093/hmg/ddac137 · Cited by 4
Self-citationBouvette–Turcot, A., Meaney, M. J., & O’Donnell, K. J. (2018) · Child maltreatment solutions network · doi:10.1007/978-3-319-72589-5_7 · Cited by 4
Li, M., Duan, L., Cai, Y., Hao, B., Chen, J., & Liu, H. (2021) · Research Square · doi:10.21203/rs.3.rs-131293/v1 · Cited by 4
A new robust AI/ML based model for accurate forensic age estimation using DNA methylation markers
Mathew, J. A., Paul, G., Jacob, J., Kumar, J., Dubey, N., & Philip, N. S. (2025) · Forensic Science Medicine and Pathology · doi:10.1007/s12024-025-00985-x · Cited by 6
Stavrum, A.-K., Sirignano, L., Frid, L. M., Frank, J., Foo, J. C., Spíndola, L., Höffler, K. D., Oedegaard, K. J., Haavik, J., Rietschel, M., et al. (2025) · Translational Psychiatry · doi:10.1038/s41398-025-03772-y · Cited by 3
Singh, M., Dolan, C. V., Lapato, D. M., Hottenga, J., Pool, R., Verhulst, B., Boomsma, D. I., Breeze, C. E., de Geus, E. J. C., Hemani, G., et al. (2025) · European Journal of Epidemiology · doi:10.1007/s10654-024-01187-5 · Cited by 3
Unico: a unified model for cell-type resolution genomics from heterogeneous omics data
Chen, Z. J., Rahmani, E., & Halperin, E. (2025) · Genome biology · doi:10.1186/s13059-025-03776-3 · Cited by 2
Pyrosequencing analysis of IRS1 methylation levels in schizophrenia with tardive dyskinesia
Li, Y., Wang, K., Zhang, P., Huang, J., Liu, Y., Wang, Z., Lu, Y., Tan, S., Yang, F., & Tan, Y. (2020) · Molecular Medicine Reports · doi:10.3892/mmr.2020.10984 · Cited by 3
Genome-Wide Screening Identifies DNA Methylation Sites that Regulate the Blood Proteome
Nikpay, M., Ravati, S., & McPherson, R. (2022) · Epigenomics · doi:10.2217/epi-2022-0119 · Cited by 3
Nikpay, M. (2023) · Epigenomes · doi:10.3390/epigenomes7030019 · Cited by 2
Glial changes in schizophrenia
Ramos-Rosales, D. F., Vázquez-Alaníz, F., Norma, E., Madai, M.-H. E., & Marcelo, B. (2022) · Indian Journal of Psychiatry · doi:10.4103/indianjpsychiatry.indianjpsychiatry_104_21 · Cited by 3
Epigenome-Wide Association Studies in Psychiatry: Achievements and Problems
Bassil, K. C., Ali, N., Pishva, E., & van den Hove, D. (2022) · Springer eBooks · doi:10.1007/978-3-030-94475-9_18 · Cited by 3
Genome-wide DNA methylation analysis in schizophrenia with tardive dyskinesia: a preliminary study
Zhang, P., Lu, Y., Li, Y., Wang, K., An, H., & Tan, Y. (2023) · Genes & Genomics · doi:10.1007/s13258-023-01414-5 · Cited by 2
Schizophrenia’s gene expression defies clarity: Insights from postmortem brain data
Amjad, E., & Sokouti, B. (2025) · Medical Hypotheses · doi:10.1016/j.mehy.2025.111684 · Cited by 2
David, F. S., Frank, J., Stein, F., Meinert, S., Zillich, L., Sirignano, L., Streit, F., Beins, E. C., Sindermann, L., Usemann, P. L., et al. (2025) · Comprehensive Psychiatry · doi:10.1016/j.comppsych.2025.152629 · Cited by 2
Synergistic blood-based diagnostic value of AP3B1 and BMPR2 in Parkinson’s disease
Zhao, X., Li, Y., Luan, Y., Ding, T., Yang, X., Geng, X., Zhang, T., Pan, J., Xiao, Z., Pan, W., et al. (2025) · npj Parkinson s Disease · doi:10.1038/s41531-025-01134-5 · Cited by 2
Tang, H., Chen, S., Liu, Y., Xu, S., Yang, H., Li, Z., He, Y., Liao, Y., Chen, X., Liu, C., et al. (2024) · American Journal of Medical Genetics Part B Neuropsychiatric Genetics · doi:10.1002/ajmg.b.33005 · Cited by 2
Ota, V., Spíndola, L., Stavrum, A.-K., Costa, G. O., Bugiga, A., Noto, M. N., Carvalho, C. M., Lee, S. H., Lokmer, A., Goud, A. C., et al. (2025) · Progress in Neuro-Psychopharmacology and Biological Psychiatry · doi:10.1016/j.pnpbp.2025.111402 · Cited by 2
Self-citationDonskov, J. G. (2021) · Journal of Translational Genetics and Genomics · doi:10.20517/jtgg.2021.12 · Cited by 2
Epigenetic epidemiology of psychiatric disorders
Dahrendorff, J., & Uddin, M. (2021) · Elsevier eBooks · doi:10.1016/b978-0-12-823577-5.00031-3 · Cited by 2
Peedicayil, J. (2023) · Elsevier eBooks · doi:10.1016/b978-0-12-823937-7.00016-x · Cited by 2
Hu, M., Xia, Y., Zong, X., Sweeney, J. A., Bishop, J. R., Liao, Y., Giase, G. M., Li, B., Rubin, L. H., Wang, Y., et al. (2020) · bioRxiv (Cold Spring Harbor Laboratory) · doi:10.1101/2020.03.31.018283 · Cited by 2
Liu, Y., Lang, B., Smith, R. C., Wang, G., Wang, J., Liu, Y., Jin, H., Lyu, H., Davis, J. M., Guidotti, A. R., et al. (2021) · SSRN Electronic Journal · doi:10.1101/2021.02.07.430160 · Cited by 2
Gunasekara, C. J., MacKay, H., Scott, C., Li, S.-B., Laritsky, E., Baker, M. S., Grimm, S., Jun, G., Li, Y.-M., Chen, R., et al. (2022) · bioRxiv · doi:10.1101/2022.05.27.493722
The Role of Epigenetics in the Developmental Origins of Health and Disease
Michels, K. B., Gunasekara, C. J., & Waterland, R. A. (2022) · Springer eBooks · doi:10.1007/978-3-030-94475-9_6 · Cited by 2
Ruiz-Arenas, C., Abarrategui, L., Hernández-Ferrer, C., Escribà-Montagut, X., Pelegrí-Sisó, D., Ryser-Welch, P., Vrijheid, M., Bustamante, M., Gražulevičienė, R., Lepeule, J., et al. (2023) · Epigenetics · doi:10.1080/15592294.2023.2230670 · Cited by 1
Yao, K., Thygesen, J. H., Lock, S. K., Pardiñas, A. F., Pritchard, A. L., Elbashir, I., Lodhi, A., Ahmad, Z.-U.-A., O’Donovan, M. C., Owen, M. J., et al. (2025) · Psychopharmacology · doi:10.1007/s00213-025-06912-w · Cited by 1
Self-citationPersonalized single-cell transcriptomics reveals molecular diversity in Alzheimer’s disease
Chandrashekar, P. B., Alatkar, S. A., Kalafut, N. C., Jin, T., Gupta, C., Burczak, R. C., Xiang, H., Liu, S., Li, A. Z., Hong, A., et al. (2026) · Nature Communications · doi:10.1038/s41467-026-72310-1 · Cited by 2
van Dongen, J., & Boomsma, D. I. (2019) · doi:10.1093/oso/9780198793014.003.0004 · Cited by 1
Translational medicine in psychiatry: challenges and imaging biomarkers
Meyer‐Lindenberg, A., Tost, H., & Schwarz, E. (2021) · Elsevier eBooks · doi:10.1016/b978-0-12-820493-1.00004-0 · Cited by 1
DNA Methyltransferases and Schizophrenia: Current Status
Maroju, P. A., & Mohan, K. N. (2021) · IntechOpen eBooks · doi:10.5772/intechopen.98567 · Cited by 1
Discordant monozygotic twin studies of epigenetic mechanisms in mental health
van Dongen, J., Odintsova, V. V., & Boomsma, D. I. (2021) · Elsevier eBooks · doi:10.1016/b978-0-12-820951-6.00003-x · Cited by 1
Weksberg, R., Butcher, D. T., Cytrynbaum, C. S., Siu, M. T., Choufani, S., & Tycko, B. (2019) · Elsevier eBooks · doi:10.1016/b978-0-12-812537-3.00005-6 · Cited by 1
Nikpay, M. (2024) · Epigenomes · doi:10.3390/epigenomes8030029 · Cited by 1
Almodóvar-Payá, C., París-Gómez, I., Latorre-Guardia, M., Guardiola-Ripoll, M., Catalán, R., Arias, B., Penadés, R., & Fatjó‐Vilas, M. (2024) · Progress in Neuro-Psychopharmacology and Biological Psychiatry · doi:10.1016/j.pnpbp.2024.111175 · Cited by 1
Hu, X., Li, M., Wang, L., Li, X., Wu, F., & Wang, J. (2019) · IEEE International Conference on Bioinformatics and Biomedicine (BIBM) · doi:10.1109/bibm47256.2019.8983308 · Cited by 1
Hannon, E. J., Dempster, E. L., Mansell, G., Burrage, J., Bass, N. J., Bohlken, M. M., Corvin, A. P., Curtis, C. J. C., Dempster, D. W., Forta, M. D., et al. (2020) · bioRxiv (Cold Spring Harbor Laboratory) · doi:10.1101/2020.04.05.026211 · Cited by 1
Self-citationShen, X., Caramaschi, D., Adams, M. J., Walker, R. M., Min, J. L., Kwong, A. S. F., Hemani, G., Barbu, M. C., Whalley, H. C., Harris, S. E., et al. (2021) · medRxiv · doi:10.1101/2021.06.30.21259731 · Cited by 1
Marttila, S., Tamminen, H., Rajić, S., Mishra, P. P., Lehtimäki, T. J., Raitakari, O. T., Kähönen, M. A. P., Kananen, L., Jylhävä, J., Hägg, S., et al. (2022) · bioRxiv (Cold Spring Harbor Laboratory) · doi:10.1101/2022.06.21.496995 · Cited by 1
Sportelli, L., Eisenberg, D. P., Passiatore, R., D’Ambrosio, E., Antonucci, L. A., Chen, Q., Czarapata, J., Goldman, A. L., Gregory, M. A., Griffiths, K., et al. (2023) · bioRxiv (Cold Spring Harbor Laboratory) · doi:10.1101/2023.09.20.558594 · Cited by 1
Reply to: Genetic differentiation at probe SNPs leads to spurious results in meQTL discovery
Cheng, Y., Li, B., Zhang, X., Aouizerat, B. E., Zhao, H., & Xu, K. (2023) · Communications Biology · doi:10.1038/s42003-023-05646-9 · Cited by 1
Schuurmans, I. K., Smajlagić, D., Baltramonaityte, V., Malmberg, A., Neumann, A., Creasey, N., Felix, J. F., Tiemeier, H. W., Pingault, J., Czamara, D., et al. (2024) · medRxiv · doi:10.1101/2024.07.01.24309384 · Cited by 2
Personalized Single-cell Transcriptomics Reveals Molecular Diversity in Alzheimer’s DiseasePreprint
Chandrashekar, P. B., Alatkar, S. A., Kalafut, N. C., Jin, T., Gupta, C., Burzak, R., Huang, X., Liu, S., Li, A. Z., Girdhar, K., et al. (2024) · medRxiv · doi:10.1101/2024.11.01.24316589 · Cited by 1
Bekkhus, M., Tsotsi, S., Page, C. M., Czajkowski, N. O., Liu, W., Røysamb, E., Bang, N. R., Oftedal, A., Lyle, R., Hannigan, L. J., et al. (2025) · medRxiv · doi:10.1101/2025.05.24.25328240 · Cited by 1
He, J., Cabrera‐Mendoza, B., Qiu, D., Davtian, D., Mao, Z., Chen, Q., Penichet, E. N., Zhang, Q., Karaca, Ş., & Polimanti, R. A. (2025) · medRxiv · doi:10.64898/2025.12.15.25342298 · Cited by 1
A molecular analysis of 22q11.2 deletion syndrome
Salaka, A. S. (2017) · ORCA Online Research @Cardiff (Cardiff University)
The role of blood-based biomarkers in advancing personalized therapy of schizophrenia
Chen, J., & Schwarz, E. (2017) · Expert Review of Precision Medicine and Drug Development · doi:10.1080/23808993.2017.1400906
Gerring, Z. F. (2017) · Queensland University of Technology · doi:10.5204/thesis.eprints.112796
Functional analysis of evolutionary human methylated regions in schizophrenia patientsPreprint
Banerjee, N., Polushina, T. V., Stavrum, A.-K., Steen, V. M., & Hellard, S. L. (2019) · bioRxiv (Cold Spring Harbor Laboratory) · doi:10.1101/540294
Statistical Inference for the Investigation of Cell-Type Heterogeneity in DNA Methylation Data
Kennedy, D. W. (1905) · Queensland University of Technology · doi:10.5204/thesis.eprints.128080
Jones, H. J., Zammit, S., & Walters, J. (2020) · Elsevier eBooks · doi:10.1016/b978-0-12-813201-2.00010-7
Li, J., Wang, L., Dang, X., Feng, W., Wang, Z., Ma, Y.-T., He, S., Liang, L., Yang, H., Liu, H., et al. (2020) · medRxiv · doi:10.1101/2020.06.26.20140541
Circadian Hallmarks of the Aging Epigenome
Ebrahimi, S. B. (2017) · TSpace (University of Toronto)
Campagnoli, G. M., Cantão, I. H., Marins, M. M., Mendes, A. R., Nogueira, B., Martin, R., Pesquero, J. B., & Stumpp, T. (2020) · doi:10.21203/rs.3.rs-118724/v1
Metadata
- Authors
- Hannon, E., Dempster, E., Viana, J., Burrage, J., Smith, A. R., Macdonald, R., St Clair, D., Mustard, C., Breen, G., Therman, S., Kaprio, J., Toulopoulou, T., Pol, H. E. H., Bohlken, M. M., Kahn, R. S., Nenadic, I., Hultman, C. M., Murray, R. M., Collier, D. A., Bass, N., Gurling, H., McQuillin, A., Schalkwyk, L., & Mill, J.
- Affiliations
- University of Exeter (GB)
- University of the Highlands and Islands (GB)
- King's College London (GB)
- Finnish Institute for Health and Welfare (FI)
- University of Helsinki (FI)
- University of Hong Kong (HK)
- University Medical Center Utrecht (NL)
- Karolinska Institutet (SE)
- University College London (GB)
- University of Essex (GB)
- Corresponding author
- Mill, Jonathan
- ORCID
- Venue
- Genome Biology
- Published
- 2016-08-30
- Volume
- 17
- Issue
- 1
- Pages
- 176-176
- ISSN
- 1465-6906 (ISSN-L)
- 1474-760X
- PMC
- PMC5004279
- OpenAlex
- W2510420694
- Cited by
- 349
- References
- 66
- Citations by year
- 2026: 8 · 2025: 29 · 2024: 39 · 2023: 32 · 2022: 40 · 2021: 54 · 2020: 39 · 2019: 37 · 2018: 45 · 2017: 21 · 2016: 3
- FWCI
- 18.54
- Type
- journal article
- Language
- en
- Open access
- gold
- doi.org
- Locations
- Genome biology (publishedVersion, cc-by)
- PubMed Central (publishedVersion, cc-by)
- PubMed (publishedVersion)
- Open Access at Essex (University of Essex) (acceptedVersion)
- Minerva Access (University of Melbourne) (submittedVersion, cc-by)
- Research Portal (King's College London) (submittedVersion, cc-by)
- Aberdeen University Research Archive (Aberdeen University) (submittedVersion)
- Työväentutkimus Vuosikirja (submittedVersion, other-oa)
- Open Research Exeter (University of Exeter) (submittedVersion, cc-by)
- Royal Devon and Exeter Research Repository (Royal Devon and Exeter) (submittedVersion)
- Utrecht University Repository (Utrecht University) (submittedVersion, other-oa)
- Funders
- Medical Research Council (MR/K013807/1)
- National Institutes of Health (R01 AG036039, R01 MH52857)
- Suomen Akatemia (213506, 129680, 265240, 263278)
- Karolinska Institutet (ALF 20090183, ALF 20100305)
- Topics
- Life Sciences › Biochemistry, Genetics and Molecular Biology › Molecular Biology › Epigenetics and DNA Methylation
- Health Sciences › Medicine › Psychiatry and Mental health › Schizophrenia research and treatment
- Life Sciences › Biochemistry, Genetics and Molecular Biology › Genetics › Genetic Associations and Epidemiology
- Keywords
- schizophrenia, DNA methylation, epigenome-wide association study, differentially methylated regions, DNA methylation quantitative trait loci, polygenic risk score, genetic risk variants, gene expression regulation
- MeSH terms
- Bayes Theorem, Humans, Phenotype, Schizophrenia, Twins, Monozygotic, CpG Islands, DNA Methylation, Multifactorial Inheritance, Quantitative Trait Loci, Genome-Wide Association Study, Epigenomics
About these checks
Registry, retraction, Cites and statistics results are computed, not judged, with one exception: a printed reference that no index lists is read once by a model before it counts as a citation error. Claims are extracted by a model and kept only when their quote appears verbatim in the text; each cited source is then checked, with a model’s help, for whether it says what the claim relies on. Those verdicts can be wrong — read the claim’s quote and the cited source before relying on one.
Statistics and arithmetic are recomputed, not judged.
Confidence bands are shown only for fields calibrated on our annotated test set. None is calibrated yet, so no band is shown.
What counts as a claim ›How we measure confidence ›How we check this ›
Are you an author, or do you see a problem with this page? Request a review
