

The DOI matches its Crossref record; 41 of the 41 references it cites were found in a registry or an index.
Evaluation of in silico algorithms for use with ACMG/AMP clinical variant interpretation guidelines
Open accessPublished version of a preprint
Abstract
BACKGROUND: The American College of Medical Genetics and American College of Pathologists (ACMG/AMP) variant classification guidelines for clinical reporting are widely used in diagnostic laboratories for variant interpretation. The ACMG/AMP guidelines recommend complete concordance of predictions among all in silico algorithms used without specifying the number or types of algorithms. The subjective nature of this recommendation contributes to discordance of variant classification among clinical laboratories and prevents definitive classification of variants. RESULTS: Using 14,819 benign or pathogenic missense variants from the ClinVar database, we compared performance of 25 algorithms across datasets differing in distinct biological and technical variables. There was wide variability in concordance among different combinations of algorithms with particularly low concordance for benign variants. We also identify a previously unreported source of error in variant interpretation (false concordance) where concordant in silico predictions are opposite to the evidence provided by other sources. We identified recently developed algorithms with high predictive power and robust to variables such as disease mechanism, gene constraint, and mode of inheritance, although poorer performing algorithms are more frequently used based on review of the clinical genetics literature (2011-2017). CONCLUSIONS: Our analyses identify algorithms with high performance characteristics independent of underlying disease mechanisms. We describe combinations of algorithms with increased concordance that should improve in silico algorithm usage during assessment of clinically relevant variants using the ACMG/AMP guidelines.
Overview
The claims and statistics of this paper haven’t been checked yet.
Run the check — free, no account needed. It reads the open-access text and checks the sources it cites.
Integrity signals
Registry
Cites
Statistics
Figures
Verification
Claims the paper makes
The claims and statistics of this paper haven’t been checked yet.
Run the check — free, no account needed. It reads the open-access text and checks the sources it cites.
Claims other papers make about this one
Each is checked against this paper’s own text: does it say what the citing paper says it does?
The source backs part of the claim, not all of it — or backs it for a different population, condition or comparison.
In the citing paper
“However, score intervals defined by tool developers, and ACMG/AMP recommendations that require the consensus of multiple predictors, lack quantitative support.”
From Calibration of computational tools for missense variant pathogenicity classification and ClinGen recommendations for PP3/BP4 criteria (2022) · cites this paper as [3]
Experimental — accuracy not yet measuredThe cited source says what the claim attributes to it.
In the citing paper
“These fractions were considerably larger than 4.41%, our estimate of the prior probability of pathogenicity (prevalence of pathogenic variants) in the gnomAD set, suggesting a high false positive rate with respect to PP3, in agreement with previous studies.3”
From Calibration of computational tools for missense variant pathogenicity classification and ClinGen recommendations for PP3/BP4 criteria (2022) · cites this paper as [3]
The cited source says what the claim attributes to it.
In the citing paper
“Several studies have attempted to benchmark methods to identify tools and tool-threshold combinations that are the most accurate and appropriate for clinically relevant variants.3,38,39,40,41”
From Calibration of computational tools for missense variant pathogenicity classification and ClinGen recommendations for PP3/BP4 criteria (2022) · cites this paper as [3]
Self-check
Percentages, sums and reported differences re-computed from the paper’s own numbers.
The self-check needs the paper’s full text.
Citations
Cites
Richards, S., Aziz, N., Bale, S., Bick, D., Das, S., Gastier-Foster, J., Grody, W. W., Hegde, M., Lyon, E., Spector, E., et al. (2015) · Genetics in Medicine · doi:10.1038/gim.2015.30 · Cited by 32,594
A method and server for predicting damaging missense mutations.
Adzhubei, I. A., Schmidt, S., Peshkin, L., Ramensky, V. E., Gerasimova, A., Bork, P., Kondrashov, A. S., & Sunyaev, S. R. (2010) · Nature Methods · doi:10.1038/nmeth0410-248 · Cited by 13,194
Analysis of protein-coding genetic variation in 60,706 humans
Exome Aggregation Consortium, Lek, M., Karczewski, K. J., Minikel, E. V., Samocha, K. E., Banks, E., Fennell, T., O’Donnell-Luria, A. H., Ware, J. S., Hill, A. J., et al. (2016) · Nature · doi:10.1038/nature19057 · Cited by 9,587
Shrestha, S., & Offer, S. M. (2016) · Medical Epigenetics · doi:10.1159/000444713 · Cited by 8,951
The Ensembl Variant Effect Predictor
McLaren, W., Gil, L., Hunt, S. E., Riat, H. S., Ritchie, G. R. S., Thormann, A., Flicek, P., & Cunningham, F. (2016) · Genome Biology · doi:10.1186/s13059-016-0974-4 · Cited by 8,099
Vogelstein, B., Papadopoulos, N., Velculescu, V. E., Zhou, S., Diaz, L. A., & Kinzler, K. W. (2013) · Science · doi:10.1126/science.1235122 · Cited by 7,863
SIFT: predicting amino acid changes that affect protein function
Ng, P. C. (2003) · Nucleic Acids Research · doi:10.1093/nar/gkg509 · Cited by 6,601
A general framework for estimating the relative pathogenicity of human genetic variants
Kircher, M., Witten, D. M., Jain, P., O'Roak, B. J., Cooper, G. M., & Shendure, J. (2014) · Nature Genetics · doi:10.1038/ng.2892 · Cited by 6,183
Evolutionarily conserved elements in vertebrate, insect, worm, and yeast genomes
Siepel, A., Bejerano, G., Pedersen, J. S., Hinrichs, A. S., Hou, M., Rosenbloom, K., Clawson, H., Spieth, J., Hillier, L. W., Richards, S., et al. (2005) · Genome Research · doi:10.1101/gr.3715005 · Cited by 3,971 · cited 1×
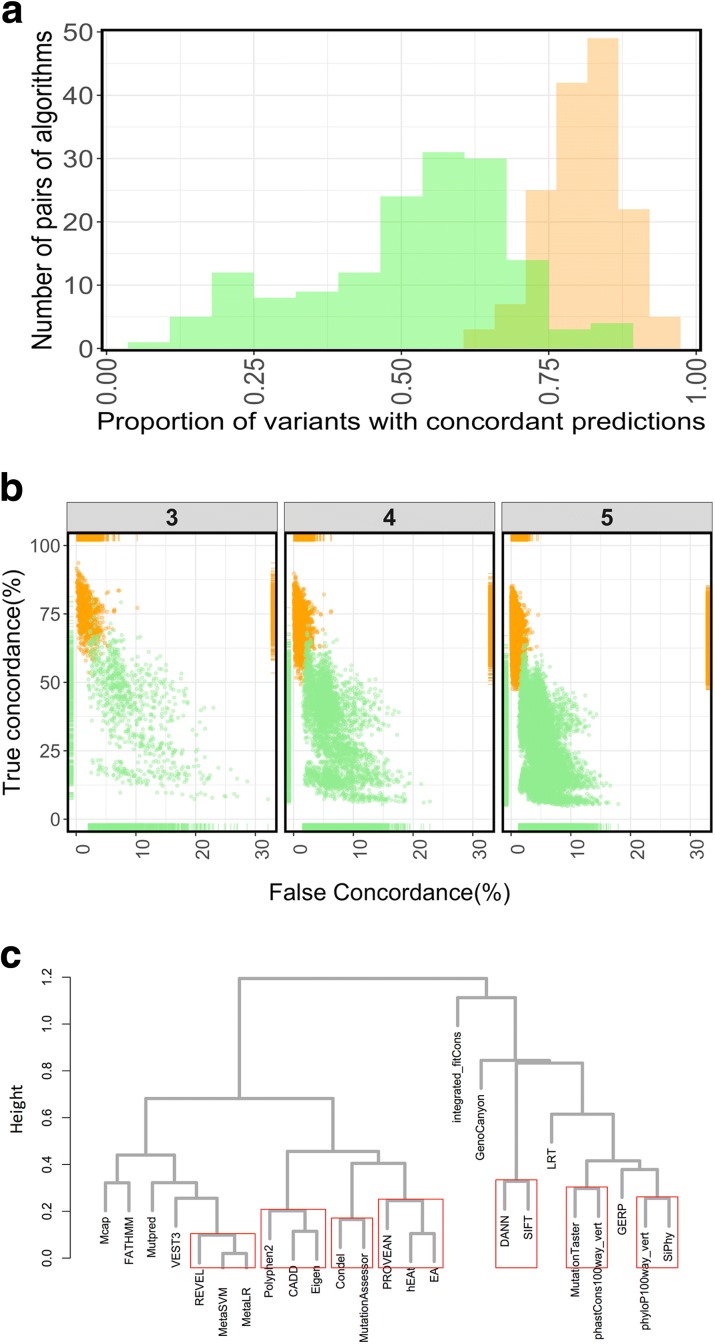
“All the largely evolutionary conservation algorithms such as phyloP [25], phastCons [26], GERP [27], and Siphy [28] belong to different clusters from the metapredictors REVEL, MetaSVM, and MetaLR (Fig.”
MethodMutationTaster evaluates disease-causing potential of sequence alterations
Schwarz, J. M., Rödelsperger, C., Schuelke, M., & Seelow, D. (2010) · Nature Methods · doi:10.1038/nmeth0810-575 · Cited by 2,975
Cited by
Sorted by citations
Items 101–200 of 234
Tamana, S., Xenophontos, M., Minaidou, A., Stephanou, C., Harteveld, C. L., Bento, C., Traeger‐Synodinos, J., Fylaktou, I., Yasin, N. M., Hamid, F. S. A., et al. (2022) · eLife · doi:10.7554/elife.79713 · Cited by 15
Wang, Y., Liu, X., Zuo, X., Wang, C., Zhang, Z., Zhang, H., Zeng, T., Chen, S., Liu, M., Chen, H., et al. (2024) · Cell Genomics · doi:10.1016/j.xgen.2024.100550 · Cited by 14
Clinical Bioinformatics in Precise Diagnosis of Mitochondrial Disease
Shen, L., McCormick, E. M., Muraresku, C. C., Falk, M. J., & Gai, X. (2020) · Clinics in Laboratory Medicine · doi:10.1016/j.cll.2020.02.002 · Cited by 15
D’Alterio, G., Lasorsa, V. A., Bonfiglio, F., Cantalupo, S., Rosato, B. E., Andolfo, I., Russo, R., Esposito, U., Frisso, G., Abete, P., et al. (2022) · Genetics in Medicine · doi:10.1016/j.gim.2022.04.007 · Cited by 14
de la Morena‐Barrio, B., Jochmans, K., de la Morena‐Barrio, M. E., Orlando, C., Pareyn, I., Vanhoorelbeke, K., Martínez‐Martínez, I., Vicente, V., & Corral, J. (2020) · Thrombosis and Haemostasis · doi:10.1055/s-0040-1716531 · Cited by 12
Alenezi, W. M., Milano, L., Fierheller, C. T., Serruya, C., Revil, T., Oros, K. K., Behl, S., Arcand, S. L., Nayar, P., Spiegelman, D., et al. (2022) · Cancers · doi:10.3390/cancers14092251 · Cited by 12
The utility of genomic testing in the ophthalmology clinic: A review
Burdon, K. P. (2021) · Clinical and Experimental Ophthalmology · doi:10.1111/ceo.13970 · Cited by 12
Wang, M., Lee-Kim, V. S., Atri, D. S., Elowe, N. H., Yu, J., Garvie, C. W., Won, H., Hadaya, J. E., MacDonald, B. T., Trindade, K., et al. (2021) · Circulation Genomic and Precision Medicine · doi:10.1161/circgen.121.003399 · Cited by 12
Alenezi, W. M., Fierheller, C. T., Serruya, C., Revil, T., Oros, K. K., Subramanian, D., Bruce, J. P., Spiegelman, D., Pugh, T. J., Campbell, I., et al. (2023) · Frontiers in Oncology · doi:10.3389/fonc.2023.1111191 · Cited by 11
CHASMplus reveals the scope of somatic missense mutations driving human cancersPreprint
Tokheim, C., & Karchin, R. (2018) · bioRxiv (Cold Spring Harbor Laboratory) · doi:10.1101/313296 · Cited by 14
Quaio, C. R. D. C., Ceroni, J. R. M., Pereira, M. A., Teixeira, A. C. B., Yamada, R. Y., Cintra, V. P., Perrone, E., Silva, M. D. F. B., Chen, K., Minillo, R. M., et al. (2023) · Human Genomics · doi:10.1186/s40246-023-00549-6 · Cited by 11
Goldstein, J., Thomas‐Wilson, A., Groopman, E., Aggarwal, V. S., Bianconi, S. E., Fernandez, R., Hart, K., Longo, N., Liang, N., Reich, D. S., et al. (2024) · Molecular Genetics and Metabolism · doi:10.1016/j.ymgme.2024.108362 · Cited by 12
Ponińska, J. K., Bilińska, Z. T., Truszkowska, G. T., Michalak, E., Podgórska, A., Stępień‐Wojno, M., Chmielewski, P., Lutyńska, A., & Płoski, R. (2022) · Journal of Translational Medicine · doi:10.1186/s12967-022-03251-8 · Cited by 11
Molecular Genetic Characteristics of FANCI, a Proposed New Ovarian Cancer Predisposing Gene
Fierheller, C. T., Alenezi, W. M., Serruya, C., Revil, T., Amuzu, S., Bédard, K., Subramanian, D., Fewings, E., Bruce, J. P., Prokopec, S. D., et al. (2023) · Genes · doi:10.3390/genes14020277 · Cited by 9
Application of ACMG criteria to classify variants in the human gene mutation database
Qu, H., Wang, X., Tian, L., & Hakonarson, H. H. (2019) · Journal of Human Genetics · doi:10.1038/s10038-019-0663-8 · Cited by 10
Machine learning models for accurate prioritization of variants of uncertain significance
Mahecha, D., Núñez, H., Lattig, M. C., & Duitama, J. (2022) · Human Mutation · doi:10.1002/humu.24339 · Cited by 10
Multiplexed functional genomic assays to decipher the noncoding genome
Cooper, Y. A., Guo, Q., & Geschwind, D. H. (2022) · Human Molecular Genetics · doi:10.1093/hmg/ddac194 · Cited by 10
Katsonis, P., & Lichtarge, O. (2025) · Nature Communications · doi:10.1038/s41467-024-55066-4 · Cited by 11
Data-driven modelling of mutational hotspots and in silico predictors in hypertrophic cardiomyopathy
Waring, A., Harper, A. R., Salatino, S., Kramer, C. M., Neubauer, S., Thomson, K. L., Watkins, H. C., & Farrall, M. (2020) · Journal of Medical Genetics · doi:10.1136/jmedgenet-2020-106922 · Cited by 10
Ndugga-Kabuye, M. K., Maleszewski, J. J., Chanprasert, S., & Smith, K. D. (2019) · BMJ Case Reports · doi:10.1136/bcr-2019-230068 · Cited by 9
Sallah, S. R., Ellingford, J. M., Sergouniotis, P. I., Ramsden, S., Lench, N., Lovell, S. C., & Black, G. C. M. (2021) · Journal of Medical Genetics · doi:10.1136/jmedgenet-2020-107404 · Cited by 9
Domené, S., Scaglia, P. A., Gutiérrez, M., & Domené, H. M. (2021) · Cells · doi:10.3390/cells10082063 · Cited by 9
Rein, H. L., & Bernstein, K. A. (2023) · DNA repair · doi:10.1016/j.dnarep.2023.103563 · Cited by 10
Molecular Autopsy for Sudden Cardiac Death: Current State and Considerations
Orland, K. M., & Anderson, K. B. (2019) · Current Genetic Medicine Reports · doi:10.1007/s40142-019-00170-x · Cited by 8
The computational approach to variant interpretation
Özkan, S., Padilla, N., Moles‐Fernández, A., Dı́ez, O., Gutiérrez‐Enríquez, S., & de la Cruz, X. (2021) · Elsevier eBooks · doi:10.1016/b978-0-12-820519-8.00007-7 · Cited by 7
Alenezi, W. M., Fierheller, C. T., Revil, T., Serruya, C., Mes‐Masson, A., Foulkes, W. D., Provencher, D. M., Haffaf, Z. E., Ragoussis, J., & Tonin, P. N. (2022) · Genes · doi:10.3390/genes13040697 · Cited by 8
Congenital disorders of glycosylation and the challenge of rare diseases
Gilfix, B. M. (2019) · Human Mutation · doi:10.1002/humu.23829 · Cited by 8
Alfayyadh, M. M., Maksemous, N., Sutherland, H. G. E., Lea, R. A., & Griffiths, L. R. (2024) · Clinical Genetics · doi:10.1111/cge.14625 · Cited by 7
Tarnovskaya, S. I., Kostareva, A. A., & Zhorov, B. S. (2021) · Membranes · doi:10.3390/membranes11080599 · Cited by 7
In silico analysis of TRPM4 variants of unknown clinical significance
Tarnovskaya, S. I., Kostareva, A. A., & Zhorov, B. S. (2023) · PLoS ONE · doi:10.1371/journal.pone.0295974 · Cited by 7
Muniz, J. R. C., Szeto, N. W.-S., Frise, R., Lee, W. H., Wang, X.-S., Thöny, B., Himmelreich, N., Blau, N., Hsiao, K., Liu, T.-T., et al. (2019) · Pathology · doi:10.1016/j.pathol.2018.11.011 · Cited by 7
Moltrasio, C., de Moura, R. R., Brandão, L. A. C., Tricarico, P. M., Suleman, M., Maronese, C. A., Crovella, S., & Marzano, A. V. (2025) · Journal of Investigative Dermatology · doi:10.1016/j.jid.2025.01.029 · Cited by 6
Current progress in CRISPR-Cas systems for rare diseases
Israr, J., & Kumar, A. (2024) · Progress in molecular biology and translational science · doi:10.1016/bs.pmbts.2024.07.019 · Cited by 7
Petrazzini, B. O., Balick, D. J., Forrest, I. S., Cho, J. H., Rocheleau, G., Jordan, D. M., & Do, R. (2024) · Cell Reports Methods · doi:10.1016/j.crmeth.2024.100914 · Cited by 10
Bellè, F., Mercatanti, A., Lodovichi, S., Congregati, C., Guglielmi, C., Tancredi, M., Caligo, M. A., Cervelli, T., & Galli, A. (2022) · International Journal of Molecular Sciences · doi:10.3390/ijms23074049 · Cited by 6
Accurate assignment of disease liability to genetic variants using only population data
Collaco, J. M., Raraigh, K. S., Betz, J., Aksit, M. A., Blau, N., Brown, J., Dietz, H. C., MacCarrick, G. L., Nogee, L. M., Sheridan, M. B., et al. (2021) · Genetics in Medicine · doi:10.1016/j.gim.2021.08.012 · Cited by 6
Ferreira, J. R., Pereira, J. P., Botelho, A. P. A., Aprijo, D. N., Melo, M. M., Rey, H. C. V., & Dias, G. M. (2024) · Scientific Reports · doi:10.1038/s41598-024-78788-3 · Cited by 5
Prioritizing disease-associated missense variants with chemoproteomic-detected amino acids
Palafox, M. F., Boatner, L. M., Wilde, B. R., Christofk, H. R., Backus, K. M., & Arboleda, V. A. (2025) · The American Journal of Human Genetics · doi:10.1016/j.ajhg.2025.04.017 · Cited by 6
Islam, N. N., Coban, M., Fuller, J. M., Weber, C., Chitale, R. A., Jussila, B., Brock, T., Tao, C., & Caulfield, T. R. (2025) · Communications Biology · doi:10.1038/s42003-025-08334-y · Cited by 5
Cox, S. N., Giudice, C. L., Lavecchia, A., Poeta, M. L., Chiara, M., Picardi, E., & Pesole, G. (2024) · Biomolecules · doi:10.3390/biom14040411 · Cited by 5
Potential Involvement of NSD1, KRT24 and ACACA in the Genetic Predisposition to Colorectal Cancer
Quintana, I., Mur, P., Terradas, M., García‐Mulero, S., Aiza, G., Navarro, M., Piñol, V., Brunet, J., Moreno, V. R., Pamplona, R. S., et al. (2022) · Cancers · doi:10.3390/cancers14030699 · Cited by 5
Kumaran, M., & Devarajan, B. (2023) · Genetics in Medicine · doi:10.1016/j.gim.2023.100862 · Cited by 5
Prediction of Kv11.1 potassium channel PAS-domain variants trafficking via machine learning
Immadisetty, K., Fang, X., Ramon, G. S., Hartle, C. M., McCoy, T. P., Center, R. G., Mirshahi, T., Delisle, B. P., & Kekenes-Huskey, P. M. (2023) · Journal of Molecular and Cellular Cardiology · doi:10.1016/j.yjmcc.2023.05.002 · Cited by 5
Schott, C., Colaiacovo, S., Baker, C., Weir, M. A., & Connaughton, D. M. (2024) · Canadian Journal of Kidney Health and Disease · doi:10.1177/20543581241242562 · Cited by 5
van der Velde, K. J., van den Hoek, S., van Dijk, F., Hendriksen, D., van Diemen, C. C., Johansson, L. F., Abbott, K. M., Deelen, P., Sikkema‐Raddatz, B., & Swertz, M. A. (2020) · Advanced Genetics · doi:10.1002/ggn2.10023 · Cited by 4
Maassen, W. T. K., Johansson, L. F., Charbon, B., Hendriksen, D., van den Hoek, S., Slofstra, M. K., Mulder, R., Meems-Veldhuis, M. T., Sietsma, R., Lemmink, H. H., et al. (2024) · medRxiv · doi:10.1101/2024.04.11.24305656 · Cited by 5
Çapan, Ö. Y. (2025) · Journal of Molecular Neuroscience · doi:10.1007/s12031-024-02299-z · Cited by 4
Januel, L., Chatron, N., Rivier-Ringenbach, C., Cabet, S., Labalme, A., Şahin, Y., Darvish, H., Kruer, M. C., Bakhtiari, S., Sanlaville, D., et al. (2023) · European Journal of Medical Genetics · doi:10.1016/j.ejmg.2023.104893 · Cited by 4
Kováčová, M., Hlaváč, V., Koževnikovová, R., Rauš, K., Gatěk, J., & Souček, P. (2024) · Oncology · doi:10.1159/000540395 · Cited by 4
Genetische Diagnostik autoinflammatorischer Erkrankungen
Schnappauf, O. (2020) · Zeitschrift für Rheumatologie · doi:10.1007/s00393-020-00847-7 · Cited by 4
Invertebrate Model Organisms as a Platform to Investigate Rare Human Neurological Diseases
Lee, J. (2022) · Experimental Neurobiology · doi:10.5607/en22003 · Cited by 4
Applications for Deep Learning in Epilepsy Genetic Research
Zeibich, R., Kwan, P., O'Brien, T. J., Perucca, P., Ge, Z., & Anderson, A. (2023) · International Journal of Molecular Sciences · doi:10.3390/ijms241914645 · Cited by 4
The genetic architecture of Parkinson’s disease on the Island of Crete
Boura, I., Sait, S., Marinakis, N. M., Kumar, A., Chia, R., Ray, A., Vatsellas, G., Loupis, T., Pavlaki, V., Makrythanasis, P., et al. (2025) · npj Parkinson s Disease · doi:10.1038/s41531-025-01192-9 · Cited by 2
Mróz, J., Pelc, M., Mitusińska, K., Chorostowska‐Wynimko, J., & Jezela‐Stanek, A. (2024) · Genes · doi:10.3390/genes15030340 · Cited by 3
Das, S. K., Patel, V., Chakravarty, S., Ghosh, A., Mukhopadhyay, A., & Biswas, N. K. (2025) · BioData Mining · doi:10.1186/s13040-024-00420-x · Cited by 6
Yang, S.-A., Salazar, J. L., Li‐Kroeger, D., & Yamamoto, S. (2022) · Methods in molecular biology · doi:10.1007/978-1-0716-2201-8_19 · Cited by 4
Prediction of recessive inheritance for missense variants in human diseasePreprint
Petrazzini, B. O., Balick, D. J., Forrest, I. S., Cho, J. H., Rocheleau, G., Jordan, D. M., & Do, R. (2021) · medRxiv · doi:10.1101/2021.10.25.21265472 · Cited by 3
Hummadi, A. A., Mutawwam, D. A., Banaganapalli, B., Alsubhi, F., Aljohani, N. J., Alhagawy, A. J., Algohani, T., Fallatah, I., Daghriri, M., Alharbi, R., et al. (2025) · Frontiers in Genetics · doi:10.3389/fgene.2025.1679594 · Cited by 2
Comparison of missing data handling methods for variant pathogenicity predictors
Särkkä, M., Myöhänen, S., Marinov, K., Saarinen, I., Lahti, L., Fortino, V., & Paananen, J. (2025) · NAR Genomics and Bioinformatics · doi:10.1093/nargab/lqaf133 · Cited by 2
AllelePred: A Simple Allele Frequencies Ensemble Predictor for Different Single Nucleotide Variants
Sobahy, T. M., Motwalli, O., & Alazmi, M. (2022) · IEEE Transactions on Computational Biology and Bioinformatics · doi:10.1109/tcbb.2022.3155659 · Cited by 2
Bug, D. S., Наркевич, А. Н., Тишков, А., & Petukhova, N. V. (2025) · Сибирский журнал клинической и экспериментальной медицины · doi:10.29001/2073-8552-2025-40-1-226-234 · Cited by 2
Nfonsam, L. E., Ordorica, S., Ghani, M., Potter, R., Schaffer, A., Daoud, H., Vasli, N., Chisholm, C., Sinclair‐Bourque, E., McGowan‐Jordan, J., et al. (2018) · Journal of Medical Genetics · doi:10.1136/jmedgenet-2018-105443 · Cited by 2
Garrote, J. A. B., Alonso, A., Blanco, J., Rojo, E., Orriols, J. J. T., Torres, M. Á., & Uribe, F. (2019) · Neurobiology of Aging · doi:10.1016/j.neurobiolaging.2019.05.012 · Cited by 2
Mourtzi, N., Sertedaki, A., Markou, Α., Piaditis, G. P., Katsanis, N., Traeger‐Synodinos, J., Tsigos, C., & Charmandari, E. (2022) · HORMONES · doi:10.1007/s42000-022-00394-7 · Cited by 3
Suiter, C. C., Moriyama, T., Matreyek, K. A., Yang, W., Scaletti, E. R., Nishii, R., Yang, W., Hoshitsuki, K., Singh, M., Trehan, A., et al. (2019) · bioRxiv (Cold Spring Harbor Laboratory) · doi:10.1101/740837 · Cited by 2
Comparison of missing data handling methods for variant pathogenicity predictorsPreprint
Särkkä, M., Myöhänen, S., Marinov, K., Saarinen, I., Lahti, L., Fortino, V., & Paananen, J. (2022) · bioRxiv (Cold Spring Harbor Laboratory) · doi:10.1101/2022.06.17.496578 · Cited by 2
Milano, L., Alenezi, W. M., Fierheller, C. T., Serruya, C., Revil, T., Oros, K. K., Bruce, J. P., Spiegelman, D., Pugh, T. J., Mes‐Masson, A., et al. (2023) · medRxiv · doi:10.1101/2023.07.03.23290133 · Cited by 2
Multi-ancestry Whole-exome Sequencing Study of Alcohol Use Disorder in Two CohortsPreprint
Wang, L., Kranzler, H. R., Gelernter, J. E., & Zhou, H. (2024) · medRxiv · doi:10.1101/2024.04.05.24305412 · Cited by 2
Mok, J.-W., Gibson, S., Dostalik, H. A., & Yamamoto, S. (2025) · Genome Research · doi:10.1101/gr.278291.123 · Cited by 3
Yadav, K., & Prasad, A. (2025) · medRxiv · doi:10.1101/2025.08.30.25334747 · Cited by 2
Mitrotti, A., di Bari, I., Giliberti, M., Franzin, R., Conserva, F., Chiusolo, A., Gigante, M., Accetturo, M., Cafiero, C., Ricciato, L., et al. (2024) · International Journal of Molecular Sciences · doi:10.3390/ijms25031436 · Cited by 1
Identification of osteoporosis genes using family studies
Schembri, M., & Formosa, M. M. (2024) · Frontiers in Endocrinology · doi:10.3389/fendo.2024.1455689 · Cited by 1
Li, X., Zhang, Y., Chai, G., Su, W., & Zhang, Y. (2025) · Frontiers in Genetics · doi:10.3389/fgene.2025.1536000 · Cited by 1
Dai, G., Wang, P., & Wang, D. (2025) · Frontiers in Oncology · doi:10.3389/fonc.2025.1623700 · Cited by 1
Functional Screening of NDUFAF6 Variants in Knockout Cells and Complementary Computational Analysis
Jiang, F., Sugiura, A., Kishita, Y., Nakamura, K., Qi, X., Liu, Y., Murayama, K., & Okazaki, Y. (2025) · Journal of Clinical Laboratory Analysis · doi:10.1002/jcla.70147 · Cited by 1
Bug, D. S., Zhogolev, D., Tsvirko, K., Tcvetkov, N., Barkhatov, I., Наркевич, А. Н., Тишков, А., Morozova, Е. V., Petukhova, N. V., & Kulagin, A. (2025) · The Scientific Notes of the Pavlov University · doi:10.24884/1607-4181-2025-32-3-95-103 · Cited by 1
In Silico Functional and Structural Analysis of STAT4 Variants of Uncertain Significance
Bravo-Villagra, K. M., Maciel‐Cruz, E. J., Martínez-Contreras, R. M., Gutiérrez-Hurtado, I. A., Vizcaíno‐Quirarte, A. M., Muñóz-Valle, J. F., & López-Quintero, A. (2026) · Genes · doi:10.3390/genes17010072 · Cited by 1
López‐Novo, A., Amigo, J., Dacal, A., Remedios, D., Cubiella, J., Álvarez-Sánchez, M. V., Ladra-González, M. J., Fernández‐López, F., Álvarez-Castro, A., Carlés, S., et al. (2026) · European Journal of Human Genetics · doi:10.1038/s41431-025-02004-7 · Cited by 1
Milano, L., Alenezi, W. M., Fierheller, C. T., Serruya, C., Revil, T., Oros, K. K., Bruce, J. J., Spiegelman, D., Pugh, T. J., Mes‐Masson, A., et al. (2026) · International Journal of Molecular Sciences · doi:10.3390/ijms27021037 · Cited by 3
Bahmane, K., Bhattacharya, S., & Kassem, M. A. (2026) · Journal of Genome Biotechnology and Genetics · doi:10.3390/jgbg1010003 · Cited by 1
Functional evidence (II) protein and enzyme function
Monteiro, Á. N. A., Nepomuceno, T. C., de Wind, N., Fernandes, V. C., Elias, A. B. R., & Carvalho, M. A. (2021) · Elsevier eBooks · doi:10.1016/b978-0-12-820519-8.00014-4 · Cited by 1
Toncheva, D. I., Marinova, M., Chobanov, T., & Serbezov, D. (2023) · Genes · doi:10.3390/genes14030727 · Cited by 1
RetractedClinical relevance of genetic variants in the von Willebrand factor according to in‐silico methods
Woods, A. I., Primrose, D. M., Paiva, J., Blanco, A. N., Alberto, M. F., & Sánchez‐Luceros, A. (2023) · American Journal of Medical Genetics Part A · doi:10.1002/ajmg.a.63430 · Cited by 1
MVFormer: Predicting the pathogenicity of missense variants using gated transformers
Li, Z.-X., Huang, W.-K., & Li, H. (2024) · ACM International Conference on Bioinformatics, Computational Biology, and Health Informatics (ACM-BCB) · doi:10.1145/3698587.3701379 · Cited by 1
The Evolution of Constitutional Sequence Variant Interpretation
Mester, J. L., & Pesaran, T. F. (2020) · Clinics in Laboratory Medicine · doi:10.1016/j.cll.2020.02.005 · Cited by 1
Micheu, M. M., Oprescu, N., & Popa‐Fotea, N. (2021) · Romanian Journal of Cardiology · doi:10.47803/rjc.2021.31.3.565 · Cited by 1
Implementation of Exome Sequencing Assay
Chakravorty, S., Ankala, A., & Hegde, M. (2018) · Springer eBooks · doi:10.1007/978-3-319-96830-8_17 · Cited by 2
Ding, X., Singh, P., Schimenti, K. J., Tran, T. N., Fragoza, R., Hardy, J. J., Orwig, K. E., Kurpisz, M. K., Yatsenko, A. N., Conrad, D. F., et al. (2021) · bioRxiv (Cold Spring Harbor Laboratory) · doi:10.1101/2021.10.12.464112 · Cited by 1
Cannon, S., Williams, M., Gunning, A. C., & Wright, C. F. (2022) · medRxiv · doi:10.1101/2022.10.27.22281598 · Cited by 1
Assessment of Single Nucleotide Variants in hGPRC5A Gene Using in-silico ToolsPreprint
Karaali, M. D., Uz, E., & Çelikler, S. (2023) · Research Square · doi:10.21203/rs.3.rs-3576134/v1 · Cited by 1
Genetic variant pathogenicity prediction trained using disease-specific clinical sequencing datasetsPreprint
Evans, P., Wu, C., Lindy, A., McKnight, D. A., Lebo, M. S., Sarmady, M., & Tayoun, A. N. A. (2018) · bioRxiv (Cold Spring Harbor Laboratory) · doi:10.1101/334235
Accetturo, M., D’Uggento, A. M., Portincasa, P., & Stella, A. (2019) · bioRxiv (Cold Spring Harbor Laboratory) · doi:10.1101/532804
The Evolution of Constitutional Sequence Variant Interpretation
Mester, J. L., & Pesaran, T. F. (2019) · Advances in Molecular Pathology · doi:10.1016/j.yamp.2019.06.001
Assessing the Functional Properties of the TMCO1 Sequence Variants by Using In Silico Analyses
Pirim, D., Ulusoy, E., Kurt, Z. A., Kaya, N., & Uz, E. (2019) · Düzce Üniversitesi Bilim ve Teknoloji Dergisi · doi:10.29130/dubited.571528
Kováčová, M., Hlaváč, V., Brynychová, V., Václavíková, R., & Souček, P. (2019) · IEEE International Conference on Bioinformatics and Biomedicine (BIBM) · doi:10.1109/bibm47256.2019.8983216
Molecular Genetics of Cystic Fibrosis
Han, S. T., & Cutting, G. R. (2020) · Respiratory medicine · doi:10.1007/978-3-030-42382-7_23
Lanktree, M. B., Pei, Y., _, _., & Nicholls, K. (2020) · Nephrology Self-Assessment Program · doi:10.1681/nsap.2020.19.2.8
Functionalization of human gene variants In Drosophila
Ganguly, P. (2021) · cIRcle (University of British Columbia) · doi:10.14288/1.0401792
Metadata
- Authors
- Ghosh, R., Oak, N., & Plon, S. E.
- Affiliations
- Baylor College of Medicine (US)
- Venue
- Genome biology
- Published
- 2017-11-28
- Volume
- 18
- Issue
- 1
- Pages
- 225-225
- ISSN
- 1465-6906 (ISSN-L)
- 1474-760X
- PMC
- PMC5704597
- OpenAlex
- W2949886398
- Cited by
- 233
- References
- 41
- Citations by year
- 2026: 16 · 2025: 22 · 2024: 20 · 2023: 24 · 2022: 31 · 2021: 30 · 2020: 30 · 2019: 36 · 2018: 22 · 2017: 1
- FWCI
- 16.16
- Type
- journal article
- Language
- en
- Open access
- gold
- doi.org
- Locations
- Genome biology (publishedVersion, cc-by)
- bioRxiv (Cold Spring Harbor Laboratory) (acceptedVersion, cc-by)
- Europe PMC (PubMed Central) (publishedVersion, cc-by)
- PubMed Central (publishedVersion, cc-by)
- PubMed (publishedVersion)
- DOAJ (DOAJ: Directory of Open Access Journals) (submittedVersion)
- Funders
- National Human Genome Research Institute (5 U01 HG007436)
- Topics
- Life Sciences › Biochemistry, Genetics and Molecular Biology › Genetics › Genomics and Rare Diseases
- Life Sciences › Biochemistry, Genetics and Molecular Biology › Genetics › Genetic Associations and Epidemiology
- Life Sciences › Biochemistry, Genetics and Molecular Biology › Molecular Biology › Genomics and Phylogenetic Studies
- Keywords
- clinical variant interpretation, missense mutations, ClinVar, pathogenic variants, benign variants, disease mechanisms, mode of inheritance, algorithm comparison
- MeSH terms
- Algorithms, Humans, Software, Genetic Variation, Reproducibility of Results, Genome, Human, Guidelines as Topic, Computational Biology, Databases, Genetic, Genetic Association Studies
About these checks
Registry, retraction, Cites and statistics results are computed, not judged, with one exception: a printed reference that no index lists is read once by a model before it counts as a citation error. Claims are extracted by a model and kept only when their quote appears verbatim in the text; each cited source is then checked, with a model’s help, for whether it says what the claim relies on. Those verdicts can be wrong — read the claim’s quote and the cited source before relying on one.
Statistics and arithmetic are recomputed, not judged.
Confidence bands are shown only for fields calibrated on our annotated test set. None is calibrated yet, so no band is shown.
What counts as a claim ›How we measure confidence ›How we check this ›
Are you an author, or do you see a problem with this page? Request a review
