

The DOI matches its Crossref record; 5 of the 5 references it cites were found in a registry or an index.
scTAM-seq enables targeted high-confidence analysis of DNA methylation in single cells
Published version of a preprint
Abstract
Single-cell DNA methylation profiling currently suffers from excessive noise and/or limited cellular throughput. We developed scTAM-seq, a targeted bisulfite-free method for profiling up to 650 CpGs in up to 10,000 cells per experiment, with a dropout rate as low as 7%. We demonstrate that scTAM-seq can resolve DNA methylation dynamics across B-cell differentiation in blood and bone marrow, identifying intermediate differentiation states that were previously masked. scTAM-seq additionally queries surface-protein expression, thus enabling integration of single-cell DNA methylation information with cell atlas data. In summary, scTAM-seq is a high-throughput, high-confidence method for analyzing DNA methylation at single-CpG resolution across thousands of single cells.
Overview
The claims and statistics of this paper haven’t been checked yet.
Run the check — free, no account needed. It reads the open-access text and checks the sources it cites.
Integrity signals
Registry
Cites
Statistics
Figures
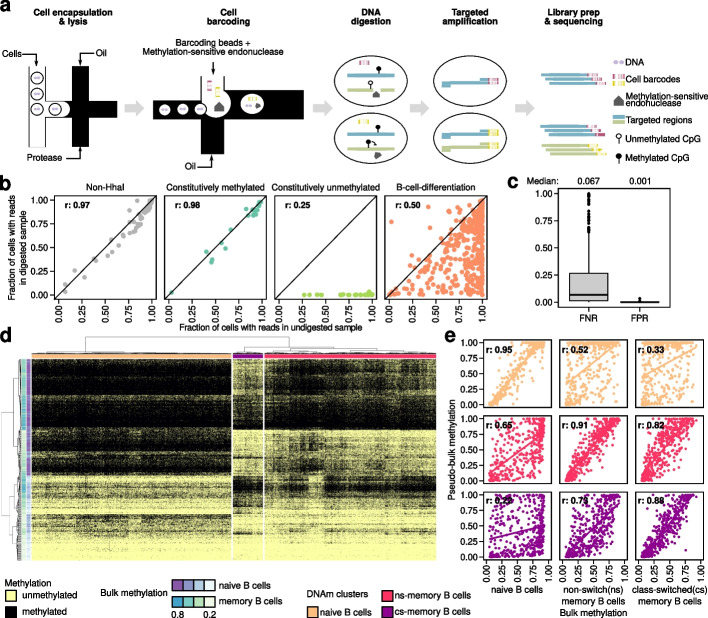
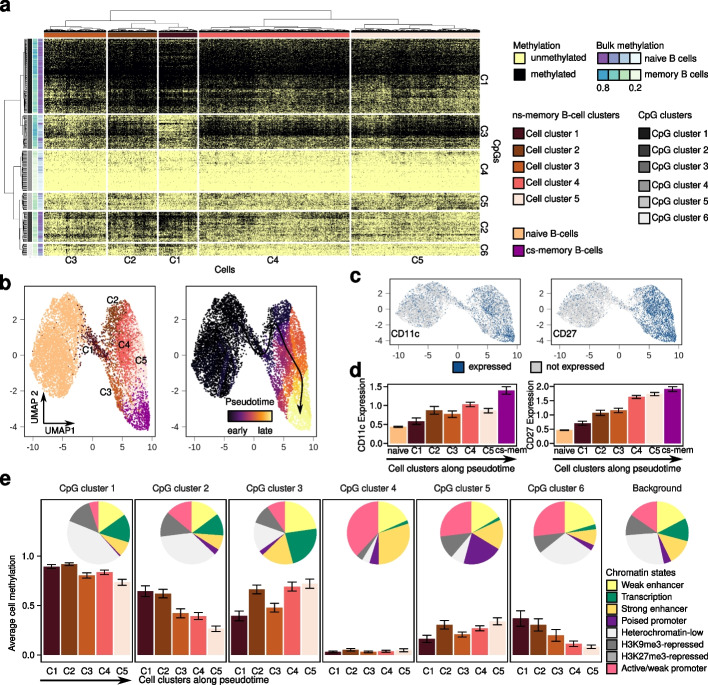
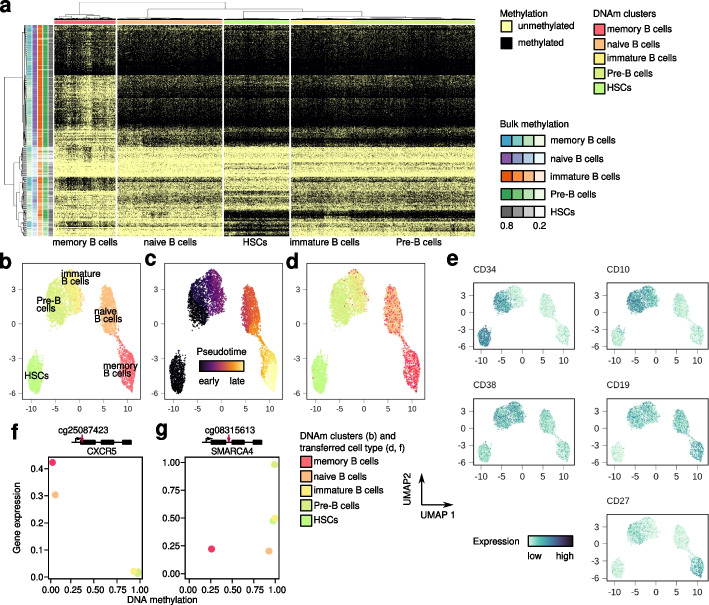
Verification
Claims the paper makes
The claims and statistics of this paper haven’t been checked yet.
Run the check — free, no account needed. It reads the open-access text and checks the sources it cites.
Claims other papers make about this one
Each is checked against this paper’s own text: does it say what the citing paper says it does?
In the citing paper
“We demonstrate that targeted single-cell profiling of DNA methylation5 at single-CpG resolution can accurately extract both layers of information.”
From Clonal tracing with somatic epimutations reveals dynamics of blood ageing (2025) · cites this paper as [5]
In the citing paper
“EPI-Clone builds on single-cell targeted analysis of the methylome (scTAM-seq), which is implemented on the Mission Bio Tapestri platform to read out methylation states of several hundred CpGs in thousands of single cells at a time, with a dropout rate of around 7%5.”
From Clonal tracing with somatic epimutations reveals dynamics of blood ageing (2025) · cites this paper as [5]
In the citing paper
“Sequencing reads can uniquely originate from amplicons with methylated CpGs, whereas the lack of sequencing reads from an amplicon originates either from an unmethylated CpG or from a dropout.”
From Clonal tracing with somatic epimutations reveals dynamics of blood ageing (2025) · cites this paper as [5]
Self-check
Percentages, sums and reported differences re-computed from the paper’s own numbers.
The self-check needs the paper’s full text.
Citations
Cites
Charting a dynamic DNA methylation landscape of the human genome
Ziller, M. J., Gu, H., Müller, F., Donaghey, J., Tsai, L. T.-Y., Kohlbacher, O., De Jager, P. L., Rosen, E. D., Bennett, D. A., Bernstein, B. E., et al. (2013) · Nature · doi:10.1038/nature12433 · Cited by 1,357
Single-cell methylomes identify neuronal subtypes and regulatory elements in mammalian cortex
Luo, C., Keown, C. L., Kurihara, L., Zhou, J., He, Y., Li, J., Castanon, R., Lucero, J., Nery, J. R., Sandoval, J. P., et al. (2017) · Science · doi:10.1126/science.aan3351 · Cited by 545
DNA methylation atlas of the mouse brain at single-cell resolution
Liu, H., Zhou, J., Tian, W., Luo, C., Bartlett, A., Aldridge, A., Lucero, J., Osteen, J. K., Nery, J. R., Chen, H., et al. (2021) · Nature · doi:10.1038/s41586-020-03182-8 · Cited by 289
Highly scalable generation of DNA methylation profiles in single cells
Mulqueen, R. M., Pokholok, D., Norberg, S. J., Torkenczy, K. A., Fields, A. J., Sun, D., Sinnamon, J. R., Shendure, J., Trapnell, C., O'Roak, B. J., et al. (2018) · Nature Biotechnology · doi:10.1038/nbt.4112 · Cited by 289
Robust single-cell DNA methylome profiling with snmC-seq2
Luo, C., Rivkin, A., Zhou, J., Sandoval, J. P., Kurihara, L., Lucero, J., Castanon, R., Nery, J. R., Pinto-Duarte, A., Bui, B., et al. (2018) · Nature Communications · doi:10.1038/s41467-018-06355-2 · Cited by 189
Research works printed but not linked: 35
- Smallwood SA, Lee HJ, Angermueller C, Krueger F, Saadeh H, Peat J, et al. Single-cell genome-wide bisulfite sequencing for assessing epigenetic heterogeneity. Nat Methods. 2014;11:817–20. · DOI · Paper page
- Guo H, Zhu P, Wu X, Li X, Wen L, Tang F. Single-cell methylome landscapes of mouse embryonic stem cells and early embryos analyzed using reduced representation bisulfite sequencing. Genome Res. 2013;23:2126–35. · DOI · Paper page
- Clark SJ, Argelaguet R, Kapourani C-A, Stubbs TM, Lee HJ, Alda-Catalinas C, et al. scNMT-seq enables joint profiling of chromatin accessibility DNA methylation and transcription in single cells. Nat Commun. 2018;9:781. · DOI · Paper page
- Hui T, Cao Q, Wegrzyn-Woltosz J, O’Neill K, Hammond CA, Knapp DJHF, et al. High-resolution single-cell DNA methylation measurements reveal epigenetically distinct hematopoietic stem cell subpopulations. Stem Cell Rep. 2018;11:578–92. · DOI · Paper page
- Durek P, Nordström K, Gasparoni G, Salhab A, Kressler C, de Almeida M, et al. Epigenomic profiling of human CD4+ T cells supports a linear differentiation model and highlights molecular regulators of memory development. Immunity. 2016;45:1148–61. · DOI
- Kulis M, Merkel A, Heath S, Queirós AC, Schuyler RP, Castellano G, et al. Whole-genome fingerprint of the DNA methylome during human B cell differentiation. Nat Genet. 2015;47:746–56. · DOI
- Stunnenberg HG, Abrignani S, Adams D, de Almeida M, Altucci L, Amin V, et al. The International Human Epigenome Consortium: a blueprint for scientific collaboration and discovery. Cell. 2016;167:1145–9. · DOI
- Scherer M, Nebel A, Franke A, Walter J, Lengauer T, Bock C, et al. Quantitative comparison of within-sample heterogeneity scores for DNA methylation data. Nucleic Acids Res. 2020;48:e46. · DOI
- Zhu P, Guo H, Ren Y, Hou Y, Dong J, Li R, et al. Single-cell DNA methylome sequencing of human preimplantation embryos. Nat Genet. 2018;50:12–9. · DOI
- Cheow LF, Quake SR, Burkholder WF, Messerschmidt DM. Multiplexed locus-specific analysis of DNA methylation in single cells. Nat Protoc. 2015;10:619–31. · DOI
- Cheow LF, Courtois ET, Tan Y, Viswanathan R, Xing Q, Tan RZ, et al. Single-cell multimodal profiling reveals cellular epigenetic heterogeneity. Nat Methods. 2016;13:833–6. · DOI
- Lorthongpanich C, Cheow LF, Balu S, Quake SR, Knowles BB, Burkholder WF, et al. Single-cell DNA-methylation analysis reveals epigenetic chimerism in preimplantation embryos. Science. 2013;341:1110–2. · DOI · Paper page
- Pellegrino M, Sciambi A, Treusch S, Durruthy-Durruthy R, Gokhale K, Jacob J, et al. High-throughput single-cell DNA sequencing of acute myeloid leukemia tumors with droplet microfluidics. Genome Res. 2018;28:1345–52. · DOI
- Miles LA, Bowman RL, Merlinsky TR, Csete IS, Ooi AT, Durruthy-Durruthy R, et al. Single-cell mutation analysis of clonal evolution in myeloid malignancies. Nature. 2020;587:477–82. · DOI · Paper page
- Stoeckius M, Hafemeister C, Stephenson W, Houck-Loomis B, Chattopadhyay PK, Swerdlow H, et al. Simultaneous epitope and transcriptome measurement in single cells. Nat Methods. 2017;14:865–8. · DOI · Paper page
- Triana S, Vonficht D, Jopp-Saile L, Raffel S, Lutz R, Leonce D, et al. Single-cell proteo-genomic reference maps of the hematopoietic system enable the purification and massive profiling of precisely defined cell states. Nat Immunol. 2021;22:1577–89. · DOI · Paper page
- Queirós AC, Beekman R, Vilarrasa-Blasi R, Duran-Ferrer M, Clot G, Merkel A, et al. Decoding the DNA methylome of mantle cell lymphoma in the light of the entire B cell lineage. Cancer Cell. 2016;30:806–21. · DOI
- Grimsholm O, Piano Mortari E, Davydov AN, Shugay M, Obraztsova AS, Bocci C, et al. The interplay between CD27dull and CD27bright B cells ensures the flexibility, stability, and resilience of human B cell memory. Cell Rep. 2020;30:2963–2977.e6. · DOI
- Carsetti R, Terreri S, Conti MG, Fernandez Salinas A, Corrente F, Capponi C, et al. Comprehensive phenotyping of human peripheral blood B lymphocytes in healthy conditions. Cytometry A. 2022;101:131–9. · DOI
- Beekman R, Chapaprieta V, Russiñol N, Vilarrasa-Blasi R, Verdaguer-Dot N, Martens JHA, et al. The reference epigenome and regulatory chromatin landscape of chronic lymphocytic leukemia. Nat Med. 2018;24:868–80. · DOI
- Duran-Ferrer M, Clot G, Nadeu F, Beekman R, Baumann T, Nordlund J, et al. The proliferative history shapes the DNA methylome of B-cell tumors and predicts clinical outcome. Nat Can. 2020;1:1066–81. · DOI
- Golinski M-L, Demeules M, Derambure C, Riou G, Maho-Vaillant M, Boyer O, et al. CD11c+ B cells are mainly memory cells, precursors of antibody secreting cells in healthy donors. Front Immunol. 2020;11:32. · DOI
- Karnell JL, Kumar V, Wang J, Wang S, Voynova E, Ettinger R. Role of CD11c + T-bet + B cells in human health and disease. Cell Immunol. 2017;321:40–5. · DOI
- Trapnell C, Cacchiarelli D, Grimsby J, Pokharel P, Li S, Morse M, et al. The dynamics and regulators of cell fate decisions are revealed by pseudotemporal ordering of single cells. Nat Biotechnol. 2014;32:381–6. · DOI · Paper page
- Roberts RJ, Vincze T, Posfai J, Macelis D. REBASE—a database for DNA restriction and modification: enzymes, genes and genomes. Nucleic Acids Res. 2015;43:D298–9. · DOI · Paper page
- Zou H, Hastie T. Regularization and variable selection via the elastic net. J R Stat Soc Ser B Stat Methodol. 2005;67:301–20. · DOI · Paper page
- Court F, Tayama C, Romanelli V, Martin-Trujillo A, Iglesias-Platas I, Okamura K, et al. Genome-wide parent-of-origin DNA methylation analysis reveals the intricacies of human imprinting and suggests a germline methylation-independent mechanism of establishment. Genome Res. 2014;24:554–69. · DOI
- Martin M. Cutadapt removes adapter sequences from high-throughput sequencing reads. EMBnet.journal. 2011;17:10. · DOI · Paper page
- Li H, Durbin R. Fast and accurate long-read alignment with Burrows–Wheeler transform. Bioinformatics. 2010;26:589–95. · DOI · Paper page
- Li H, Handsaker B, Wysoker A, Fennell T, Ruan J, Homer N, et al. The Sequence Alignment/Map format and SAMtools. Bioinformatics. 2009;25:2078–9. · DOI · Paper page
- Mölder F, Jablonski KP, Letcher B, Hall MB, Tomkins-Tinch CH, Sochat V, et al. Sustainable data analysis with Snakemake. F1000Research. 2021;10:33. · DOI · Paper page
- Satija R, Farrell JA, Gennert D, Schier AF, Regev A. Spatial reconstruction of single-cell gene expression data. Nat Biotechnol. 2015;33:495–502. · DOI · Paper page
- Stuart T, Srivastava A, Madad S, Lareau CA, Satija R. Single-cell chromatin state analysis with Signac. Nat Methods. 2021;18:1333–41. · DOI · Paper page
- Gu Z, Eils R, Schlesner M. Complex heatmaps reveal patterns and correlations in multidimensional genomic data. Bioinformatics. 2016;32:2847–9. · DOI
- Bianchi A., et al, scTAM-seq enables targeted high-confidence analysis of DNA methylation in single cells. GSE198019. Gene Expression Omnibus. 2022. https://www.ncbi.nlm.nih.gov/geo/query/acc.cgi?acc=GSE198019. · DOI
Cited by
Clonal tracing with somatic epimutations reveals dynamics of blood ageing
Scherer, M., Singh, I., Braun, M. M., Szu-Tu, C., Sanchez Sanchez, P., Lindenhofer, D., Jakobsen, N. A., Körber, V., Kardorff, M., Nitsch, L., et al. (2025) · Nature · doi:10.1038/s41586-025-09041-8 · Cited by 89
Self-citation
Metadata
- Authors
- Bianchi, A., Scherer, M., Zaurin, R., Quililan, K., Velten, L., & Beekman, R.
- Venue
- Genome Biology
- Published
- 2022-10-28
- Volume
- 23
- Issue
- 1
- ISSN
- 1474-760X
- PMC
- PMC9615163
- Cited by
- 36
- References
- 5
- Language
- en
- Funders
- Spanish Ministry of Science and Innovation (RTI2018-096359-A-I00, PRE2019-087574)
- European Hematology Association (Advanced research grant)
About these checks
Registry, retraction, Cites and statistics results are computed, not judged, with one exception: a printed reference that no index lists is read once by a model before it counts as a citation error. Claims are extracted by a model and kept only when their quote appears verbatim in the text; each cited source is then checked, with a model’s help, for whether it says what the claim relies on. Those verdicts can be wrong — read the claim’s quote and the cited source before relying on one.
Statistics and arithmetic are recomputed, not judged.
Confidence bands are shown only for fields calibrated on our annotated test set. None is calibrated yet, so no band is shown.
What counts as a claim ›How we measure confidence ›How we check this ›
Are you an author, or do you see a problem with this page? Request a review
