

The DOI matches its Crossref record; 10 of the 10 references it cites were found in a registry or an index.
High-Resolution Single-Cell DNA Methylation Measurements Reveal Epigenetically Distinct Hematopoietic Stem Cell Subpopulations
Overview
The claims and statistics of this paper haven’t been checked yet.
Run the check — free, no account needed. It reads the open-access text and checks the sources it cites.
Integrity signals
Registry
Cites
Statistics
Figures
Verification
Claims the paper makes
The claims and statistics of this paper haven’t been checked yet.
Run the check — free, no account needed. It reads the open-access text and checks the sources it cites.
Claims other papers make about this one
Each is checked against this paper’s own text: does it say what the citing paper says it does?
In the citing paper
“This map contains two orders of magnitude more cells than two previous, single-cell bisulfite sequencing datasets of the haematopoietic system28,29.”
From Clonal tracing with somatic epimutations reveals dynamics of blood ageing (2025) · cites this paper as [29]
Self-check
Percentages, sums and reported differences re-computed from the paper’s own numbers.
The self-check needs the paper’s full text.
Citations
Cites
DNA methylation age of human tissues and cell types
Horvath, S. (2013) · Genome Biology · doi:10.1186/gb-2013-14-10-r115 · Cited by 7,075
Integrative analysis of 111 reference human epigenomes
Roadmap Epigenomics Consortium, Kundaje, A., Meuleman, W., Ernst, J., Bilenky, M., Yen, A., Heravi-Moussavi, A., Kheradpour, P., Zhang, Z., Wang, J., et al. (2015) · Nature · doi:10.1038/nature14248 · Cited by 6,368 · cited 4×
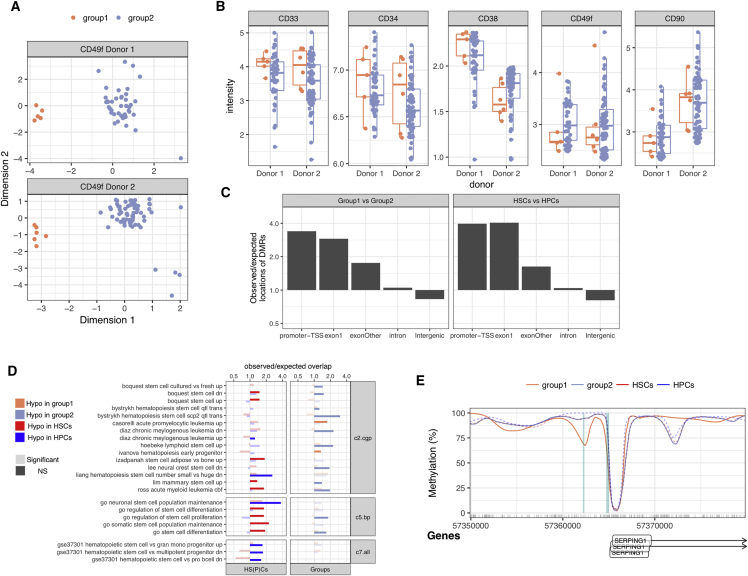
“DMRs were enriched in promoters (i.e., sequences between 2 kb upstream and 500 bp downstream of coding gene TSSs), depleted in intergenic regions, and highly enriched in evolutionarily conserved elements (Phastcon score [Siepel et al., 2005]; two-sided t test, p 0), suggesting that these DMRs have functional 586 Stem…”
BackgroundInfluentialSelf-citationEvolutionarily conserved elements in vertebrate, insect, worm, and yeast genomes
Siepel, A., Bejerano, G., Pedersen, J. S., Hinrichs, A. S., Hou, M., Rosenbloom, K., Clawson, H., Spieth, J., Hillier, L. W., Richards, S., et al. (2005) · Genome Research · doi:10.1101/gr.3715005 · Cited by 3,971
DNA-binding factors shape the mouse methylome at distal regulatory regions
Stadler, M. B., Murr, R., Burger, L., Ivanek, R., Lienert, F., Schöler, A., Nimwegen, E. V., Wirbelauer, C., Oakeley, E. J., Gaidatzis, D., et al. (2011) · Nature · doi:10.1038/nature10716 · Cited by 1,383
Impact of cytosine methylation on DNA binding specificities of human transcription factors
Yin, Y., Morgunova, E., Jolma, A., Kaasinen, E., Sahu, B., Khund-Sayeed, S., Das, P. K., Kivioja, T., Dave, K., Zhong, F., et al. (2017) · Science · doi:10.1126/science.aaj2239 · Cited by 1,257
Hou, Y., Guo, H., Cao, C., Li, X., Hu, B., Zhu, P., Wu, X., Wen, L., Tang, F., Huang, Y., et al. (2016) · Cell Research · doi:10.1038/cr.2016.23 · Cited by 647
Single-cell methylomes identify neuronal subtypes and regulatory elements in mammalian cortex
Luo, C., Keown, C. L., Kurihara, L., Zhou, J., He, Y., Li, J., Castanon, R., Lucero, J., Nery, J. R., Sandoval, J. P., et al. (2017) · Science · doi:10.1126/science.aan3351 · Cited by 545
Xie, W., Barr, C. L., Kim, A., Yue, F., Lee, A. Y., Eubanks, J., Dempster, E. L., & Ren, B. (2012) · Cell · doi:10.1016/j.cell.2011.12.035 · Cited by 543
DeepCpG: accurate prediction of single-cell DNA methylation states using deep learning
Angermueller, C., Lee, H. J., Reik, W., & Stegle, O. (2017) · Genome Biology · doi:10.1186/s13059-017-1189-z · Cited by 536
Wilson, N. K., Kent, D. G., Buettner, F., Shehata, M., Macaulay, I. C., Calero-Nieto, F. J., Sánchez Castillo, M., Oedekoven, C. A., Diamanti, E., Schulte, R., et al. (2015) · Cell Stem Cell · doi:10.1016/j.stem.2015.04.004 · Cited by 466
Research works printed but not linked: 52
- Angermueller, 2016, Parallel single-cell sequencing links transcriptional and epigenetic heterogeneity, Nat. Methods, 13, 229, 10.1038/nmeth.3728 · DOI · Paper page
- Banet, 2000, Characterization of human and mouse H19 regulatory sequences, Mol. Biol. Rep., 27, 157, 10.1023/A:1007139713781 · DOI
- Barturen, 2014, MethylExtract: high-Quality methylation maps and SNV calling from whole genome bisulfite sequencing data, Version 2. F1000Res., 2, 217, 10.12688/f1000research.2-217.v2 · DOI
- Benz, 2012, Hematopoietic stem cell subtypes expand differentially during development and display distinct lymphopoietic programs, Cell Stem Cell, 10, 273, 10.1016/j.stem.2012.02.007 · DOI
- Bock, 2012, DNA methylation dynamics during in vivo differentiation of blood and skin stem cells, Mol. Cell, 47, 633, 10.1016/j.molcel.2012.06.019 · DOI
- Boeva, 2012, Control-FREEC: a tool for assessing copy number and allelic content using next-generation sequencing data, Bioinformatics, 28, 423, 10.1093/bioinformatics/btr670 · DOI
- Bommarito, 2017, Effects of prenatal exposure to endocrine disruptors and toxic metals on the fetal epigenome, Epigenomics, 9, 333, 10.2217/epi-2016-0112 · DOI
- Brenet, 2011, DNA methylation of the first exon is tightly linked to transcriptional silencing, PLoS One, 6, e14524, 10.1371/journal.pone.0014524 · DOI
- Cabezas-Wallscheid, 2014, Identification of regulatory networks in HSCs and their immediate progeny via integrated proteome, transcriptome, and DNA methylome analysis, Cell Stem Cell, 15, 507, 10.1016/j.stem.2014.07.005 · DOI · Paper page
- Casorelli, 2006, Identification of a molecular signature for leukemic promyelocytes and their normal counterparts: focus on DNA repair genes, Leukemia, 20, 1978, 10.1038/sj.leu.2404376 · DOI
- Challen, 2012, Dnmt3a is essential for hematopoietic stem cell differentiation, Nat. Genet., 44, 23, 10.1038/ng.1009 · DOI · Paper page
- Doulatov, 2012, Hematopoiesis: a human perspective, Cell Stem Cell, 10, 120, 10.1016/j.stem.2012.01.006 · DOI · Paper page
- Dykstra, 2007, Long-term propagation of distinct hematopoietic differentiation programs in vivo, Cell Stem Cell, 1, 218, 10.1016/j.stem.2007.05.015 · DOI · Paper page
- Eaves, 2015, Hematopoietic stem cells: concepts, definitions, and the new reality, Blood, 125, 2605, 10.1182/blood-2014-12-570200 · DOI
- Eckhardt, 2006, DNA methylation profiling of human chromosomes 6, 20 and 22, Nat. Genet., 38, 1378, 10.1038/ng1909 · DOI
- Farlik, 2015, Single-cell DNA methylome sequencing and bioinformatic inference of epigenomic cell-state dynamics, Cell Rep., 10, 1386, 10.1016/j.celrep.2015.02.001 · DOI · Paper page
- Farlik, 2016, DNA methylation dynamics of human hematopoietic stem cell differentiation, Cell Stem Cell, 19, 808, 10.1016/j.stem.2016.10.019 · DOI · Paper page
- Fürst, 2012, A differentially methylated single CpG-site is correlated with estrogen receptor alpha transcription, J. Steroid Biochem. Mol. Biol., 130, 96, 10.1016/j.jsbmb.2012.01.009 · DOI
- Gascard, 2015, Epigenetic and transcriptional determinants of the human breast, Nat. Commun., 6, 6351, 10.1038/ncomms7351 · DOI
- Gertz, 2011, Analysis of DNA methylation in a three-generation family reveals widespread genetic influence on epigenetic regulation, PLoS Genet., 7, 10.1371/journal.pgen.1002228 · DOI
- Hansen, 2012, BSmooth: from whole genome bisulfite sequencing reads to differentially methylated regions, Genome Biol., 13, R83, 10.1186/gb-2012-13-10-r83 · DOI
- Hashimoto, 2013, Regulated transcription of human matrix metalloproteinase 13 (MMP13) and interleukin-1β (IL1B) genes in chondrocytes depends on methylation of specific proximal promoter CpG sites, J. Biol. Chem., 288, 10061, 10.1074/jbc.M112.421156 · DOI
- Heinz, 2010, Simple combinations of lineage-determining transcription factors prime cis-regulatory elements required for macrophage and B cell identities, Mol. Cell, 38, 576, 10.1016/j.molcel.2010.05.004 · DOI · Paper page
- Hon, 2013, Epigenetic memory at embryonic enhancers identified in DNA methylation maps from adult mouse tissues, Nat. Genet., 45, 1198, 10.1038/ng.2746 · DOI
- Hu, 2016, Simultaneous profiling of transcriptome and DNA methylome from a single cell, Genome Biol., 17, 88, 10.1186/s13059-016-0950-z · DOI · Paper page
- Hur, 2016, CD82/KAI1 maintains the dormancy of long-term hematopoietic stem cells through interaction with DARC-expressing macrophages, Cell Stem Cell, 18, 508, 10.1016/j.stem.2016.01.013 · DOI
- Ivanova, 2002, A stem cell molecular signature, Science, 298, 601, 10.1126/science.1073823 · DOI
- Jinno, 1995, Establishment of functional imprinting of the H19 gene in human developing placentae, Nat. Genet., 10, 318, 10.1038/ng0795-318 · DOI
- Kent, 2009, Prospective isolation and molecular characterization of hematopoietic stem cells with durable self-renewal potential, Blood, 113, 6342, 10.1182/blood-2008-12-192054 · DOI
- Knapp, 2017, Dissociation of survival, proliferation, and state control in human hematopoietic stem cells, Stem Cell Rep., 8, 152, 10.1016/j.stemcr.2016.12.003 · DOI
- Knapp, 2018, A novel subset of human CD33+ haematopoietic stem cells characterized at single-cell resolution, Nat. Cell Biol.
- Lara-Astiaso, 2014, Immunogenetics. Chromatin state dynamics during blood formation, Science, 345, 943, 10.1126/science.1256271 · DOI · Paper page
- Laverdière, 2016, Complement cascade gene expression defines novel prognostic subgroups of acute myeloid leukemia, Exp. Hematol., 44, 1039, 10.1016/j.exphem.2016.07.012 · DOI
- Lorzadeh, 2016, Nucleosome density ChIP-Seq identifies distinct chromatin modification signatures associated with MNase accessibility, Cell Rep., 17, 2112, 10.1016/j.celrep.2016.10.055 · DOI
- Mamrut, 2013, DNA methylation of specific CpG sites in the promoter region regulates the transcription of the mouse oxytocin receptor, PLoS One, 8, e56869, 10.1371/journal.pone.0056869 · DOI
- Miura, 2012, Amplification-free whole-genome bisulfite sequencing by post-bisulfite adaptor tagging, Nucleic Acids Res., 40, e136, 10.1093/nar/gks454 · DOI
- Nile, 2008, Methylation status of a single CpG site in the IL6 promoter is related to IL6 messenger RNA levels and rheumatoid arthritis, Arthritis Rheum., 58, 2686, 10.1002/art.23758 · DOI
- Notta, 2011, Isolation of single human hematopoietic stem cells capable of long-term multilineage engraftment, Science, 333, 218, 10.1126/science.1201219 · DOI · Paper page
- Osawa, 1996, In vivo self-renewal of c-Kit+ Sca-1+ Lin(low/-) hemopoietic stem cells, J. Immunol., 156, 3207, 10.4049/jimmunol.156.9.3207 · DOI
- Provençal, 2015, The effects of early life stress on the epigenome: From the womb to adulthood and even before, Exp. Neurol., 268, 10, 10.1016/j.expneurol.2014.09.001 · DOI · Paper page
- Qu, 2016, Assessing cell-to-cell DNA methylation variability on individual long reads, Sci. Rep., 6, 21317, 10.1038/srep21317 · DOI
- Quinlan, 2010, BEDTools: a flexible suite of utilities for comparing genomic features, Bioinformatics, 26, 841, 10.1093/bioinformatics/btq033 · DOI · Paper page
- Quivoron, 2011, TET2 inactivation results in pleiotropic hematopoietic abnormalities in mouse and is a recurrent event during human lymphomagenesis, Cancer Cell, 20, 25, 10.1016/j.ccr.2011.06.003 · DOI · Paper page
- Rishi, 2010, CpG methylation of half-CRE sequences creates C/EBP binding sites that activate some tissue-specific genes, Proc. Natl. Acad. Sci. USA, 107, 20311, 10.1073/pnas.1008688107 · DOI
- Sanjuan-Pla, 2013, Platelet-biased stem cells reside at the apex of the haematopoietic stem-cell hierarchy, Nature, 502, 232, 10.1038/nature12495 · DOI
- Shlush, 2017, Tracing the origins of relapse in acute myeloid leukaemia to stem cells, Nature, 547, 104, 10.1038/nature22993 · DOI
- Smallwood, 2014, Single-cell genome-wide bisulfite sequencing for assessing epigenetic heterogeneity, Nat. Methods, 11, 817, 10.1038/nmeth.3035 · DOI · Paper page
- Tsuboi, 2017, Single CpG site methylation controls estrogen receptor gene transcription and correlates with hormone therapy resistance, J. Steroid Biochem. Mol. Biol., 171, 209, 10.1016/j.jsbmb.2017.04.001 · DOI
- Yamamoto, 2013, Clonal analysis unveils self-renewing lineage-restricted progenitors generated directly from hematopoietic stem cells, Cell, 154, 1112, 10.1016/j.cell.2013.08.007 · DOI
- Yu, 2016, Epigenetic memory underlies cell-autonomous heterogeneous behavior of hematopoietic stem cells, Cell, 167, 1310, 10.1016/j.cell.2016.10.045 · DOI
- Zhang, 2015, Predicting genome-wide DNA methylation using methylation marks, genomic position, and DNA regulatory elements, Genome Biol., 16, 14, 10.1186/s13059-015-0581-9 · DOI
- Zhou, 2017, DNA methylation of METTL7A gene body regulates its transcriptional level in thyroid cancer, Oncotarget, 8, 34652, 10.18632/oncotarget.16147 · DOI
Cited by
Simultaneous profiling of 3D genome structure and DNA methylation in single human cells
Lee, D.-S., Luo, C., Zhou, J., Chandran, S., Rivkin, A., Bartlett, A., Nery, J. R., Fitzpatrick, C., O’Connor, C., Dixon, J. R., et al. (2019) · Nature Methods · doi:10.1038/s41592-019-0547-z · Cited by 340
Clonal tracing with somatic epimutations reveals dynamics of blood ageing
Scherer, M., Singh, I., Braun, M. M., Szu-Tu, C., Sanchez Sanchez, P., Lindenhofer, D., Jakobsen, N. A., Körber, V., Kardorff, M., Nitsch, L., et al. (2025) · Nature · doi:10.1038/s41586-025-09041-8 · Cited by 89
Metadata
- Authors
- Hui, T., Cao, Q., Wegrzyn-Woltosz, J., O'Neill, K., Hammond, C. A., Knapp, D. J. H. F., Laks, E., Moksa, M., Aparicio, S., Eaves, C. J., Karsan, A., & Hirst, M.
- Venue
- Stem Cell Reports
- Publisher
- Elsevier BV
- Published
- 2018-08
- Volume
- 11
- Issue
- 2
- Pages
- 578-592
- ISSN
- 2213-6711
- PMC
- PMC6093082
- Cited by
- 98
- References
- 10
- Language
- en
- Licence
- Funders
- Michael Smith Foundation for Health Research (16127)
- Canada Foundation for Innovation (31343, 31098)
- Genome British Columbia (EP1- 120589)
- Canadian Institutes of Health Research
- Canadian Cancer Society Research Institute
- Terry Fox Research Institute (122869, 1074, 1021)
- Lotte and John Hecht Memorial Foundation (703489)
- Genome Canada
About these checks
Registry, retraction, Cites and statistics results are computed, not judged, with one exception: a printed reference that no index lists is read once by a model before it counts as a citation error. Claims are extracted by a model and kept only when their quote appears verbatim in the text; each cited source is then checked, with a model’s help, for whether it says what the claim relies on. Those verdicts can be wrong — read the claim’s quote and the cited source before relying on one.
Statistics and arithmetic are recomputed, not judged.
Confidence bands are shown only for fields calibrated on our annotated test set. None is calibrated yet, so no band is shown.
What counts as a claim ›How we measure confidence ›How we check this ›
Are you an author, or do you see a problem with this page? Request a review
How to cite
Cite CoChat for the checks on this page, and the paper for its own findings.
- This page
- CoChat. (2026). Citation check: High-Resolution Single-Cell DNA Methylation Measurements Reveal Epigenetically Distinct Hematopoietic Stem Cell Subpopulations. https://app.cochat.ai/papers/10.1016/j.stemcr.2018.07.003
- The paper
- Hui, T., Cao, Q., Wegrzyn-Woltosz, J., O'Neill, K., Hammond, C. A., Knapp, D. J. H. F., Laks, E., Moksa, M., Aparicio, S., Eaves, C. J., Karsan, A., & Hirst, M. (2018). High-Resolution Single-Cell DNA Methylation Measurements Reveal Epigenetically Distinct Hematopoietic Stem Cell Subpopulations. Stem Cell Reports. https://doi.org/10.1016/j.stemcr.2018.07.003
