

The DOI matches its Crossref record; 37 of the 37 references it cites were found in a registry or an index.
Integrated proteotranscriptomics of breast cancer reveals globally increased protein-mRNA concordance associated with subtypes and survival
Open accessAbstract
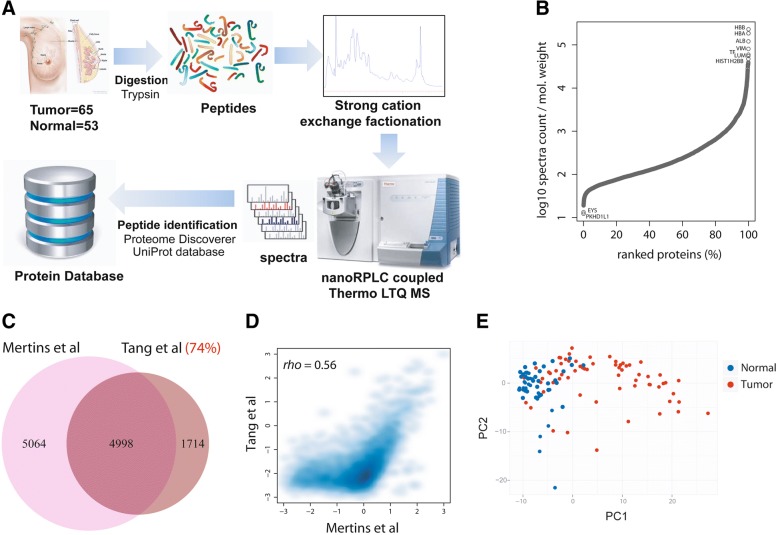
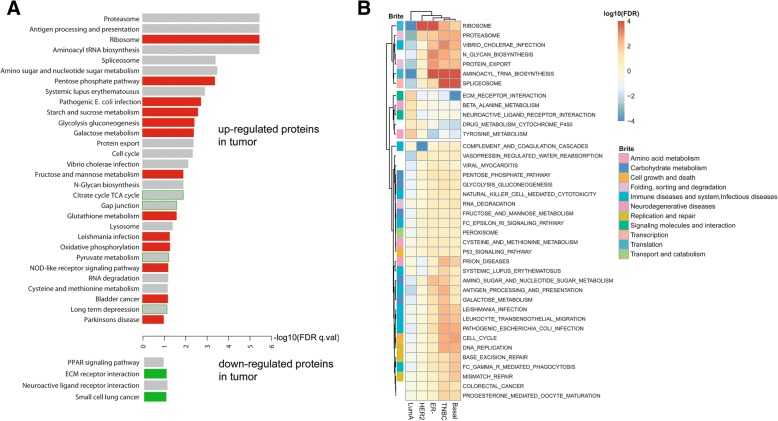
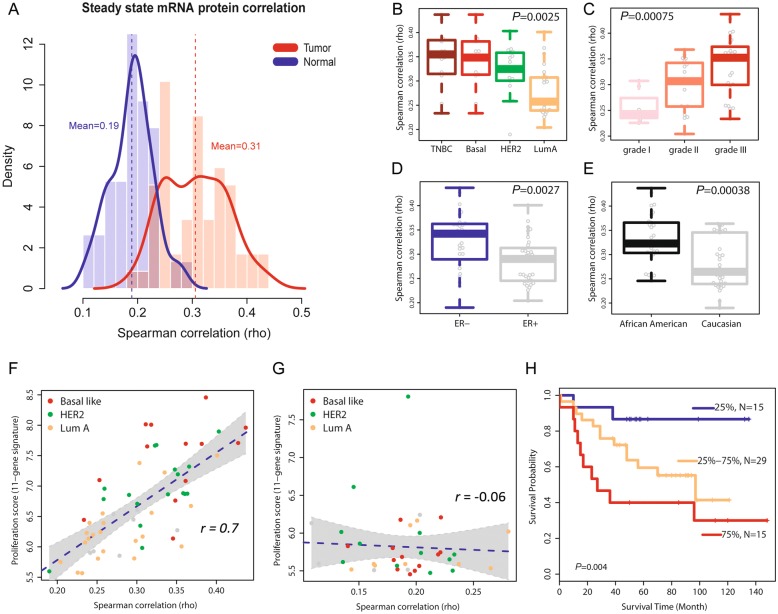
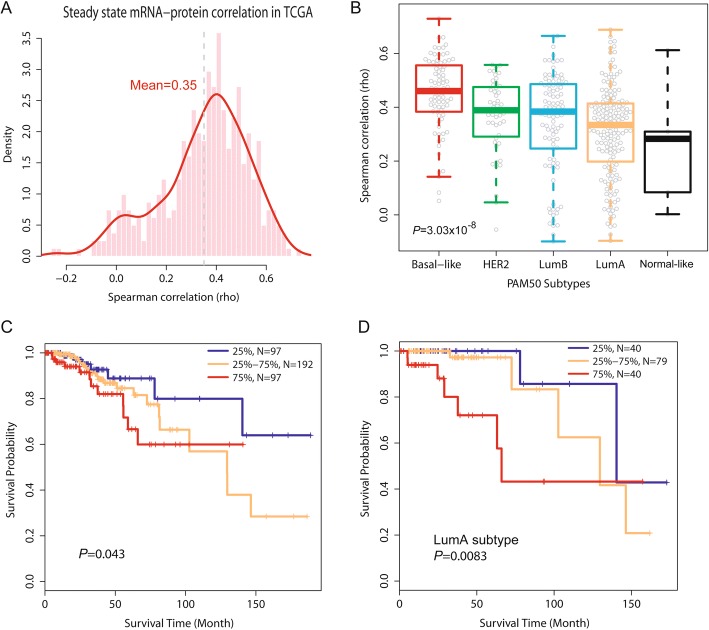
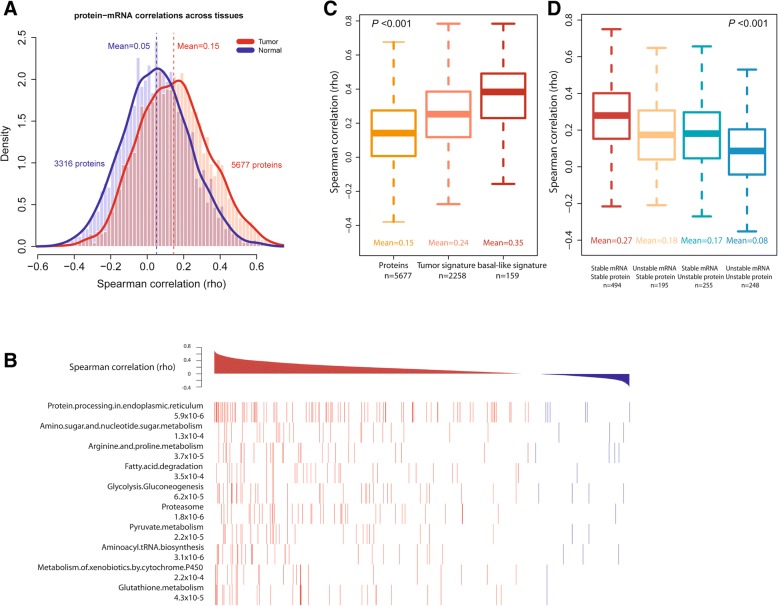
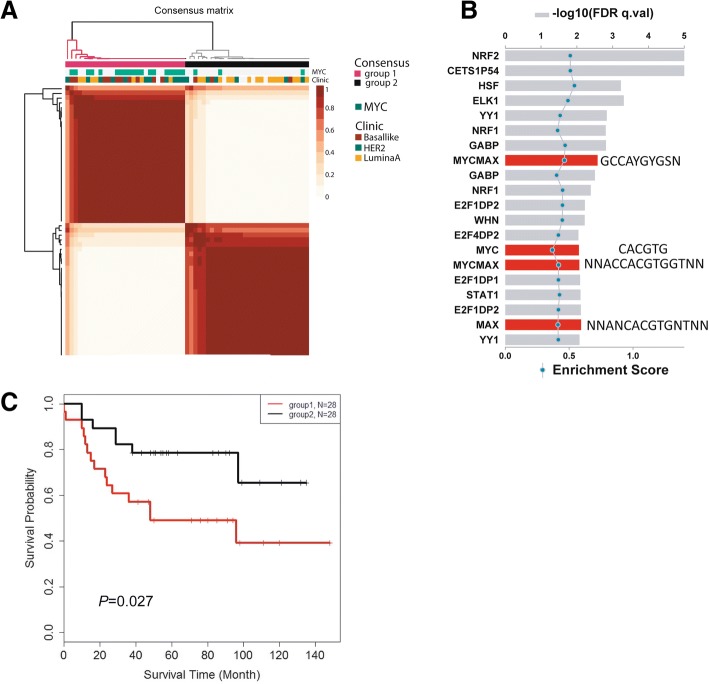
Background: Transcriptome analysis of breast cancer discovered distinct disease subtypes of clinical significance. However, it remains a challenge to define disease biology solely based on gene expression because tumor biology is often the result of protein function. Here, we measured global proteome and transcriptome expression in human breast tumors and adjacent non-cancerous tissue and performed an integrated proteotranscriptomic analysis. Methods: We applied a quantitative liquid chromatography/mass spectrometry-based proteome analysis using an untargeted approach and analyzed protein extracts from 65 breast tumors and 53 adjacent non-cancerous tissues. Additional gene expression data from Affymetrix Gene Chip Human Gene ST Arrays were available for 59 tumors and 38 non-cancerous tissues in our study. We then applied an integrated analysis of the proteomic and transcriptomic data to examine relationships between them, disease characteristics, and patient survival. Findings were validated in a second dataset using proteome and transcriptome data from “The Cancer Genome Atlas” and the Clinical Proteomic Tumor Analysis Consortium. Results: We found that the proteome describes differences between cancerous and non-cancerous tissues that are not revealed by the transcriptome. The proteome, but not the transcriptome, revealed an activation of infection-related signal pathways in basal-like and triple-negative tumors. We also observed that proteins rather than mRNAs are increased in tumors and show that this observation could be related to shortening of the 3′ untranslated region of mRNAs in tumors. The integrated analysis of the two technologies further revealed a global increase in protein-mRNA concordance in tumors. Highly correlated protein-gene pairs were enriched in protein processing and disease metabolic pathways. The increased concordance between transcript and protein levels was additionally associated with aggressive disease, including basal-like/triple-negative tumors, and decreased patient survival. We also uncovered a strong positive association between protein-mRNA concordance and proliferation of tumors. Finally, we observed that protein expression profiles co-segregate with a Myc activation signature and separate breast tumors into two subgroups with different survival outcomes. Conclusions: Our study provides new insights into the relationship between protein and mRNA expression in breast cancer and shows that an integrated analysis of the proteome and transcriptome has the potential of uncovering novel disease characteristics.
Overview
The claims and statistics of this paper haven’t been checked yet.
Run the check — free, no account needed. It reads the open-access text and checks the sources it cites.
Integrity signals
Registry
Cites
Statistics
Figures
Verification
Claims the paper makes
The claims and statistics of this paper haven’t been checked yet.
Run the check — free, no account needed. It reads the open-access text and checks the sources it cites.
Claims other papers make about this one
Each is checked against this paper’s own text: does it say what the citing paper says it does?
The source backs part of the claim, not all of it — or backs it for a different population, condition or comparison.
In the citing paper
“In a dataset of 61 unselected breast cancer patients [10], aggregate survival analysis showed no significant difference in overall survival (OS) between patients with high vs. low tumor SLFN11 expression (HR = 1.24, p = 0.608) (Fig 3A).”
From Integrated pan-cancer gene expression and drug sensitivity analysis reveals SLFN11 mRNA as a solid tumor biomarker predictive of sensitivity to DNA-damaging chemotherapy (2019) · cites this paper as [10]
Experimental — accuracy not yet measured
Self-check
Percentages, sums and reported differences re-computed from the paper’s own numbers.
The self-check needs the paper’s full text.
Citations
Cites
Controlling the False Discovery Rate: A Practical and Powerful Approach to Multiple Testing
Benjamini, Y., & Hochberg, Y. (1995) · Journal of the Royal Statistical Society Series B: Statistical Methodology · doi:10.1111/j.2517-6161.1995.tb02031.x · Cited by 109,482 · cited 1×
“Adjusted P values based on the analysis of 59 tumors and 38 non-cancerous tissues were computed by the Benjamini-Hochberg procedure [21].”
Molecular portraits of human breast tumours
Perou, C., Sørlie, T., Eisen, M., van de Rijn, M., Jeffrey, S., Rees, C. A., Pollack, J., Ross, D., Johnsen, H., Akslen, L., et al. (2000) · Nature · doi:10.1038/35021093 · Cited by 16,551 · cited 3×
“Gene expression profiling of breast tumors has led to the landmark discovery of disease subtypes and novel biomarkers for therapy response and disease survival [1 – 4].”
Comprehensive molecular portraits of human breast tumours
The Cancer Genome Atlas Network (2012) · Nature · doi:10.1038/nature11412 · Cited by 12,129 · cited 3×
“These findings were corroborated using proteome and transcriptome data for 404 breast tumors from “ The Cancer Genome Atlas ” (TCGA) and 77 breast tumors from the Clinical Proteomic Tumor Analysis Consortium (CPTAC) [13, 17].”
Bioconductor: open software development for computational biology and bioinformatics
Gentleman, R. C., Carey, V. J., Bates, D. M., Bolstad, B., Dettling, M., Dudoit, S., Ellis, B., Gautier, L., Ge, Y., Gentry, J., et al. (2004) · Genome biology · doi:10.1186/gb-2004-5-10-r80 · Cited by 12,082 · cited 1×
“Statistical analyses were performed using the R software developed by the R Development Core Team at R Foundation for Statistical Computing and packages in Bioconductor [24].”
Sørlie, T., Perou, C. M., Tibshirani, R. J., Aas, T., Geisler, S. B., Johnsen, H., Hastie, T. J., Eisen, M. B., van de Rijn, M., Jeffrey, S. S., et al. (2001) · Proceedings of the National Academy of Sciences · doi:10.1073/pnas.191367098 · Cited by 11,506
Global quantification of mammalian gene expression control
Schwanhäusser, B., Busse, D., Li, N., Dittmar, G., Schuchhardt, J., Wolf, J., Chen, W., & Selbach, M. (2011) · Nature · doi:10.1038/nature10098 · Cited by 6,566 · cited 2×
“5d), consistent with a previous observation [16, 27].”
InfluentialA Gene-Expression Signature as a Predictor of Survival in Breast Cancer
van de Vijver, M. J., He, Y. D., Veer, L. V. ‘., Dai, H. A., Hart, A. A. M., Voskuil, D. W., Schreiber, G. J., Peterse, J. L., Roberts, C., Marton, M. J., et al. (2002) · New England Journal of Medicine · doi:10.1056/nejmoa021967 · Cited by 6,474
A Multigene Assay to Predict Recurrence of Tamoxifen-Treated, Node-Negative Breast Cancer
Paik, S., Shak, S., Tang, G., Kim, C., Baker, J. B., Cronin, M. T., Baehner, F. L., Walker, M. G., Watson, D., Park, T., et al. (2004) · New England Journal of Medicine · doi:10.1056/nejmoa041588 · Cited by 6,321
Correlation of mRNA and protein in complex biological samples
Maier, T., Güell, M., & Serrano, L. (2009) · FEBS Letters · doi:10.1016/j.febslet.2009.10.036 · Cited by 1,802 · cited 1×
“We applied the Spearman rank correlation test for protein-mRNA correlations because protein and mRNA abundances do not strictly follow a normal distribution or a linear relationship, consistent with previous observations [25].”
Proteogenomics connects somatic mutations to signalling in breast cancer
CPTAC, N., Mertins, P., Mani, D. R., Ruggles, K. V., Gillette, M. A., Clauser, K. R., Wang, P., Wang, X., Qiao, J. W., Cao, S., et al. (2016) · Nature · doi:10.1038/nature18003 · Cited by 1,676 · cited 10×
“Concordances between protein-mRNA pairs in breast cancer cell lines have been examined, and a mean correlation score of ~ for 94 pairs can be estimated from the study by Kennedy et al. [7]. tumors and 0.47 for colorectal tumor [13, 16].”
InfluentialSelf-citationMayr, C., & Bartel, D. P. (2009) · Cell · doi:10.1016/j.cell.2009.06.016 · Cited by 1,613
Proteogenomic characterization of human colon and rectal cancer
CPTAC, T. N., Zhang, B., Wang, J., Wang, X., Zhu, J., Liu, Q., Shi, Z., Chambers, M. C., Zimmerman, L. J., Shaddox, K. F., et al. (2014) · Nature · doi:10.1038/nature13438 · Cited by 1,462 · cited 6×
“Concordances between protein-mRNA pairs in breast cancer cell lines have been examined, and a mean correlation score of ~ for 94 pairs can be estimated from the study by Kennedy et al. [7]. tumors and 0.47 for colorectal tumor [13, 16].”
InfluentialSelf-citationGlobal signatures of protein and mRNA expression levels
de Sousa Abreu, R., Penalva, L. O., Marcotte, E. M., & Vogel, C. (2009) · Molecular BioSystems · doi:10.1039/b908315d · Cited by 1,248
MYC as a regulator of ribosome biogenesis and protein synthesis
van Riggelen, J., Yetil, A., & Felsher, D. W. (2010) · Nature Reviews Cancer · doi:10.1038/nrc2819 · Cited by 956 · cited 2×
“gene as a regulator of ribosome biogenesis and enhancer of protein synthesis [29, 30] and the proteogenomic”
Xia, Z., Donehower, L. A., Cooper, T. A., Neilson, J. R., Wheeler, D. A., Wagner, E. J., & Li, W. (2014) · Nature Communications · doi:10.1038/ncomms6274 · Cited by 581
Comprehensive molecular portraits of human breast tumours
McCullough, A. J. (2013) · Yearbook of Pathology and Laboratory Medicine · doi:10.1016/j.ypat.2012.10.013 · Cited by 452 · cited 15×
“This observation is consistent with both the known function of the MYC oncogene as a regulator of ribosome biogenesis and enhancer of protein synthesis [29, 30] and the proteogenomic characterization of breast tumors by the TCGA/CPTAC Consortium [13].”
MethodResultInfluentialMYC-driven accumulation of 2-hydroxyglutarate is associated with breast cancer prognosis
Terunuma, A., Putluri, N., Mishra, P., Mathé, E. A., Dorsey, T. H., Yi, M., Wallace, T. A., Issaq, H. J., Zhou, M., Killian, J. K., et al. (2014) · Journal of Clinical Investigation · doi:10.1172/jci71180 · Cited by 428 · cited 3×
“Yet, further analyses showed that a Myc activation signature in breast tumors [19, 28]”
BackgroundMethodSelf-citationPathway-based personalized analysis of cancer
Drier, Y., Sheffer, M., & Domany, E. (2013) · Proceedings of the National Academy of Sciences · doi:10.1073/pnas.1219651110 · Cited by 336 · cited 1×
“Recent studies have demonstrated the advantage of pathway-based analysis in assessing tumor biology [34, 35].”
Proteomic maps of breast cancer subtypes
Tyanova, S., Albrechtsen, R., Kronqvist, P., Cox, J., Mann, M., & Geiger, T. (2016) · Nature Communications · doi:10.1038/ncomms10259 · Cited by 330
A multigene assay to predict recurrence of tamoxifen-treated, node-negative breast cancer
Melisko, M. (2005) · doi:10.3109/14733400500093379 · Cited by 314 · cited 2×
“Gene expression profiling of breast tumors has led to the landmark discovery of disease subtypes and novel biomarkers for therapy response and disease survival [1 – 4].”
Pourdehnad, M., Truitt, M., Siddiqi, I. N., Ducker, G. S., Shokat, K. M., & Ruggero, D. (2013) · Proceedings of the National Academy of Sciences · doi:10.1073/pnas.1310230110 · Cited by 295 · cited 2×
“Our finding indicates a major influence of Myc signaling on the proteome in breast cancer, consistent with the function of Myc as a regulator of ribosome biogenesis and enhancer of protein synthesis [29, 30].”
Gatza, M. L., Silva, G. O., Parker, J. S., Fan, C., & Perou, C. M. (2014) · Nature Genetics · doi:10.1038/ng.3073 · Cited by 261 · cited 1×
“Recent studies have demonstrated the advantage of pathway-based analysis in assessing tumor biology [34, 35].”
The Proteomic Landscape of Triple-Negative Breast Cancer
Lawrence, R., Perez, E. M., Hernández, D., Miller, C. P., Haas, K. M., Irie, H. Y., Lee, S., Blau, C. A., & Villén, J. (2015) · Cell Reports · doi:10.1016/j.celrep.2015.03.050 · Cited by 225 · cited 1×
“Others examined the proteome of breast cancer and characterized disease subtypes [11 – 13] or engaged in biomarker discovery [5, 10, 33].”
Characterization of Human Cancer Cell Lines by Reverse-phase Protein Arrays
Li, J., Zhao, W., Akbani, R., Liu, W., Ju, Z., Ling, S., Vellano, C. P., Roebuck, P. L., Yu, Q., Eterovic, A. K., et al. (2017) · Cancer Cell · doi:10.1016/j.ccell.2017.01.005 · Cited by 206 · cited 1×
“35 for 47 breast cancer cell lines [31], which is comparable with the results from other cell-based studies [27, 32].”
ResultKennedy, J. J., Abbatiello, S. E., Kim, K., Yan, P., Whiteaker, J. R., Lin, C., Kim, J. S., Zhang, Y., Wang, X., Ivey, R. G., et al. (2014) · Nature Methods · doi:10.1038/nmeth.2763 · Cited by 184 · cited 1×
“Concordances between protein-mRNA pairs in breast cancer cell lines have been examined, and a mean correlation score of ~ for 94 pairs can be estimated from the study by Kennedy et al. [7]. tumors and 0.47 for colorectal tumor [13, 16].”
InfluentialSelf-citationChandriani, S. J., Frengen, E., Cowling, V. H., Pendergrass, S. A., Perou, C. M., Whitfield, M. L., & Cole, M. D. (2009) · PLoS ONE · doi:10.1371/journal.pone.0006693 · Cited by 153 · cited 2×
“Yet, further analyses showed that a Myc activation signature in breast tumors [19, 28]”
BackgroundAssociation of Breast Cancer Outcome With Status of p53 and MDM2 SNP309
Boersma, B. J., Howe, T. M., Goodman, J. E., Yfantis, H. G., Lee, D. H., Chanock, S. J., & Ambs, S. (2006) · JNCI Journal of the National Cancer Institute · doi:10.1093/jnci/djj245 · Cited by 148 · cited 1×
“Breast cancer patients were recruited between 1993 and 2003, as described previously [18, 19].”
Self-citationProteomic Portrait of Human Breast Cancer Progression Identifies Novel Prognostic Markers
Geiger, T., Madden, S. F., Gallagher, W. M., Cox, J., & Mann, M. (2012) · Cancer Research · doi:10.1158/0008-5472.can-11-3711 · Cited by 144 · cited 4×
“While untargeted proteomics has advanced our knowledge of breast cancer biology [5, 6, 8 – 13] and other cancers [14 – 16], a more systematic investigation of the relationship between the tumor proteome and transcriptome, here termed proteotranscriptomic analysis, has the potential to uncover novel…”
InfluentialPAM50 proliferation score as a predictor of weekly paclitaxel benefit in breast cancer
Martín, M., Prat, A., Rodríguez-Lescure, Á., Caballero, R., Ebbert, M., Munárriz, B., Ruíz-Borrego, M., Bastien, R. R. L., Crespo, C., Davis, C. A., et al. (2013) · Breast Cancer Research and Treatment · doi:10.1007/s10549-013-2416-2 · Cited by 103 · cited 1×
“We selected the array-based gene expression profiles of 11 cell cycle genes (BIRC5, CCNB1, CDC20, CEP55, MKI67, NDC80, NUF2, PTTG1, RRM2, TYMS, UBE2C) and summed them into a metagene score as a marker for tissue proliferation, as described previously [23].”
Liu, N. Q., Stingl, C., Look, M. P., Smid, M., Braakman, R. B. H., Marchi, T. D., Sieuwerts, A. M., Span, P. N., Sweep, F. C. G. J., Linderholm, B. K., et al. (2014) · JNCI Journal of the National Cancer Institute · doi:10.1093/jnci/djt376 · Cited by 96 · cited 1×
“Others examined the proteome of breast cancer and characterized disease subtypes [11 – 13] or engaged in biomarker discovery [5, 10, 33].”
System-wide Clinical Proteomics of Breast Cancer Reveals Global Remodeling of Tissue Homeostasis
Pozniak, Y., Balint‐Lahat, N., Rudolph, J. D., Lindskog, C., Katzir, R., Avivi, C., Pontén, F., Ruppin, E., Barshack, I., & Geiger, T. (2016) · Cell Systems · doi:10.1016/j.cels.2016.02.001 · Cited by 83 · cited 6×
“To further validate our coverage of proteins for breast cancer, we compared our list of proteins with the list of identified proteins in three published breast cancer studies [8, 12, 13].”
InfluentialSelf-citationLangley, S. R., & Mayr, M. (2015) · Journal of Proteomics · doi:10.1016/j.jprot.2015.07.012 · Cited by 59
Tang, H.-Y., Beer, L. A., Chang-Wong, T., Hammond, R., Gimotty, P., Coukos, G., & Speicher, D. (2011) · Journal of Proteome Research · doi:10.1021/pr200603h · Cited by 55 · cited 1×
“While untargeted proteomics has advanced our knowledge of breast cancer biology [5, 6, 8 – 13] and other cancers [14 – 16], a more systematic investigation of the relationship between the tumor proteome and transcriptome, here termed proteotranscriptomic analysis, has the potential to uncover novel…”
Liu, N. Q., Dekker, L. J. M., Stingl, C., Güzel, C., Marchi, T. D., Martens, J. W. M., Foekens, J. A., Luider, T. M., & Umar, A. (2013) · Journal of Proteome Research · doi:10.1021/pr4005794 · Cited by 55 · cited 1×
“While untargeted proteomics has advanced our knowledge of breast cancer biology [5, 6, 8 – 13] and other cancers [14 – 16], a more systematic investigation of the relationship between the tumor proteome and transcriptome, here termed proteotranscriptomic analysis, has the potential to uncover novel…”
Pavlou, M. P., Dimitromanolakis, A., Martínez‐Morillo, E., Smid, M., Foekens, J. A., & Diamandis, E. P. (2014) · Journal of Proteome Research · doi:10.1021/pr500352e · Cited by 28 · cited 1×
“Others examined the proteome of breast cancer and characterized disease subtypes [11 – 13] or engaged in biomarker discovery [5, 10, 33].”
Warmoes, M., Jaspers, J., Xu, G., Sampadi, B., Pham, T., Knol, J., Piersma, S., Boven, E., Jonkers, J., Rottenberg, S., et al. (2013) · Molecular & Cellular Proteomics · doi:10.1074/mcp.m112.024182 · Cited by 26
Beer, L. A., Wang, H., Tang, H.-Y., Cao, Z., Chang-Wong, T., Tanyi, J., Zhang, R.-G., Liu, Q., & Speicher, D. (2013) · PLoS ONE · doi:10.1371/journal.pone.0060129 · Cited by 18
Cited by
Sorted by citations
Proteogenomic data and resources for pan-cancer analysis
Li, Y., Dou, Y., Leprevost, F. D. V., Geffen, Y., Calinawan, A. P., Aguet, F., Akiyama, Y., Anand, S. K., Birger, C., Cao, S., et al. (2023) · Cancer Cell · doi:10.1016/j.ccell.2023.06.009 · Cited by 266
NEAT1 is essential for metabolic changes that promote breast cancer growth and metastasis
Park, M. K., Zhang, L., Min, K., Cho, J.-H., Yeh, C., Moon, H., Hormaechea‐Agulla, D., Mun, H., Ko, S., Lee, J. W., et al. (2021) · Cell Metabolism · doi:10.1016/j.cmet.2021.11.011 · Cited by 216
Mottini, C., Napolitano, F., Li, Z., Gao, X., & Cardone, L. (2019) · Seminars in Cancer Biology · doi:10.1016/j.semcancer.2019.09.023 · Cited by 125
Survival analysis in breast cancer using proteomic data from four independent datasets
Osz, Á., Lánczky, A., & Győrffy, B. (2020) · Scientific Reports · doi:10.1038/s41598-021-96340-5 · Cited by 69
Omics-Based Investigations of Breast Cancer
Neagu, A.-N., Whitham, D., Bruno, P. S., Morrissiey, H., Darie, C. A., & Darie, C. C. (2023) · Molecules · doi:10.3390/molecules28124768 · Cited by 81
Metadata
- Authors
- Tang, W., Zhou, M., Dorsey, T. H., Prieto, D. A., Wang, X. W., Ruppin, E., Veenstra, T. D., & Ambs, S.
- Affiliations
- National Institutes of Health (US)
- Frederick National Laboratory for Cancer Research (US)
- National Cancer Institute (US)
- Corresponding author
- Ambs, Stefan
- Venue
- Genome Medicine
- Published
- 2018-12-03
- Volume
- 10
- Issue
- 1
- Pages
- 94-94
- ISSN
- 1756-994X (ISSN-L)
- PMC
- PMC6276229
- OpenAlex
- W2902072367
- Cited by
- 162
- References
- 37
- Citations by year
- 2026: 7 · 2025: 16 · 2024: 20 · 2023: 44 · 2022: 25 · 2021: 35 · 2020: 9 · 2019: 6
- FWCI
- 3.78
- Type
- journal article
- Language
- en
- Update notices
- correction (2025-06-24)
- Open access
- gold
- doi.org
- Locations
- Genome Medicine (publishedVersion, cc-by)
- Europe PMC (PubMed Central) (publishedVersion, other-oa)
- PubMed Central (publishedVersion, cc-by)
- PubMed (publishedVersion)
- DigitalCommons-Cedarville (Cedarville University) (submittedVersion)
- DOAJ (DOAJ: Directory of Open Access Journals) (submittedVersion, cc-by-sa)
- Funders
- National Cancer Institute (ZIA BC 010887)
- Topics
- Life Sciences › Biochemistry, Genetics and Molecular Biology › Cancer Research › Breast Cancer Treatment Studies
- Physical Sciences › Chemistry › Spectroscopy › Advanced Proteomics Techniques and Applications
- Life Sciences › Biochemistry, Genetics and Molecular Biology › Molecular Biology › Bioinformatics and Genomic Networks
- Keywords
- breast cancer, proteotranscriptomics, breast cancer subtypes, basal-like breast cancer, triple-negative breast cancer, tumor cell proliferation, patient survival
- MeSH terms
- Breast Neoplasms, Chromatography, Liquid, Female, Humans, Mass Spectrometry, Signal Transduction, Gene Expression Regulation, Neoplastic, Oligonucleotide Array Sequence Analysis, Gene Expression Profiling, Proteomics
About these checks
Registry, retraction, Cites and statistics results are computed, not judged, with one exception: a printed reference that no index lists is read once by a model before it counts as a citation error. Claims are extracted by a model and kept only when their quote appears verbatim in the text; each cited source is then checked, with a model’s help, for whether it says what the claim relies on. Those verdicts can be wrong — read the claim’s quote and the cited source before relying on one.
Statistics and arithmetic are recomputed, not judged.
Confidence bands are shown only for fields calibrated on our annotated test set. None is calibrated yet, so no band is shown.
What counts as a claim ›How we measure confidence ›How we check this ›
Are you an author, or do you see a problem with this page? Request a review
