

The DOI matches its Crossref record; 33 of the 33 references it cites were found in a registry or an index.
Spatial transcriptomics analysis of neoadjuvant cabozantinib and nivolumab in advanced hepatocellular carcinoma identifies independent mechanisms of resistance and recurrence
Open accessPublished version of a preprint
Abstract
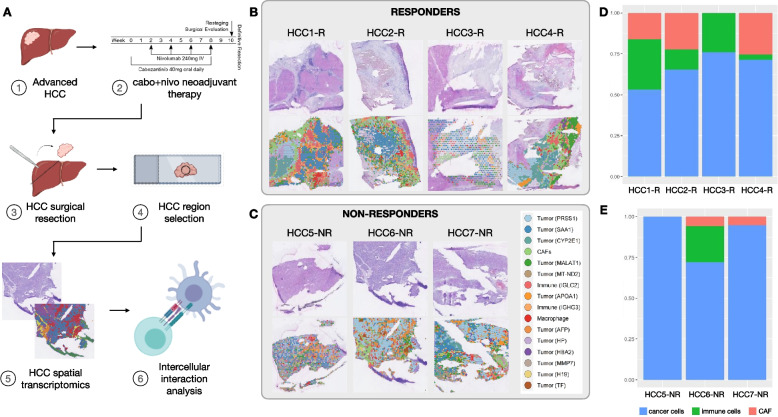
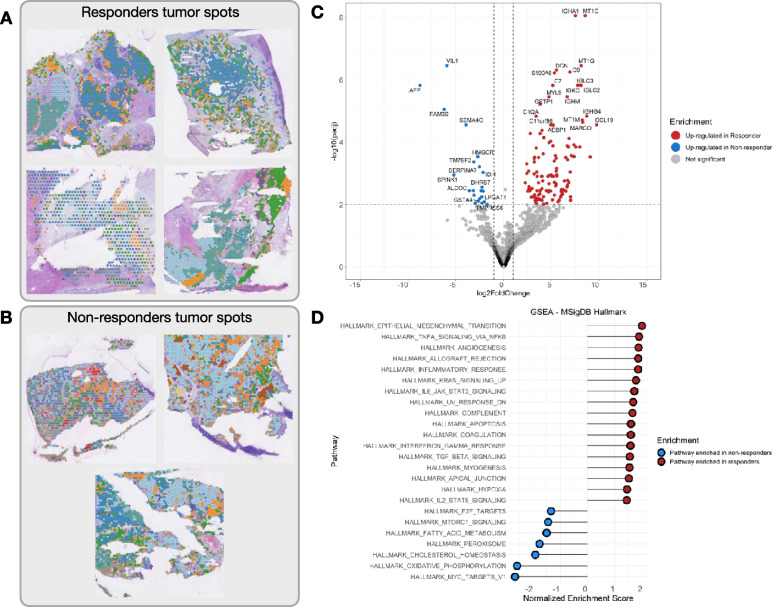
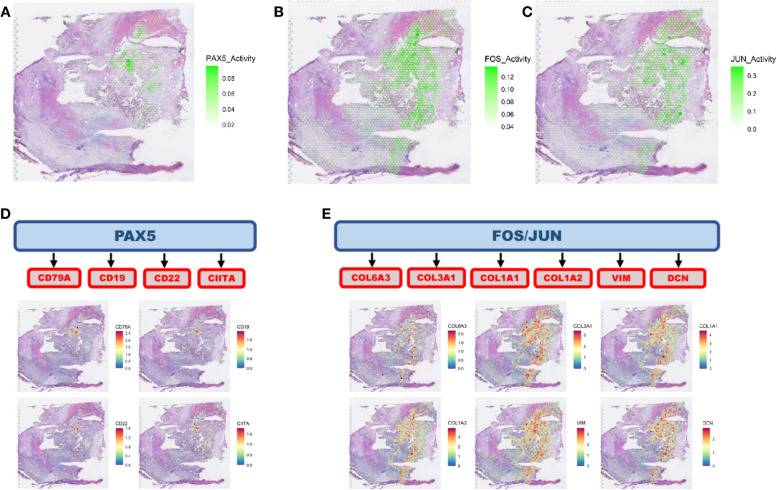
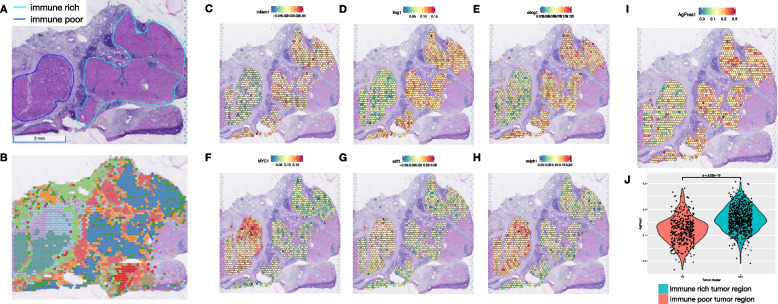
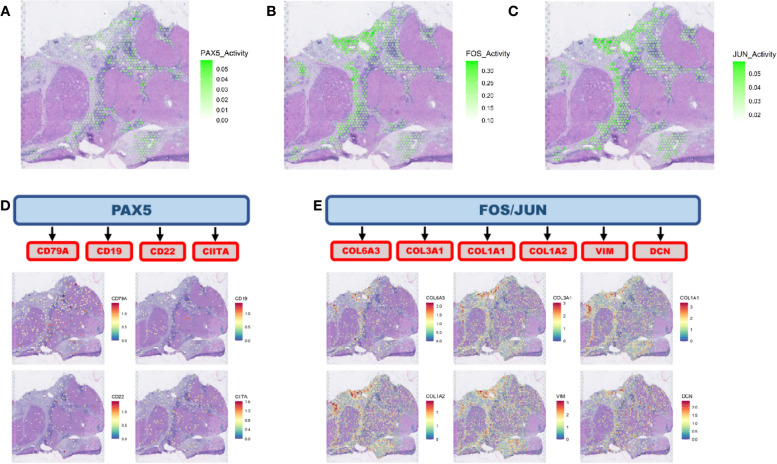
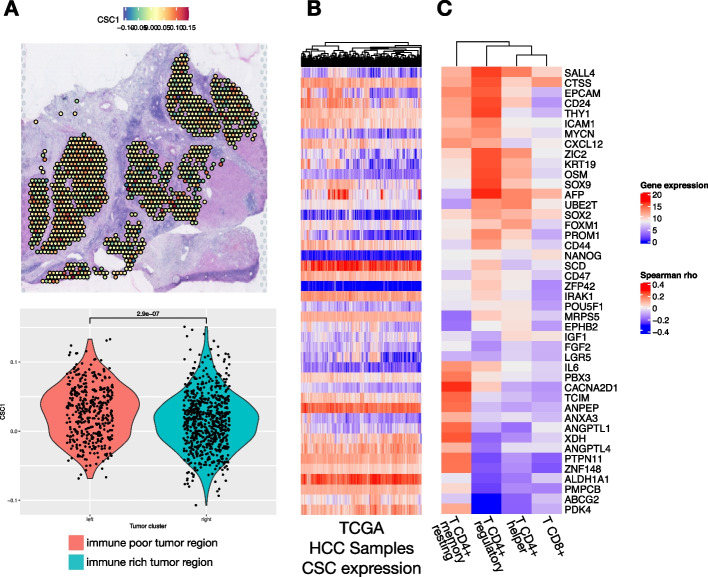
BACKGROUND: Novel immunotherapy combination therapies have improved outcomes for patients with hepatocellular carcinoma (HCC), but responses are limited to a subset of patients. Little is known about the inter- and intra-tumor heterogeneity in cellular signaling networks within the HCC tumor microenvironment (TME) that underlie responses to modern systemic therapy. METHODS: We applied spatial transcriptomics (ST) profiling to characterize the tumor microenvironment in HCC resection specimens from a prospective clinical trial of neoadjuvant cabozantinib, a multi-tyrosine kinase inhibitor that primarily blocks VEGF, and nivolumab, a PD-1 inhibitor in which 5 out of 15 patients were found to have a pathologic response at the time of resection. RESULTS: ST profiling demonstrated that the TME of responding tumors was enriched for immune cells and cancer-associated fibroblasts (CAF) with pro-inflammatory signaling relative to the non-responders. The enriched cancer-immune interactions in responding tumors are characterized by activation of the PAX5 module, a known regulator of B cell maturation, which colocalized with spots with increased B cell marker expression suggesting strong activity of these cells. HCC-CAF interactions were also enriched in the responding tumors and were associated with extracellular matrix (ECM) remodeling as there was high activation of FOS and JUN in CAFs adjacent to the tumor. The ECM remodeling is consistent with proliferative fibrosis in association with immune-mediated tumor regression. Among the patients with major pathologic responses, a single patient experienced early HCC recurrence. ST analysis of this clinical outlier demonstrated marked tumor heterogeneity, with a distinctive immune-poor tumor region that resembles the non-responding TME across patients and was characterized by HCC-CAF interactions and expression of cancer stem cell markers, potentially mediating early tumor immune escape and recurrence in this patient. CONCLUSIONS: These data show that responses to modern systemic therapy in HCC are associated with distinctive molecular and cellular landscapes and provide new targets to enhance and prolong responses to systemic therapy in HCC.
Overview
The claims and statistics of this paper haven’t been checked yet.
Run the check — free, no account needed. It reads the open-access text and checks the sources it cites.
Integrity signals
Registry
Cites
Statistics
Figures
Verification
Claims the paper makes
The claims and statistics of this paper haven’t been checked yet.
Run the check — free, no account needed. It reads the open-access text and checks the sources it cites.
Self-check
Percentages, sums and reported differences re-computed from the paper’s own numbers.
The self-check needs the paper’s full text.
Citations
Cites
Sung, H., Ferlay, J., Siegel, R. L., Laversanne, M., Soerjomataram, I., Jemal, A., & Bray, F. (2021) · CA: A Cancer Journal for Clinicians · doi:10.3322/caac.21660 · Cited by 108,699
Moderated estimation of fold change and dispersion for RNA-seq data with DESeq2
Love, M. I., Huber, W., & Anders, S. (2014) · Genome Biology · doi:10.1186/s13059-014-0550-8 · Cited by 95,106
Integrated analysis of multimodal single-cell data
Hao, Y., Hao, S., Andersen-Nissen, E., Mauck, W. M., Zheng, S., Butler, A., Lee, M. J., Wilk, A. J., Darby, C., Zagar, M., et al. (2020) · doi:10.1101/2020.10.12.335331 · Cited by 15,508
The Molecular Signatures Database Hallmark Gene Set Collection
Liberzon, A., Birger, C., Thorvaldsdóttir, H., Ghandi, M., Mesirov, J. P., & Tamayo, P. (2015) · Cell Systems · doi:10.1016/j.cels.2015.12.004 · Cited by 13,807
Fast, sensitive and accurate integration of single-cell data with Harmony
Korsunsky, I., Millard, N., Fan, J., Slowikowski, K., Zhang, F., Wei, K., Baglaenko, Y., Brenner, M., Loh, P.-R., & Raychaudhuri, S. (2019) · Nature Methods · doi:10.1038/s41592-019-0619-0 · Cited by 10,488
Complex heatmaps reveal patterns and correlations in multidimensional genomic data
Gu, Z., Eils, R., & Schlesner, M. (2016) · Bioinformatics · doi:10.1093/bioinformatics/btw313 · Cited by 10,037
Atezolizumab plus bevacizumab in unresectable hepatocellular carcinoma
Finn, R. S., Qin, S., Ikeda, M., Galle, P. R., Ducreux, M., Kim, T.-Y., Kudo, M., Breder, V., Merle, P., Kaseb, A. O., et al. (2020) · New England Journal of Medicine · doi:10.1056/nejmoa1915745 · Cited by 7,470
Scenic: single-cell regulatory network inference and clustering.
Aibar, S., González-Blas, C. B., Moerman, T., Huynh-Thu, V. A., Imrichova, H., Hulselmans, G., Rambow, F., Marine, J.-C., Geurts, P., Aerts, J., et al. (2017) · Nature Methods · doi:10.1038/nmeth.4463 · Cited by 6,520
The Immune Landscape of Cancer
Thorsson, V., Gibbs, D. L., Brown, S. D., Wolf, D., Bortone, D. S., Ou Yang, T.-H., Porta-Pardo, E., Gao, G. F., Plaisier, C. L., Eddy, J. A., et al. (2018) · Immunity · doi:10.1016/j.immuni.2018.03.023 · Cited by 5,870
Self-citationFrom Louvain to Leiden: guaranteeing well-connected communities
Traag, V. A., Waltman, L., & van Eck, N. J. (2019) · Scientific Reports · doi:10.1038/s41598-019-41695-z · Cited by 5,635
Research works printed but not linked: 1
- Zhang S, Yuan L, Danilova L, Mo G, Zhu Q, Deshpande A, et al. Spatial transcriptomics analysis of neoadjuvant cabozantinib and nivolumab in advanced hepatocellular GEO Accession viewer. https://www.ncbi.nlm.nih.gov/geo/query/acc.cgi?acc=GSE238264. Accessed 1 Aug 2023. · DOI
Cited by
Sorted by citations
Biomarkers for immunotherapy of hepatocellular carcinoma
Greten, T. F., Villanueva, A., Korangy, F., Ruf, B., Yarchoan, M., Ma, L., Ruppin, E., & Wang, X. W. (2023) · Nature Reviews Clinical Oncology · doi:10.1038/s41571-023-00816-4 · Cited by 227
Self-citationGuedes, J., Woldmar, N., Szasz, A. M., Wieslander, E., Pawłowski, K., Horvatovich, P., Malm, J., Szadai, L., Németh, I. B., Marko-Varga, G., et al. (2025) · Journal of Proteomics · doi:10.1016/j.jprot.2025.105493 · Cited by 16
Metadata
- Authors
- Zhang, S., Yuan, L., Danilova, L., Mo, G., Zhu, Q., Deshpande, A., Bell, A. T. F., Elisseeff, J., Popel, A. S., Anders, R. A., Jaffee, E. M., Yarchoan, M., Fertig, E. J., & Kagohara, L. T.
- Affiliations
- Johns Hopkins University (US)
- Corresponding author
- Fertig, Elana J.
- Kagohara, Luciane T.
- ORCID
- Venue
- Genome Medicine
- Published
- 2023-09-18
- Volume
- 15
- Issue
- 1
- Pages
- 72-72
- ISSN
- 1756-994X (ISSN-L)
- PMC
- PMC10506285
- OpenAlex
- W4386834775
- Cited by
- 140
- References
- 33
- Citations by year
- 2026: 41 · 2025: 43 · 2024: 50 · 2023: 6
- FWCI
- 24.01
- Type
- journal article
- Language
- en
- Open access
- gold
- doi.org
- Locations
- Genome Medicine (publishedVersion, cc-by)
- bioRxiv (Cold Spring Harbor Laboratory) (acceptedVersion, cc-by-nc-nd)
- PubMed Central (publishedVersion, cc-by)
- PubMed (publishedVersion)
- PubMed Central (submittedVersion, cc-by-nc-nd)
- DOAJ (DOAJ: Directory of Open Access Journals) (submittedVersion, cc-by-sa)
- Funders
- Maryland Cancer Moonshot Research Grant to the Johns Hopkins Medical Institutions
- Stand Up To Cancer
- NIH/NCI
- Allegheny Health Network
- Exelixis
- Bristol-Myers Squibb
- Topics
- Health Sciences › Medicine › Hepatology › Hepatocellular Carcinoma Treatment and Prognosis
- Health Sciences › Medicine › Oncology › Cancer Immunotherapy and Biomarkers
- Life Sciences › Biochemistry, Genetics and Molecular Biology › Molecular Biology › Single-cell and spatial transcriptomics
- Keywords
- hepatocellular carcinoma, cabozantinib, nivolumab, neoadjuvant therapy, tumor microenvironment, spatial transcriptomics, tyrosine kinase inhibitor resistance, anti-PD-1 resistance, cancer-associated fibroblasts, PAX5, B cell activation, extracellular matrix remodeling, tumor heterogeneity, cancer stem cells, immune evasion, tumor recurrence, immune cell infiltration
About these checks
Registry, retraction, Cites and statistics results are computed, not judged, with one exception: a printed reference that no index lists is read once by a model before it counts as a citation error. Claims are extracted by a model and kept only when their quote appears verbatim in the text; each cited source is then checked, with a model’s help, for whether it says what the claim relies on. Those verdicts can be wrong — read the claim’s quote and the cited source before relying on one.
Statistics and arithmetic are recomputed, not judged.
Confidence bands are shown only for fields calibrated on our annotated test set. None is calibrated yet, so no band is shown.
What counts as a claim ›How we measure confidence ›How we check this ›
Are you an author, or do you see a problem with this page? Request a review
