

The DOI matches its Crossref record; 4 of the 4 references it cites were found in a registry or an index.
Systematic evaluation of DNA methylation age estimation with common preprocessing methods and the Infinium MethylationEPIC BeadChip array
Overview
The claims and statistics of this paper haven’t been checked yet.
Run the check — free, no account needed. It reads the open-access text and checks the sources it cites.
Integrity signals
Registry
Cites
Statistics
Figures
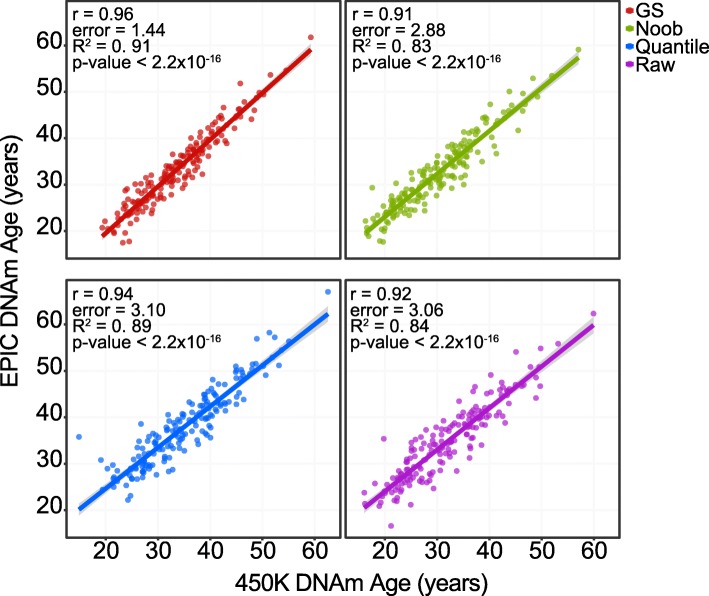
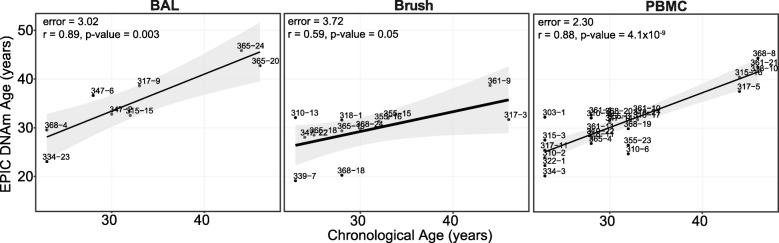
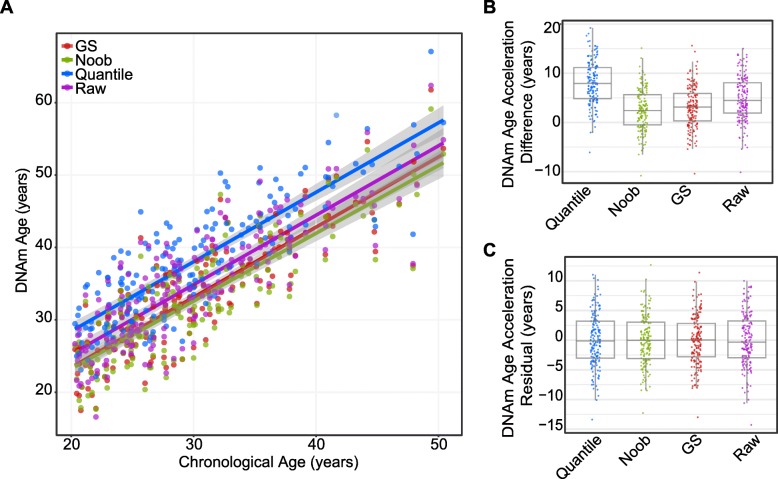
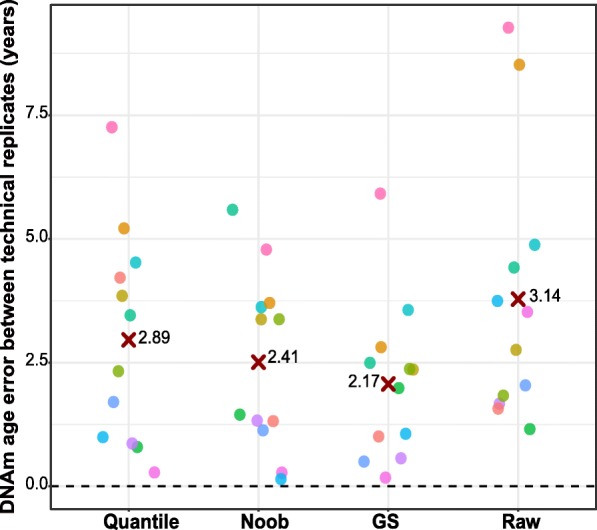
Verification
Claims the paper makes
The claims and statistics of this paper haven’t been checked yet.
Run the check — free, no account needed. It reads the open-access text and checks the sources it cites.
Claims other papers make about this one
Each is checked against this paper’s own text: does it say what the citing paper says it does?
The cited source says what the claim attributes to it.
In the citing paper
“We note that 19 CpG sites from the multi-tissue clock are missing in the Infinium MethylationEPIC array, however, the predictions are still robust when performed on NOOB normalised array data (McEwen et al., 2018).”
From Multi-omic rejuvenation of human cells by maturation phase transient reprogramming (2022) · cites this paper as McEwen et al., 2018
Self-check
Percentages, sums and reported differences re-computed from the paper’s own numbers.
The self-check needs the paper’s full text.
Citations
Cites
DNA methylation age of human tissues and cell types
Horvath, S. (2013) · Genome Biology · doi:10.1186/gb-2013-14-10-r115 · Cited by 7,075
Self-citationBocklandt, S., Lin, W., Sehl, M. E., Sánchez, F. J., Sinsheimer, J. S., Horvath, S., & Vilain, E. (2011) · PLoS ONE · doi:10.1371/journal.pone.0014821 · Cited by 1,012
Self-citationHuman body epigenome maps reveal noncanonical DNA methylation variation
Schultz, M. D., He, Y., Whitaker, J. W., Hariharan, M., Mukamel, E. A., Leung, D., Rajagopal, N., Nery, J. R., Urich, M. A., Chen, H., et al. (2015) · Nature · doi:10.1038/nature14465 · Cited by 690
Decreased epigenetic age of PBMCs from Italian semi-supercentenarians and their offspring
Horvath, S., Pirazzini, C., Bacalini, M. G., Gentilini, D., Di Blasio, A. M., Delledonne, M., Mari, D., Arosio, B., Monti, D., Passarino, G., et al. (2015) · Aging · doi:10.18632/aging.100861 · Cited by 316
Self-citation
Research works printed but not linked: 31
- Aryee MJ, et al. Minfi: a flexible and comprehensive bioconductor package for the analysis of Infinium DNA methylation microarrays. Bioinformatics. 2014;30(10):1363–9. · DOI
- Bibikova M, et al. Genome-wide DNA methylation profiling using Infinium® assay. Epigenomics. 2009;1(1):177–200. · DOI
- Breitling LP, et al. Frailty is associated with the epigenetic clock but not with telomere length in a German cohort. Clin Epigenetics. 2016;8(1):21. · DOI
- Dedeurwaerder S, et al. A comprehensive overview of Infinium HumanMethylation450 data processing. Brief Bioinform. 2014;15(6):929–41. · DOI
- Farré P, et al. Concordant and discordant DNA methylation signatures of aging in human blood and brain. Epigenetics Chromatin. 2015;8(1):19. · DOI
- Fortin JP, Triche TJ Jr, Hansen KD. Preprocessing, normalization and integration of the Illumina HumanMethylationEPIC array with minfi. Bioinformatics. 2016. · DOI
- Garagnani P, et al. Methylation of ELOVL2 gene as a new epigenetic marker of age. Aging Cell. 2012;11(6):1132–4. · DOI · Paper page
- Hannum G, et al. Genome-wide methylation profiles reveal quantitative views of human aging rates. Mol Cell. 2013;49(2):359–67. · DOI · Paper page
- Hicks SC, Irizarry RA. Quantro: a data-driven approach to guide the choice of an appropriate normalization method. Genome Biol. 2015;16(1):117. · DOI
- Horvath S, Levine AJ. HIV-1 infection accelerates age according to the epigenetic clock. J Infect Dis. 2015;212(10):1563–73. · DOI · Paper page
- Horvath S, Raj K. DNA methylation-based biomarkers and the epigenetic clock theory of ageing. Nat Rev Genetics. 2018;23:223.
- Horvath S, Ritz BR. Increased epigenetic age and granulocyte counts in the blood of Parkinson's disease patients. Aging. 2015. · DOI
- Horvath S, et al. Aging effects on DNA methylation modules in human brain and blood tissue. Genome Biol. 2012;13(10):R97. · DOI
- Horvath S, et al. An epigenetic clock analysis of race/ethnicity, sex, and coronary heart disease. Genome Biol. 2016;17(1):171. · DOI
- Husquin LT, et al. Exploring the genetic basis of human population differences in DNA methylation and their causal impact on immune gene regulation. bioRxiv. 2018:371872. · DOI
- Jones PA, Takai D. The role of DNA methylation in mammalian epigenetics. Science (New York, NY). 2001;293(5532):1068–70. · DOI
- Logue MW, et al. The correlation of methylation levels measured using Illumina 450K and EPIC BeadChips in blood samples. Epigenomics. 2017;9(11):1363–71. · DOI · Paper page
- Marioni RE, Shah S, McRae AF, Chen BH, et al. DNA methylation age of blood predicts all-cause mortality in later life. Genome Biol. 2015a;16(1):25. · DOI · Paper page
- Marioni RE, Shah S, McRae AF, Ritchie SJ, et al. The epigenetic clock is correlated with physical and cognitive fitness in the Lothian birth cohort 1936. Int J Epidemiol. 2015;44(4):1388–96. · DOI
- Moran S, Arribas C, Esteller M. Validation of a DNA methylation microarray for 850,000 CpG sites of the human genome enriched in enhancer sequences. 2015;8(3):389–99 dx. doi.org . · DOI
- Morris TJ, et al. ChAMP: 450k Chip analysis methylation pipeline. Bioinformatics. 2014;30(3):428–30. · DOI
- Novick MR, Lewis C. Coefficient alpha and the reliability of composite measurements. Psychometrika. 1967;32(1):1–13. · DOI
- Teschendorff AE, et al. A beta-mixture quantile normalization method for correcting probe design bias in Illumina Infinium 450k DNA methylation data. Bioinformatics. 2013;29(2):189–96. · DOI
- Touleimat N, Tost J. Complete pipeline for Infinium® Human Methylation 450K BeadChip data processing using subset quantile normalization for accurate DNA methylation estimation. Epigenomics. 2012;4(3):325–41. https://doi.org/10.2217/epi.12.21 . · DOI
- Triche TJ, Daniel J. Weisenberger D, Van Den B, Laird PW, Kimberly D. Siegmund; Low-level processing of Illumina Infinium DNA Methylation BeadArrays, Nucleic Acids Research. 201;41(7):e90. https://doi.org/10.1093/nar/gkt090 . · DOI
- Triche TJ Jr, et al. Low-level processing of Illumina Infinium DNA Methylation BeadArrays. Nucleic Acids Res. 2013;41(7):e90. · DOI
- Troyanskaya O, et al. Missing value estimation methods for DNA microarrays. Bioinformatics. 2001;17(6):520–5. · DOI · Paper page
- Wang T, et al. A systematic study of normalization methods for Infinium 450K methylation data using whole-genome bisulfite sequencing data. Epigenetics. 2015;10(7):662–9. · DOI
- Weidner CI, et al. Aging of blood can be tracked by DNA methylation changes at just three CpG sites. Genome Biol. 2014;15(2):R24. · DOI · Paper page
- Wilhelm-Benartzi CS, et al. Review of processing and analysis methods for DNA methylation array data. Br J Cancer. 2013;109(6):1394–402. · DOI
- Yousefi P, et al. Considerations for normalization of DNA methylation data by Illumina 450K BeadChip assay in population studies. Epigenetics. 2014;8(11):1141–52. · DOI
Cited by
Sorted by citations
Mulder, R. H., Neumann, A., Cecil, C. A. M., Walton, E., Houtepen, L. C., Simpkin, A. J., Rijlaarsdam, J., Heijmans, B. T., Gaunt, T. R., Felix, J. F., et al. (2021) · Human Molecular Genetics · doi:10.1093/hmg/ddaa280 · Cited by 165
Multi-omic rejuvenation of human cells by maturation phase transient reprogramming
Gill, D., Parry, A., Santos, F., Okkenhaug, H., Todd, C. D., Hernando-Herraez, I., Stubbs, T. M., Milagre, I., & Reik, W. (2022) · eLife · doi:10.7554/elife.71624 · Cited by 185
Zhao, W., Ammous, F., Ratliff, S., Liu, J., Yu, M., Mosley, T. H., Kardia, S. L. R., & Smith, J. A. (2019) · International Journal of Environmental Research and Public Health · doi:10.3390/ijerph16173141 · Cited by 113
DNA Methylation Age Acceleration Is Not Associated with Age of Onset in Parkinson's Disease
Gaare, J. J., Brügger, K., Nido, G. S., & Tzoulis, C. (2023) · Movement Disorders · doi:10.1002/mds.29574 · Cited by 12
Metadata
- Authors
- McEwen, L. M., Jones, M. J., Lin, D. T. S., Edgar, R. D., Husquin, L. T., MacIsaac, J. L., Ramadori, K. E., Morin, A. M., Rider, C. F., Carlsten, C., Quintana-Murci, L., Horvath, S., & Kobor, M. S.
- ORCID
- McEwen, Lisa M
- Venue
- Clinical Epigenetics
- Published
- 2018-10-16
- Volume
- 10
- Issue
- 1
- ISSN
- 1868-7075
- 1868-7083
- PMC
- PMC6192219
- Cited by
- 147
- References
- 4
- Language
- en
- Funders
- Canadian Institutes of Health Research (F15-04283)
- National Institute on Aging (U34AG051425-0)
- BC Lung Association, MITACS and the Michael Smith Foundation for Health Research
- Canada Research Chairs (CA) in Occupational and Environmental Lung Disease
- Canada Research Chairs (CA) in Social Epigenetics
- Senior Fellow of the Canadian Institute for Advanced Research
- Sunny Hill BC Leadership Chair in Child Development
- European Research Council (281297)
About these checks
Registry, retraction, Cites and statistics results are computed, not judged, with one exception: a printed reference that no index lists is read once by a model before it counts as a citation error. Claims are extracted by a model and kept only when their quote appears verbatim in the text; each cited source is then checked, with a model’s help, for whether it says what the claim relies on. Those verdicts can be wrong — read the claim’s quote and the cited source before relying on one.
Statistics and arithmetic are recomputed, not judged.
Confidence bands are shown only for fields calibrated on our annotated test set. None is calibrated yet, so no band is shown.
What counts as a claim ›How we measure confidence ›How we check this ›
Are you an author, or do you see a problem with this page? Request a review
