

The DOI matches its Crossref record; 102 of the 102 references it cites were found in a registry or an index.
Artificial intelligence framework identifies candidate targets for drug repurposing in Alzheimer’s disease
Open accessPublished version of a preprint
Abstract
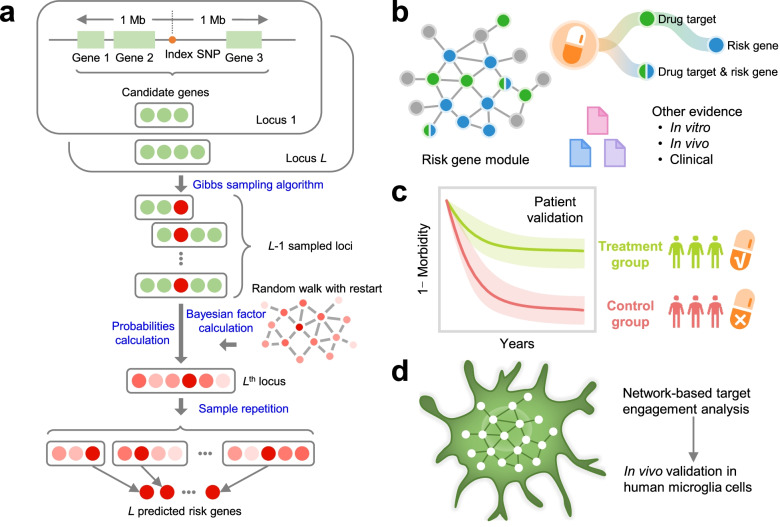
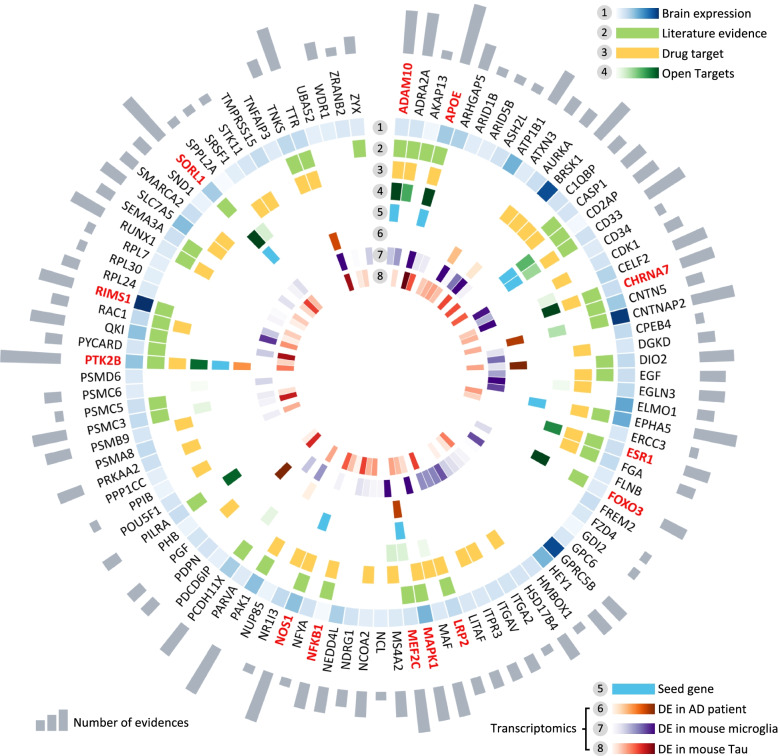
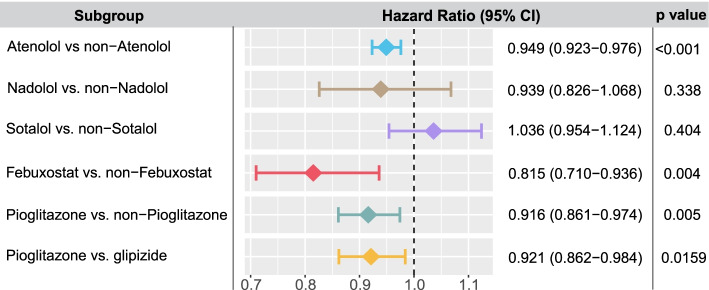
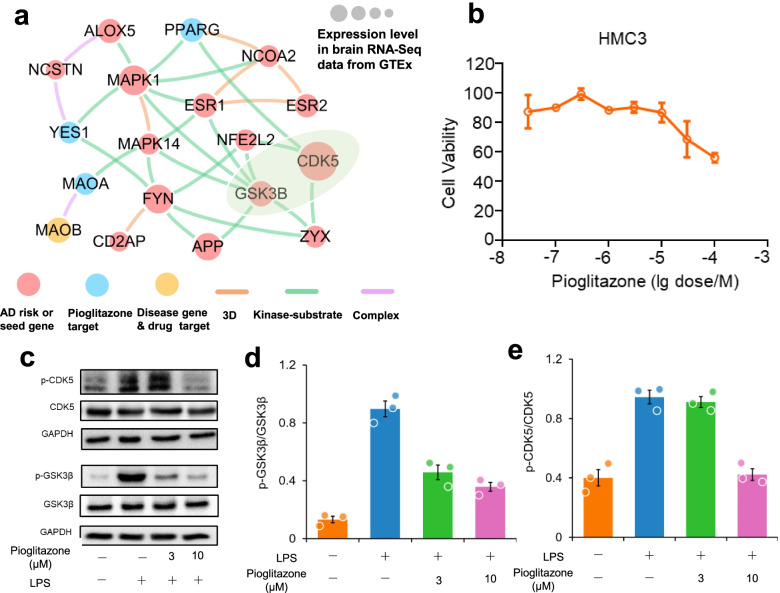
Background: Genome-wide association studies (GWAS) have identified numerous susceptibility loci for Alzheimer’s disease (AD). However, utilizing GWAS and multi-omics data to identify high-confidence AD risk genes (ARGs) and druggable targets that can guide development of new therapeutics for patients suffering from AD has heretofore not been successful. Methods: To address this critical problem in the field, we have developed a network-based artificial intelligence framework that is capable of integrating multi-omics data along with human protein–protein interactome networks to accurately infer accurate drug targets impacted by GWAS-identified variants to identify new therapeutics. When applied to AD, this approach integrates GWAS findings, multi-omics data from brain samples of AD patients and AD transgenic animal models, drug-target networks, and the human protein–protein interactome, along with large-scale patient database validation and in vitro mechanistic observations in human microglia cells. Results: Through this approach, we identified 103 ARGs validated by various levels of pathobiological evidence in AD. Via network-based prediction and population-based validation, we then showed that three drugs (pioglitazone, febuxostat, and atenolol) are significantly associated with decreased risk of AD compared with matched control populations. Pioglitazone usage is significantly associated with decreased risk of AD (hazard ratio (HR) = 0.916, 95% confidence interval [CI] 0.861–0.974, P = 0.005) in a retrospective case-control validation. Pioglitazone is a peroxisome proliferator-activated receptor (PPAR) agonist used to treat type 2 diabetes, and propensity score matching cohort studies confirmed its association with reduced risk of AD in comparison to glipizide (HR = 0.921, 95% CI 0.862–0.984, P = 0.0159), an insulin secretagogue that is also used to treat type 2 diabetes. In vitro experiments showed that pioglitazone downregulated glycogen synthase kinase 3 beta (GSK3β) and cyclin-dependent kinase (CDK5) in human microglia cells, supporting a possible mechanism-of-action for its beneficial effect in AD. Conclusions: In summary, we present an integrated, network-based artificial intelligence methodology to rapidly translate GWAS findings and multi-omics data to genotype-informed therapeutic discovery in AD.
Overview
The claims and statistics of this paper haven’t been checked yet.
Free: it reads the open-access text and checks the first 5 claims that cite a source we can check. Create a free account to check every claim.
Integrity signals
Registry
Cites
Statistics
Figures



Verification
Claims the paper makes
The claims and statistics of this paper haven’t been checked yet.
Free: it reads the open-access text and checks the first 5 claims that cite a source we can check. Create a free account to check every claim.
Claims other papers make about this one
Each is checked against this paper’s own text: does it say what the citing paper says it does?
The cited source says what the claim attributes to it.
In the citing paper
“the ability of AI to utilize genetic and multiomics data also demonstrates great potential for advancing the treatment of dementia”
From Multimodal neuroimaging and AI integration in cognitive disorders: advances, challenges, and future directions for precision medicine (2026) · cites this paper as Fang et al., 2022
The cited source says what the claim attributes to it.
In the citing paper
“The AD repurposing candidates suggested and validated by the five studies using real-world data for validation included fluticasone and mometasone (inhaled corticosteroids) (Xu et al., 2021), dexamethasone (a systemic corticosteroid) (Tang et al., 2022), pioglitazone (an antidiabetic drug) (Fang et al., 2022), febuxostat (a uric acid-lowering drug used in treatment of gout) (Fang et al., 2022),”
From Drug repurposing for Alzheimer’s disease from 2012–2022—a 10-year literature review (2023) · cites this paper as Fang et al., 2022
The cited source says what the claim attributes to it.
In the citing paper
“Four of these studies performed pharmacoepidemiologic investigations, three leveraging the MarketScan Medicare Supplementary Material (Fang et al., 2021;Xu et al., 2021;Fang et al., 2022) and the fourth utilizing Medicare claims data (Desai et al., 2022).”
From Drug repurposing for Alzheimer’s disease from 2012–2022—a 10-year literature review (2023) · cites this paper as Fang et al., 2022
Self-check
Percentages, sums and reported differences re-computed from the paper’s own numbers.
The self-check needs the paper’s full text.
Citations
Cites
WGCNA: an R package for weighted correlation network analysis
Langfelder, P., & Horvath, S. (2008) · BMC Bioinformatics · doi:10.1186/1471-2105-9-559 · Cited by 27,252
DrugBank 5.0: a major update to the DrugBank database for 2018
Wishart, D. S., Feunang, Y. D., Guo, A. C., Lo, E. J., Marcu, A., Grant, J. R., Sajed, T., Johnson, D., Li, C., Sayeeda, Z., et al. (2018) · Nucleic Acids Research · doi:10.1093/nar/gkx1037 · Cited by 8,404
Bindea, G., Mlecnik, B., Hackl, H., Charoentong, P., Tosolini, M., Kirilovsky, A., Fridman, W.-H., Pagès, F., Trajanoski, Z., & Galon, J. (2009) · Bioinformatics · doi:10.1093/bioinformatics/btp101 · Cited by 6,280
A Unique Microglia Type Associated with Restricting Development of Alzheimer’s Disease
Keren-Shaul, H., Spinrad, A., Weiner, A., Matcovitch-Natan, O., Dvir-Szternfeld, R., Ulland, T. K., David, E., Baruch, K., Lara-Astaiso, D., Toth, B., et al. (2017) · Cell · doi:10.1016/j.cell.2017.05.018 · Cited by 5,493
Meta-Analysis of 74,046 Individuals Identifies 11 New Susceptibility Loci for Alzheimer’s Disease
(EADI), E. A. D. I., Lambert, J.-C., (GERAD), G. A. E. R. I. A. D., Alzheimer's Disease Genetic Consortium (ADGC), (CHARGE), C. F. H. A. A. R. I. G. E., Ibrahim-Verbaas, C. A., Harold, D., Naj, A. C., Sims, R., Bellenguez, C., et al. (2013) · Nature Genetics · doi:10.1038/ng.2802 · Cited by 4,336 · cited 1×
“Among them, APOE , ADAM10 , and SORL1 are well-known AD risk genes, validated by large-scale genetic studies and preclinical studies [6, 59, 60].”
BackgroundAlzheimer Disease: An Update on Pathobiology and Treatment Strategies
Long, J. M., & Holtzman, D. M. (2019) · Cell · doi:10.1016/j.cell.2019.09.001 · Cited by 3,204
Alzheimer Disease Genetics Consortium (ADGC), Kunkle, B. W., The European Alzheimer’s Disease Initiative (EADI), Cohorts for Heart and Aging Research in Genomic Epidemiology Consortium (CHARGE), Genetic and Environmental Risk in AD/Defining Genetic, P. A. E. R. F. A. D. C. (., Grenier-Boley, B., Sims, R., Bis, J. C., Damotte, V., Naj, A. C., et al. (2019) · Nature Genetics · doi:10.1038/s41588-019-0358-2 · Cited by 2,946
An Expanded View of Complex Traits: From Polygenic to Omnigenic
Boyle, E. A., Li, Y. I., & Pritchard, J. K. (2017) · Cell · doi:10.1016/j.cell.2017.05.038 · Cited by 2,851
Single-cell transcriptomic analysis of Alzheimer’s disease
Mathys, H., Davila-Velderrain, J., Peng, Z., Gao, F., Mohammadi, S., Young, J. Z., Menon, M., He, L., Abdurrob, F., Jiang, X., et al. (2019) · Nature · doi:10.1038/s41586-019-1195-2 · Cited by 2,568
An atlas of active enhancers across human cell types and tissues
The FANTOM Consortium, Andersson, R., Gebhard, C., Miguel-Escalada, I., Hoof, I., Bornholdt, J., Boyd, M., Chen, Y., Zhao, X., Schmidl, C., et al. (2014) · Nature · doi:10.1038/nature12787 · Cited by 2,550
Cited by
Network-based drug repurposing for novel coronavirus 2019-nCoV/SARS-CoV-2
Zhou, Y., Hou, Y., Shen, J., Huang, Y., Martin, W., & Cheng, F. (2020) · Cell Discovery · doi:10.1038/s41421-020-0153-3 · Cited by 1,597
Self-citationDeep learning for drug repurposing: Methods, databases, and applications
Pan, X., Lin, X., Cao, D., Zeng, X., Yu, P. S., He, L., Nussinov, R., & Cheng, F. (2022) · WIREs Computational Molecular Science · doi:10.1002/wcms.1597 · Cited by 188
Self-citationZhou, Y., Xu, J., Hou, Y., Leverenz, J. B., Kallianpur, A., Mehra, R., Liu, Y., Yu, H., Pieper, A. A., Jehi, L., et al. (2021) · Alzheimer's Research & Therapy · doi:10.1186/s13195-021-00850-3 · Cited by 162
Self-citationArtificial Intelligence in Pharmaceutical Sciences
Lu, M., Yin, J., Zhu, Q., Lin, G., Mou, M., Liu, F., Pan, Z., You, N., Lian, X., Li, F., et al. (2023) · Engineering · doi:10.1016/j.eng.2023.01.014 · Cited by 156
Haghayegh, F., Norouziazad, A., Haghani, E., Feygin, A. A., Rahimi, R. H., Ghavamabadi, H. A., Sadighbayan, D., Madhoun, F., Papagelis, M., Felfeli, T., et al. (2024) · Advanced Science · doi:10.1002/advs.202400595 · Cited by 165
Metadata
- Authors
- Fang, J., Zhang, P., Wang, Q., Chiang, C.-W., Zhou, Y., Hou, Y., Xu, J., Chen, R., Zhang, B., Lewis, S. J., Leverenz, J. B., Pieper, A. A., Li, B., Li, L., Cummings, J., & Cheng, F.
- Affiliations
- Cleveland Clinic (US)
- Indiana University Indianapolis (US)
- Vanderbilt University (US)
- The Ohio State University (US)
- Case Western Reserve University (US)
- University Hospitals of Cleveland (US)
- University of Nevada, Las Vegas (US)
- Corresponding author
- Li, Bingshan
- Li, Lang
- Cheng, Feixiong
- ORCID
- Venue
- Alzheimer's Research & Therapy
- Published
- 2022-01-10
- Volume
- 14
- Issue
- 1
- Pages
- 7-7
- ISSN
- 1758-9193 (ISSN-L)
- PMC
- PMC8751379
- OpenAlex
- W4206508717
- Cited by
- 140
- References
- 102
- Citations by year
- 2026: 23 · 2025: 38 · 2024: 27 · 2023: 20 · 2022: 25
- FWCI
- 17.03
- Type
- journal article
- Language
- en
- Open access
- gold
- doi.org
- Licence
- cc-by
- creativecommons.org/licenses/by/4.0 (tdm)
- creativecommons.org/licenses/by/4.0 (vor)
- Locations
- Alzheimer s Research & Therapy (publishedVersion, cc-by)
- medRxiv (acceptedVersion)
- PubMed Central (publishedVersion, cc-by)
- PubMed (publishedVersion)
- Purdue University Indianapolis (Indiana University) (submittedVersion, other-oa)
- Digital Scholarship - UNLV (University of Nevada Reno) (submittedVersion, cc-by)
- DOAJ (DOAJ: Directory of Open Access Journals) (submittedVersion, cc-by-sa)
- eScholarship (California Digital Library) (submittedVersion, cc-by)
- IUScholarWorks (Indiana University) (submittedVersion, cc-by)
- Funders
- National Institute on Aging (R01AG066707, 3R01AG066707-01S1, R01AG069900, R35AG71476, R56AG063870, P30AG072959)
- Foundation for the National Institutes of Health (U01AG073323)
- National Institutes of Health (3R01AG066707-02S1)
- Topics
- Life Sciences › Neuroscience › Cellular and Molecular Neuroscience › Alzheimer's disease research and treatments
- Life Sciences › Pharmacology, Toxicology and Pharmaceutics › Drug Discovery › Computational Drug Discovery Methods
- Life Sciences › Biochemistry, Genetics and Molecular Biology › Molecular Biology › Bioinformatics and Genomic Networks
- Keywords
- Alzheimer's disease, drug repurposing, drug target identification, pioglitazone, febuxostat, atenolol, PPAR agonists, GSK3β, cyclin-dependent kinase 5, microglia, protein-protein interaction network, multi-omics integration, type 2 diabetes drugs, glipizide, Alzheimer's disease risk genes
- MeSH terms
- Alzheimer Disease, Animals, Artificial Intelligence, Diabetes Mellitus, Type 2, Humans, Retrospective Studies, Genome-Wide Association Study, Drug Repositioning
About these checks
Registry, retraction, Cites and statistics results are computed, not judged, with one exception: a printed reference that no index lists is read once by a model before it counts as a citation error. Claims are extracted by a model and kept only when their quote appears verbatim in the text; each cited source is then checked, with a model’s help, for whether it says what the claim relies on. Those verdicts can be wrong — read the claim’s quote and the cited source before relying on one.
Statistics and arithmetic are recomputed, not judged.
Confidence bands are shown only for fields calibrated on our annotated test set. None is calibrated yet, so no band is shown.
What counts as a claim ›How we measure confidence ›How we check this ›
Are you an author, or do you see a problem with this page? Request a review
How to cite
Cite CoChat for the checks on this page, and the paper for its own findings.
- This page
- CoChat. (2026). Citation check: Artificial intelligence framework identifies candidate targets for drug repurposing in Alzheimer’s disease. https://app.cochat.ai/papers/10.1186/s13195-021-00951-z
- The paper
- Fang, J., Zhang, P., Wang, Q., Chiang, C.-W., Zhou, Y., Hou, Y., Xu, J., Chen, R., Zhang, B., Lewis, S. J., Leverenz, J. B., Pieper, A. A., Li, B., Li, L., Cummings, J., & Cheng, F. (2022). Artificial intelligence framework identifies candidate targets for drug repurposing in Alzheimer’s disease. Alzheimer's Research & Therapy. https://doi.org/10.1186/s13195-021-00951-z
Data sources
Bibliographic data: Semantic Scholar, OpenAlex, Crossref.
Contains information from the Semantic Scholar Academic Graph Datasets, made available under the ODC Attribution License (ODC-BY 1.0).
Semantic Scholar’s data is described in: Kinney, R., et al. (2023). The Semantic Scholar Open Data Platform. arXiv:2301.10140.
