

The DOI matches its Crossref record; 3 of the 3 references it cites were found in a registry or an index.
Mesenchymal stem cells induce dendritic cell immune tolerance via paracrine hepatocyte growth factor to alleviate acute lung injury
Open accessAbstract
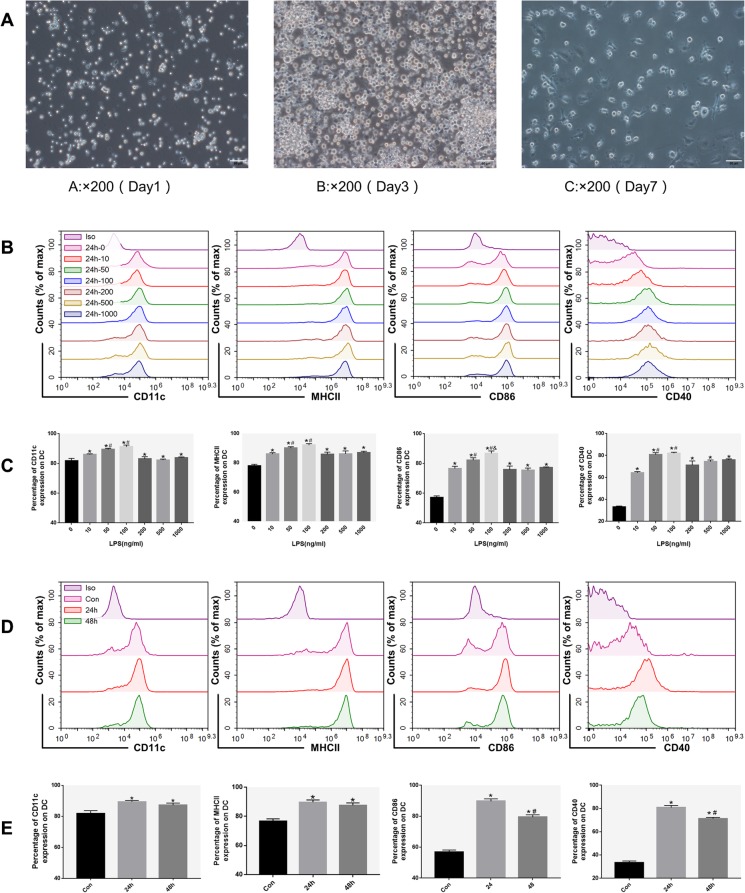
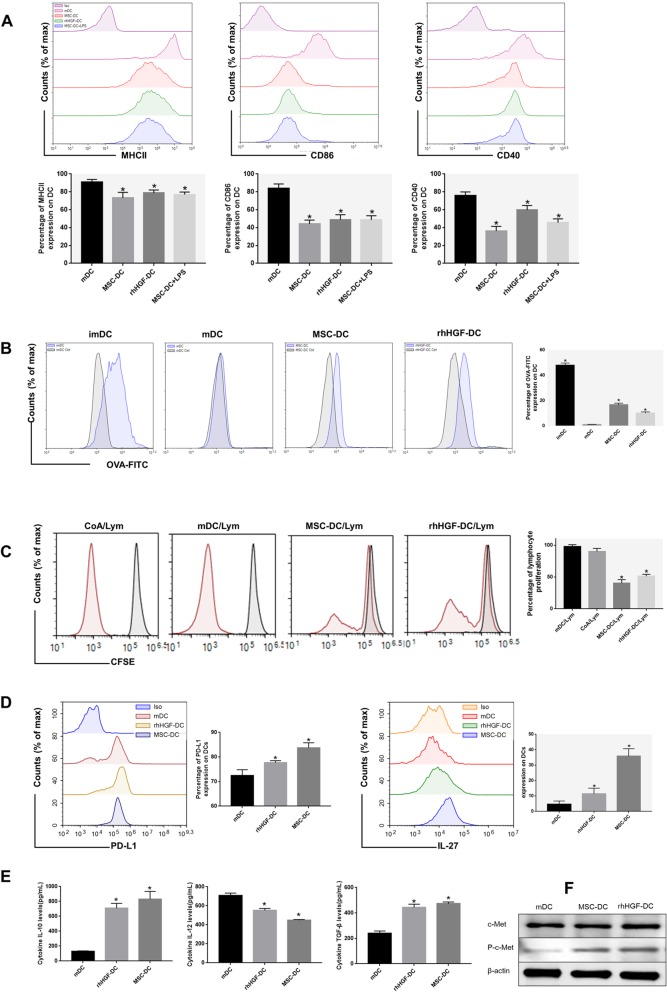
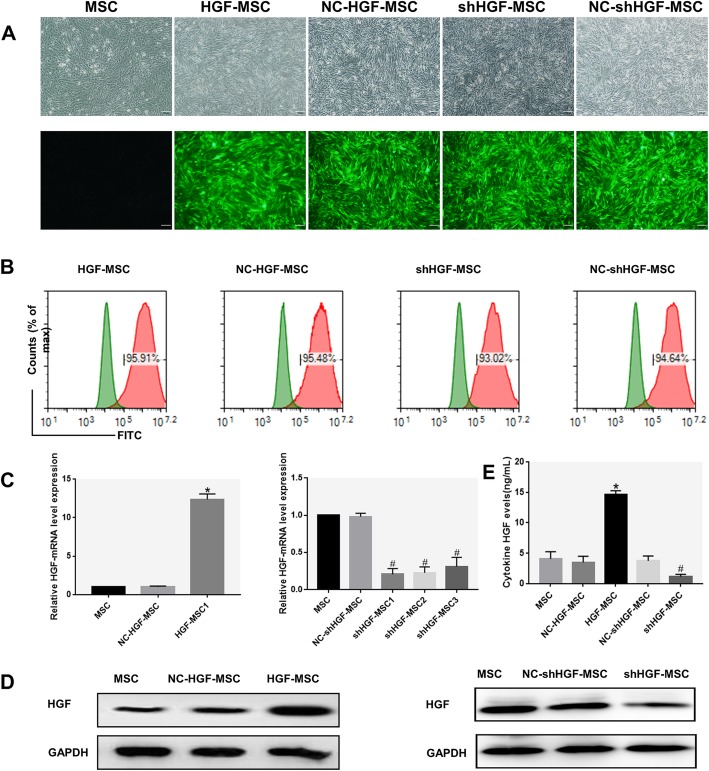
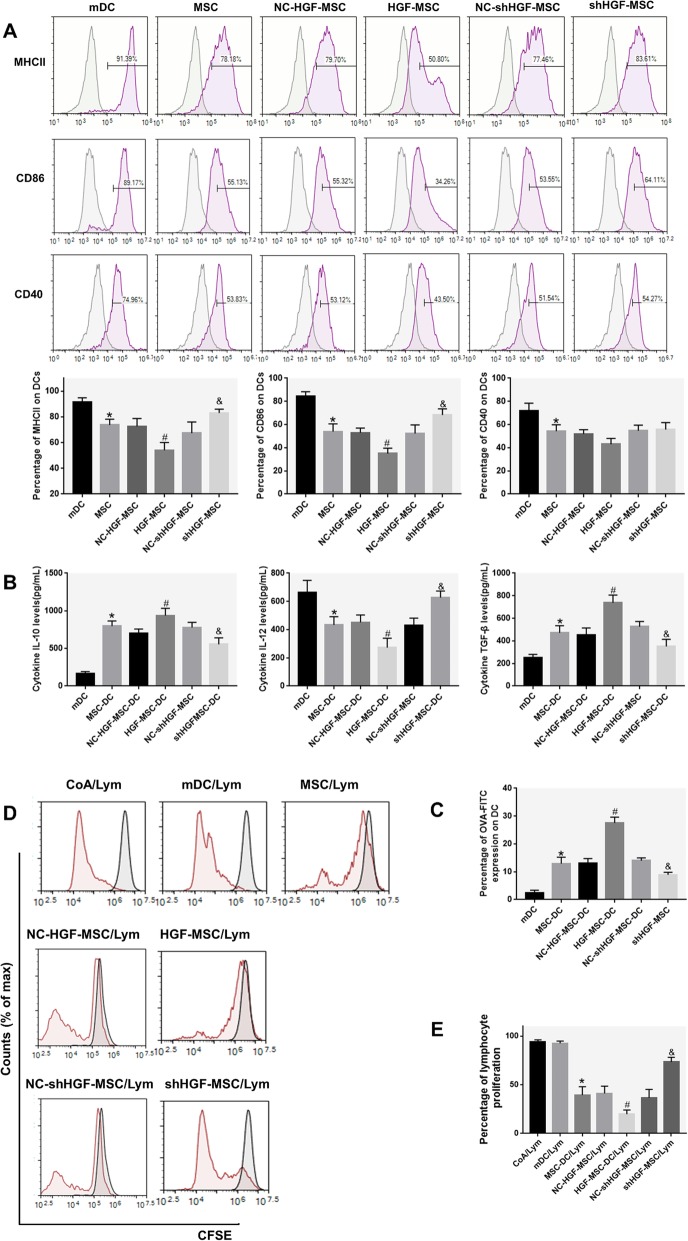
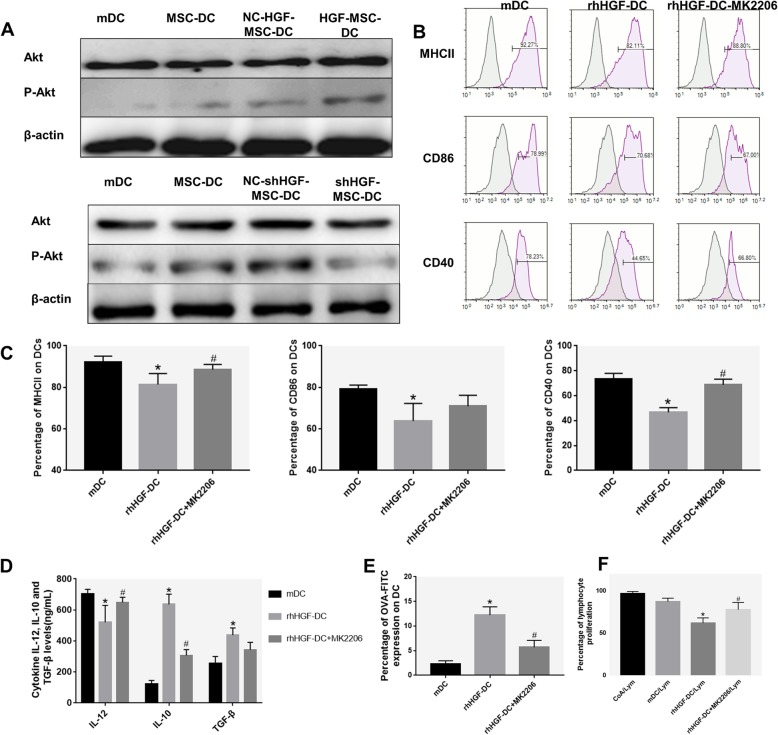
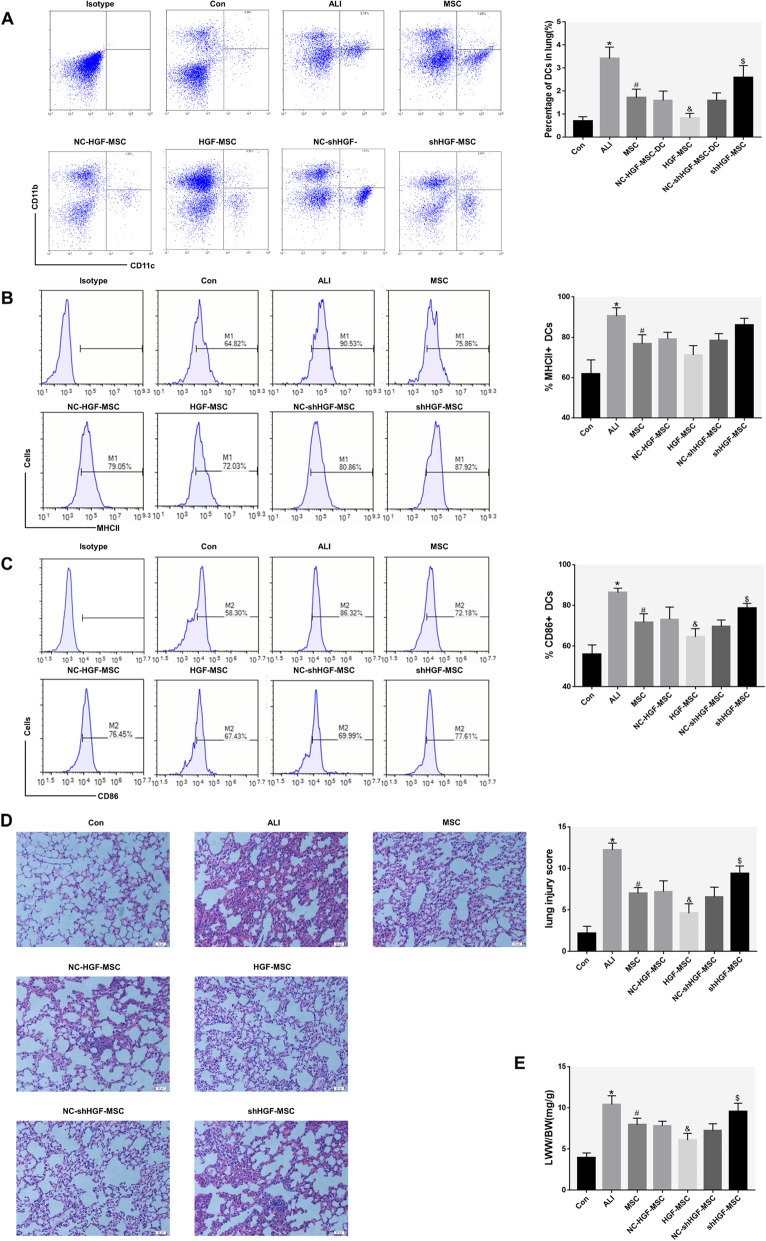
Background: Mesenchymal stem cells (MSCs) have been shown to alleviate acute lung injury (ALI) via paracrine hepatocyte growth factor (HGF) and to induce the differentiation of dendritic cells (DCs) into tolerogenic dendritic cells (DCregs) and participate in the immune response. However, whether MSCs induce the production of DCregs by secreting HGF to alleviate early ALI remains unclear. We observed that the protective effect of mouse bone marrow-derived MSCs against lipopolysaccharide (LPS)-induced ALI was achieved by inducing mature DCs (mDCs) to differentiate into DCregs, and its mechanism is related to the activation of the HGF/Akt pathway. Methods: MSCs or MSCs with overexpression or knockdown of HGF were cocultured with DCs derived from mouse bone marrow using a Transwell system for 3 days. Moreover, we used MSCs or MSCs with overexpression or knockdown of HGF to treat LPS-induced ALI mice for 24 h. Flow cytometry was performed to measure the phagocytosis, accumulation, and maturation of DCs, as well as proliferation of T cells. Lung injury was estimated by lung wet weight to body weight ratio (LWW/BW) and histopathological analysis. Furthermore, we used the Akt inhibitor MK-2206 in a coculture system to elucidate the role of the HGF/Akt pathway in regulating the differentiation of DCs into regulatory DCs and relieving lung injury in early ALI mice. Results: Immature DCs (imDCs) were induced to mature after 24 h of LPS (50 ng/ml) stimulation. MSCs or HGF induced the differentiation of mDCs into regulatory DCs characterized by low expression of MHCII, CD86, and CD40 molecules, strong phagocytic function, and the ability to inhibit T cell proliferation. The effect of MSCs on DCregs was enhanced with the increase in HGF secretion and was weakened with the decrease in HGF secretion. DCregs induced by recombinant HGF were attenuated by the Akt inhibitor MK-2206. Lung DC aggregation and mDC ratio increased in LPS-induced ALI mice, while treatment with MSCs decreased lung DC aggregation and maturation and alleviated lung pathological injury. High expression of the HGF gene enhanced the above effect of MSCs, while decreased expression of HGF weakened the above effect of MSCs. Conclusions: MSCs alleviate early ALI via paracrine HGF by inducing mDCs to differentiate into regulatory DCs. Furthermore, the mechanism of HGF-induced differentiation of mDCs into DCregs is related to the activation of the Akt pathway.
Overview
The claims and statistics of this paper haven’t been checked yet.
Run the check — free, no account needed. It reads the open-access text and checks the sources it cites.
Integrity signals
Registry
Cites
Statistics
Figures
Verification
Claims the paper makes
The claims and statistics of this paper haven’t been checked yet.
Run the check — free, no account needed. It reads the open-access text and checks the sources it cites.
Claims other papers make about this one
Each is checked against this paper’s own text: does it say what the citing paper says it does?
The cited source says what the claim attributes to it.
In the citing paper
“MSCs can also induce mature DCs to differentiate into regulatory DCs.”
From Mesenchymal stem cell secretome for regenerative medicine: Where do we stand? (2025) · cites this paper as [80]
Self-check
Percentages, sums and reported differences re-computed from the paper’s own numbers.
The self-check needs the paper’s full text.
Citations
Cites
Acute respiratory distress syndrome
Thompson, B. T., Chambers, R. C., & Liu, K. D. (2017) · New England Journal of Medicine · doi:10.1056/nejmra1608077 · Cited by 1,807
The development and function of lung-resident macrophages and dendritic cells
Kopf, M., Schneider, C., & Nobs, S. P. (2015) · Nature Immunology · doi:10.1038/ni.3052 · Cited by 555
Jahnsen, F. L., Strickland, D. H., Thomas, J. A., Tobagus, I. T., Napoli, S., Zosky, G. R., Turner, D. J., Sly, P. D., Stumbles, P. A., & Holt, P. G. (2006) · The Journal of Immunology · doi:10.4049/jimmunol.177.9.5861 · Cited by 213
Research works printed but not linked: 48
- Kido T, Muramatsu K, Asakawa T, Otsubo H, Ogoshi T, Oda K, et al. The relationship between high-dose corticosteroid treatment and mortality in acute respiratory distress syndrome: a retrospective and observational study using a nationwide administrative database in Japan. BMC Pulm Med. 2018;18:28. · DOI
- Potapov AL, Novikov N, Tumanskii VA, Babanin AA. Surfactant replacement therapy increases life-span of patients with acute respiratory distress syndrome. Klin Khir. 2013;2:57–9.
- Gebistorf F, Karam O, Wetterslev J, Afshari A. Inhaled nitric oxide for acute respiratory distress syndrome (ARDS) in children and adults. Cochrane Database Syst Rev. 2016;2016:Cd002787. · DOI
- Al-Timemy AH, Khushaba RN, Escudero J. Selecting the optimal movement subset with different pattern recognition based EMG control algorithms. Conf Proc IEEE Eng Med Biol Soc. 2016;2016:315–8.
- Lawler PR, Fan E. Heterogeneity and phenotypic stratification in acute respiratory distress syndrome. Lancet Respir Med. 2018;6:651–3. · DOI
- Samary CS, Moraes L, Santos CL, Huhle R, Santos RS, Ornellas DS, et al. Lung functional and biologic responses to variable ventilation in experimental pulmonary and extrapulmonary acute respiratory distress syndrome. Crit Care Med. 2016;44:e553–62. · DOI
- Lin S, Wu H, Wang C, Xiao Z, Xu F. Regulatory T cells and acute lung injury: cytokines, uncontrolled inflammation, and therapeutic implications. Front Immunol. 2018;9:1545. · DOI
- Fan E, Brodie D, Slutsky AS. Acute respiratory distress syndrome: advances in diagnosis and treatment. JAMA. 2018;319:698–710. · DOI
- Matthay MA, Zemans RL. The acute respiratory distress syndrome: pathogenesis and treatment. Annu Rev Pathol. 2011;6:147–63. · DOI
- Yi S, Zhai J, Niu R, Zhu G, Wang M, Liu J, et al. Eosinophil recruitment is dynamically regulated by interplay among lung dendritic cell subsets after allergen challenge. Nat Commun. 2018;9:3879. · DOI
- Buttignol M, Pires-Neto RC, Rossi ESRC, Albino MB, Dolhnikoff M, Mauad T. Airway and parenchyma immune cells in influenza a(H1N1)pdm09 viral and non-viral diffuse alveolar damage. Respir Res. 2017;18:147. · DOI
- Liu J, Zhang PS, Yu Q, Liu L, Yang Y, Guo FM, et al. Losartan inhibits conventional dendritic cell maturation and Th1 and Th17 polarization responses: novel mechanisms of preventive effects on lipopolysaccharide-induced acute lung injury. Int J Mol Med. 2012;29:269–76. · DOI
- Bantsimba-Malanda C, Marchal-Somme J, Goven D, Freynet O, Michel L, Crestani B, et al. A role for dendritic cells in bleomycin-induced pulmonary fibrosis in mice? Am J Respir Crit Care Med. 2010;182:385–95. · DOI
- Dong L, He HL, Lu XM, Yang Y, Qiu HB. Modulation of FLT3 signaling targets conventional dendritic cells to attenuate acute lung injury. Apmis. 2012;120:808–18. · DOI
- Liu Y, Yin Z, Zhang R, Yan K, Chen L, Chen F, et al. MSCs inhibit bone marrow-derived DC maturation and function through the release of TSG-6. Biochem Biophys Res Commun. 2014;450:1409–15. · DOI
- Djouad F, Charbonnier LM, Bouffi C, Louis-Plence P, Bony C, Apparailly F, et al. Mesenchymal stem cells inhibit the differentiation of dendritic cells through an interleukin-6-dependent mechanism. Stem Cells. 2007;25:2025–32. · DOI
- Zhang B, Liu R, Shi D, Liu X, Chen Y, Dou X, et al. Mesenchymal stem cells induce mature dendritic cells into a novel Jagged-2-dependent regulatory dendritic cell population. Blood. 2009;113:46–57. · DOI
- Deng Y, Yi S, Wang G, Cheng J, Zhang Y, Chen W, et al. Umbilical cord-derived mesenchymal stem cells instruct dendritic cells to acquire tolerogenic phenotypes through the IL-6-mediated upregulation of SOCS1. Stem Cells Dev. 2014;23:2080–92. · DOI
- Jiang XX, Zhang Y, Liu B, Zhang SX, Wu Y, Yu XD, et al. Human mesenchymal stem cells inhibit differentiation and function of monocyte-derived dendritic cells. Blood. 2005;105:4120–6. · DOI
- Jackson MV, Morrison TJ, Doherty DF, Mcauley DF, Matthay MA, Kissenpfennig A, et al. Mitochondrial transfer via tunneling nanotubes is an important mechanism by which mesenchymal stem cells enhance macrophage phagocytosis in the in vitro and in vivo models of ARDS. Stem Cells. 2016;34:2210–23. · DOI · Paper page
- Lee FY, Chen KH, Wallace CG, Sung PH, Sheu JJ, Chung SY, et al. Xenogeneic human umbilical cord-derived mesenchymal stem cells reduce mortality in rats with acute respiratory distress syndrome complicated by sepsis. Oncotarget. 2017;8:45626–42. · DOI
- Liu L, He H, Liu A, Xu J, Han J, Chen Q, et al. Therapeutic effects of bone marrow-derived mesenchymal stem cells in models of pulmonary and extrapulmonary acute lung injury. Cell Transplant. 2015;24:2629–42. · DOI
- He H, Liu L, Chen Q, Liu A, Cai S, Yang Y, et al. Mesenchymal stem cells overexpressing angiotensin-converting enzyme 2 rescue lipopolysaccharide-induced lung injury. Cell Transplant. 2015;24:1699–715. · DOI
- Hu S, Li J, Xu X, Liu A, He H, Xu J, et al. The hepatocyte growth factor-expressing character is required for mesenchymal stem cells to protect the lung injured by lipopolysaccharide in vivo. Stem Cell Res Ther. 2016;7:66. · DOI
- Yang Y, Chen QH, Liu AR, Xu XP, Han JB, Qiu HB. Synergism of MSC-secreted HGF and VEGF in stabilising endothelial barrier function upon lipopolysaccharide stimulation via the Rac1 pathway. Stem Cell Res Ther. 2015;6:250. · DOI
- Benkhoucha M, Molnarfi N, Dunand-Sauthier I, Merkler D, Schneiter G, Bruscoli S, et al. Hepatocyte growth factor limits autoimmune neuroinflammation via glucocorticoid-induced leucine zipper expression in dendritic cells. J Immunol. 2014;193:2743–52. · DOI
- Baek JH, Birchmeier C, Zenke M, Hieronymus T. The HGF receptor/met tyrosine kinase is a key regulator of dendritic cell migration in skin immunity. J Immunol. 2012;189:1699–707. · DOI
- Okunishi K, Dohi M, Nakagome K, Tanaka R, Mizuno S, Matsumoto K, et al. A novel role of hepatocyte growth factor as an immune regulator through suppressing dendritic cell function. J Immunol. 2005;175:4745–53. · DOI
- Benkhoucha M, Santiago-Raber ML, Schneiter G, Chofflon M, Funakoshi H, Nakamura T, et al. Hepatocyte growth factor inhibits CNS autoimmunity by inducing tolerogenic dendritic cells and CD25+Foxp3+ regulatory T cells. Proc Natl Acad Sci U S A. 2010;107:6424–9. · DOI
- Lutz MB, Kukutsch N, Ogilvie AL, Rossner S, Koch F, Romani N, et al. An advanced culture method for generating large quantities of highly pure dendritic cells from mouse bone marrow. J Immunol Methods. 1999;223:77–92. · DOI
- Cai SX, Liu AR, Chen S, He HL, Chen QH, Xu JY, et al. Activation of Wnt/beta-catenin signalling promotes mesenchymal stem cells to repair injured alveolar epithelium induced by lipopolysaccharide in mice. Stem Cell Res Ther. 2015;6:65. · DOI
- Chen QH, Liu AR, Qiu HB, Yang Y. Interaction between mesenchymal stem cells and endothelial cells restores endothelial permeability via paracrine hepatocyte growth factor in vitro. Stem Cell Res Ther. 2015;6:44. · DOI
- Chen TH, Wang JJ. Niacin pretreatment attenuates ischemia and reperfusion of pancreas-induced acute pancreatitis and remote lung injury through suppressing oxidative stress and inflammation and activation of SIRT1. Transplant Proc. 2018;50:2860–3. · DOI
- Cook PC, Macdonald AS. Dendritic cells in lung immunopathology. Semin Immunopathol. 2016;38:449–60. · DOI
- Vermaelen K, Pauwels R. Pulmonary dendritic cells. Am J Respir Crit Care Med. 2005;172:530–51. · DOI
- Howell MD, Davis AM. Management of ARDS in adults. Jama. 2018;319:711–2. · DOI
- Ware LB, Matthay MA. Keratinocyte and hepatocyte growth factors in the lung: roles in lung development, inflammation, and repair. Am J Physiol Lung Cell Mol Physiol. 2002;282:L924–40. · DOI
- Lindsay CD. Novel therapeutic strategies for acute lung injury induced by lung damaging agents: the potential role of growth factors as treatment options. Hum Exp Toxicol. 2011;30:701–24. · DOI
- Mcauley DF, Cross LM, Hamid U, Gardner E, Elborn JS, Cullen KM, et al. Keratinocyte growth factor for the treatment of the acute respiratory distress syndrome (KARE): a randomised, double-blind, placebo-controlled phase 2 trial. Lancet Respir Med. 2017;5:484–91. · DOI
- Ito Y, Correll K, Schiel JA, Finigan JH, Prekeris R, Mason RJ. Lung fibroblasts accelerate wound closure in human alveolar epithelial cells through hepatocyte growth factor/c-met signaling. Am J Physiol Lung Cell Mol Physiol. 2014;307:L94–105. · DOI
- Yogev N, Frommer F, Lukas D, Kautz-Neu K, Karram K, Ielo D, et al. Dendritic cells ameliorate autoimmunity in the CNS by controlling the homeostasis of PD-1 receptor(+) regulatory T cells. Immunity. 2012;37:264–75. · DOI · Paper page
- Di Nicola M, Carlo-Stella C, Magni M, Milanesi M, Longoni PD, Matteucci P, et al. Human bone marrow stromal cells suppress T-lymphocyte proliferation induced by cellular or nonspecific mitogenic stimuli. Blood. 2002;99:3838–43. · DOI · Paper page
- Singhal E, Sen P. Hepatocyte growth factor-induced c-Src-phosphatidylinositol 3-kinase-AKT-mammalian target of rapamycin pathway inhibits dendritic cell activation by blocking IkappaB kinase activity. Int J Biochem Cell Biol. 2011;43:1134–46. · DOI
- Wang H, Zheng R, Chen Q, Shao J, Yu J, Hu S. Mesenchymal stem cells microvesicles stabilize endothelial barrier function partly mediated by hepatocyte growth factor (HGF). Stem Cell Res Ther. 2017;8:211. · DOI
- Shi B, Qi J, Yao G, Feng R, Zhang Z, Wang D, et al. Mesenchymal stem cell transplantation ameliorates Sjogren’s syndrome via suppressing IL-12 production by dendritic cells. Stem Cell Res Ther. 2018;9:308. · DOI
- Sato K, Yamashita N, Baba M, Matsuyama T. Modified myeloid dendritic cells act as regulatory dendritic cells to induce anergic and regulatory T cells. Blood. 2003;101:3581–9. · DOI
- Singhal E, Kumar P, Sen P. A novel role for Bruton’s tyrosine kinase in hepatocyte growth factor-mediated immunoregulation of dendritic cells. J Biol Chem. 2011;286:32054–63. · DOI
- Manning BD, Toker A. AKT/PKB signaling: navigating the network. Cell. 2017;169:381–405. · DOI · Paper page
Cited by
Sorted by citations
Immunomodulatory properties of mesenchymal stromal cells: an update
Müller, L., Tunger, A., Wobus, M., von Bonin, M., Towers, R., Bornhäuser, M., Dazzi, F., Wehner, R., & Schmitz, M. (2021) · Frontiers in Cell and Developmental Biology · doi:10.3389/fcell.2021.637725 · Cited by 205
Mesenchymal stem cell secretome for regenerative medicine: Where do we stand?
Trigo, C. M., Rodrigues, J. S., Camões, S. P., Solá, S., & Miranda, J. P. (2025) · Journal of Advanced Research · doi:10.1016/j.jare.2024.05.004 · Cited by 252
“However, the mechanism and the main released factors responsible for this immunomodulation effect need further investigation [80].”
Mesenchymal stem cell homing to improve therapeutic efficacy in liver disease
Yuan, M., Hu, X., Yao, L., Jiang, Y., & Li, L. (2022) · Stem Cell Research & Therapy · doi:10.1186/s13287-022-02858-4 · Cited by 89
Metadata
- Authors
- Lu, Z., Chang, W., Meng, S., Xu, X., Xie, J., Guo, F., Yang, Y., Qiu, H., & Liu, L.
- Affiliations
- Zhongda Hospital Southeast University (CN)
- Corresponding author
- Liu, Ling
- ORCID
- Venue
- Stem Cell Research & Therapy
- Published
- 2019-12
- Volume
- 10
- Issue
- 1
- Pages
- 372-372
- ISSN
- 1757-6512 (ISSN-L)
- PMC
- PMC6894226
- OpenAlex
- W2992845257
- Cited by
- 146
- References
- 3
- Citations by year
- 2026: 9 · 2025: 16 · 2024: 17 · 2023: 24 · 2022: 29 · 2021: 31 · 2020: 20
- FWCI
- 11.10
- Type
- journal article
- Language
- en
- Open access
- gold
- doi.org
- Licence
- Locations
- Stem Cell Research & Therapy (publishedVersion, cc-by)
- PubMed Central (publishedVersion, cc-by)
- PubMed (publishedVersion)
- DOAJ (DOAJ: Directory of Open Access Journals) (submittedVersion, cc-by-sa)
- Funders
- National Natural Science Foundation of China (81670074, 81000822, and 81871602)
- Topics
- Life Sciences › Biochemistry, Genetics and Molecular Biology › Cell Biology › Mesenchymal stem cell research
- Life Sciences › Immunology and Microbiology › Immunology › Immunotherapy and Immune Responses
- Health Sciences › Medicine › Pulmonary and Respiratory Medicine › Respiratory Support and Mechanisms
- Keywords
- mesenchymal stem cells, acute lung injury, hepatocyte growth factor, dendritic cells, regulatory dendritic cells, immune tolerance, lipopolysaccharide-induced lung injury, T cell proliferation, MK-2206, paracrine signaling, bone marrow-derived stem cells, lung repair, phagocytosis, dendritic cell maturation
- MeSH terms
- Animals, Cell Differentiation, Dendritic Cells, Heterocyclic Compounds, 3-Ring, Immune Tolerance, Lipopolysaccharides, Lung, Male, Mice, Inbred BALB C, Mice, Inbred C57BL, Signal Transduction, Hepatocyte Growth Factor, Coculture Techniques, Paracrine Communication, Mesenchymal Stem Cell Transplantation, Cell Proliferation, Proto-Oncogene Proteins c-akt, Mice, Acute Lung Injury, Mesenchymal Stem Cells
About these checks
Registry, retraction, Cites and statistics results are computed, not judged, with one exception: a printed reference that no index lists is read once by a model before it counts as a citation error. Claims are extracted by a model and kept only when their quote appears verbatim in the text; each cited source is then checked, with a model’s help, for whether it says what the claim relies on. Those verdicts can be wrong — read the claim’s quote and the cited source before relying on one.
Statistics and arithmetic are recomputed, not judged.
Confidence bands are shown only for fields calibrated on our annotated test set. None is calibrated yet, so no band is shown.
What counts as a claim ›How we measure confidence ›How we check this ›
Are you an author, or do you see a problem with this page? Request a review
