Cited by 5Liver physiology and pathologyOrgan Transplantation Techniques and OutcomesTissue Engineering and Regenerative Medicine

The DOI matches its Crossref record; 67 of the 67 references it cites were found in a registry or an index.

Kupffer cells abrogate homing and repopulation of allogeneic hepatic progenitors in injured liver site

Open access

Abstract

Background: Allogeneic hepatocyte transplantation is an emerging approach to treat acute liver defects. However, durable engraftment of the transplanted cells remains a daunting task, as they are actively cleared by the recipient’s immune system. Therefore, a detailed understanding of the innate or adaptive immune cells-derived responses against allogeneic transplanted hepatic cells is the key to rationalize cell-based therapies. Methods: Here, we induced an acute inflammatory regenerative niche (3–96 h) on the surface of the liver by the application of cryo-injury (CI) to systematically evaluate the innate immune response against transplanted allogeneic hepatic progenitors in a sustained micro-inflammatory environment. Results: The resulting data highlighted that the injured site was significantly repopulated by alternating numbers of innate immune cells, including neutrophils, monocytes and Kupffer cells (KCs), from 3 to 96 h. The transplanted allo-HPs, engrafted 6 h post-injury, were collectively eliminated by the innate immune response within 24 h of transplantation. Selective depletion of the KCs demonstrated a delayed recruitment of monocytes from day 2 to day 6. In addition, the intrasplenic engraftment of the hepatic progenitors 54 h post-transplantation was dismantled by KCs, while a time-dependent better survival and translocation of the transplanted cells into the injured site could be observed in samples devoid of KCs. Conclusion: Overall, this study provides evidence that KCs ablation enables a better survival and integration of allo-HPs in a sustained liver inflammatory environment, having implications for rationalizing the cell-based therapeutic interventions against liver defects.

Overview

The claims and statistics of this paper haven’t been checked yet.

Run the check — free, no account needed. It reads the open-access text and checks the sources it cites.

A few free checks a day · papers already verified open instantly · results are public

Integrity signals

Registry

Crossref · 10.1186/s13287-024-03656-w

Cites

67 of 67 references verified0 citation errors · 0 not checkable

Statistics

Figures

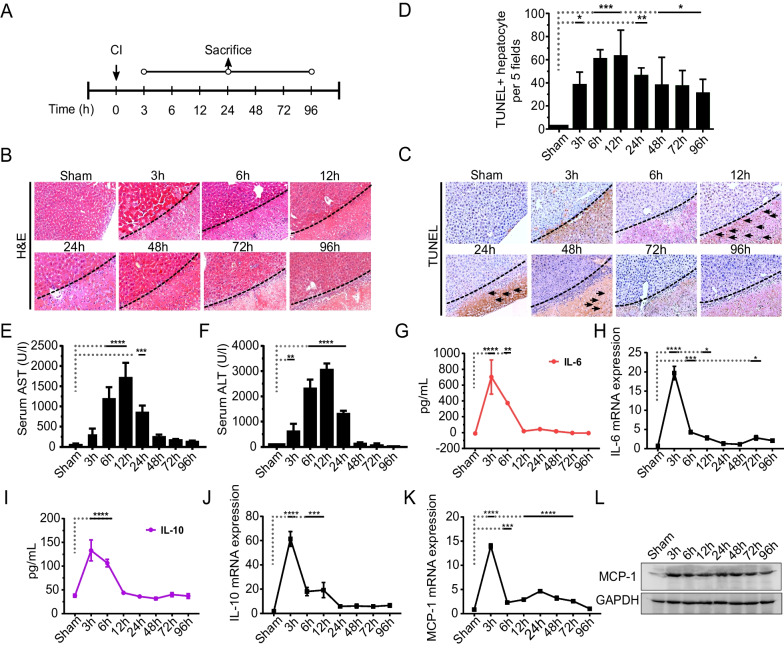
Fig. 1 Generation of a regenerative niche by cryo-injury (CI). A The experimental design of induction of CI and sample collection at various time intervals is shown. B Representative H&E staining images of the sham and samples after CI. The dotted line indicates the boundary of the healthy and injured liver tissue. C Representative images from TUNEL assay, arrows indicate random necrotic hepatocytes after CI. D TUNEL staining was quantified by counting apoptotic hepatic nuclei in 5 random views at 40 × magnification as shown at indicated time intervals. Data are presented as mean ± SD, *p < 0.05, **p < 0.01 ***p < 0.001, n = 3/24 for each time point, scale bars: 100 µm. E, F Serum aspartate aminotransferase (AST) and alanine aminotransferase (ALT) analyses from mice with or without CI. G, H Interleukin-6 (IL-6) ELISA and IL-6 mRNA gene expression from the injured and non-injured liver is represented. I, J Interleukin-10 (IL-10) ELISA and IL-10 mRNA gene expression levels are shown. K, L Monocyte chemoattractant protein—1(MCP-1) mRNA gene expression and representative cropped immunoblot analyses from injured liver tissues, respectively. The corresponding full length immunoblot can be found in supplementary figure S4. Data represented as mean ± SD, *p < 0.05, **p < 0.01 ***p < 0.001, ****p < 0.0001., n = 3/24 per time point
Fig. 1 Generation of a regenerative niche by cryo-injury (CI). A The experimental design of induction of CI and sample collection at various time intervals is shown. B Representative H&E staining images of the sham and samples after CI. The dotted line indicates the boundary of the healthy and injured liver tissue. C Representative images from TUNEL assay, arrows indicate random necrotic hepatocytes after CI. D TUNEL staining was quantified by counting apoptotic hepatic nuclei in 5 random views at 40 × magnification as shown at indicated time intervals. Data are presented as mean ± SD, *p < 0.05, **p < 0.01 ***p < 0.001, n = 3/24 for each time point, scale bars: 100 µm. E, F Serum aspartate aminotransferase (AST) and alanine aminotransferase (ALT) analyses from mice with or without CI. G, H Interleukin-6 (IL-6) ELISA and IL-6 mRNA gene expression from the injured and non-injured liver is represented. I, J Interleukin-10 (IL-10) ELISA and IL-10 mRNA gene expression levels are shown. K, L Monocyte chemoattractant protein—1(MCP-1) mRNA gene expression and representative cropped immunoblot analyses from injured liver tissues, respectively. The corresponding full length immunoblot can be found in supplementary figure S4. Data represented as mean ± SD, *p < 0.05, **p < 0.01 ***p < 0.001, ****p < 0.0001., n = 3/24 per time pointCC BY · PubMed Central
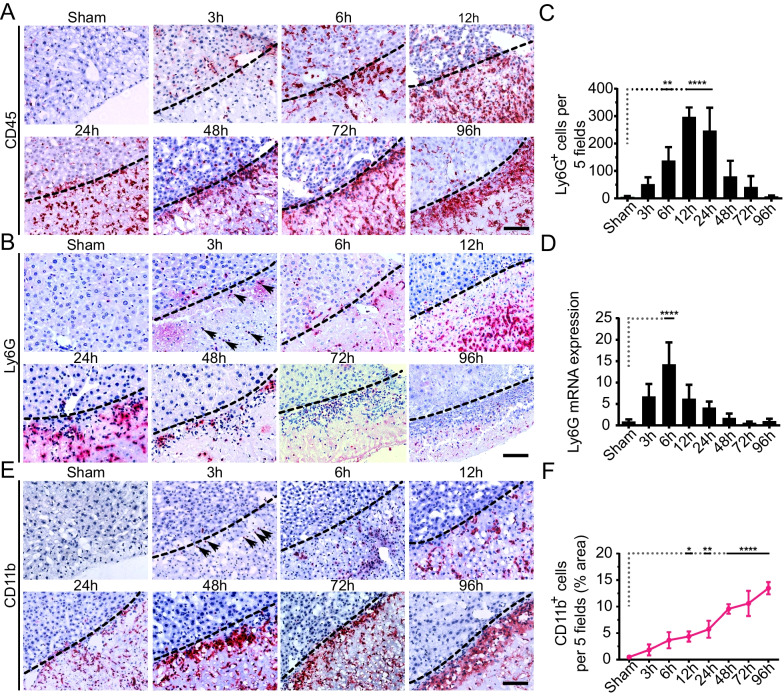
Fig. 2 The sequential recruitment of neutrophils and monocytes into the injured site post-CI. A Representative images for pan-CD45 + (leukocytes) cells at specified time points post-CI. The dotted line represents the boundary of the injured site. B Representative IHC staining images of Ly6G + cells at the indicated time intervals. C Quantitation of Ly6G+ cells fields are shown. Ly6G+ cells were quantified in 5 random fields by quantifying positive cells per sample, n = 3/24 per time point. The data were averaged and presented as mean ± SD. **P < 0.01, ****p < 0.0001. D mRNA expression of Ly6G at the injured liver as compared to sham control. E Representative images for CD11b+ immunostaining showing monocyte trafficking at the injured site at the indicated time intervals. F Quantitation of CD11b+ cells per 5 fields is shown. CD11b+ cells are quantified by quantifying positive pixels in 5 random fields, averaged, and presented as mean ± SD of the positive area. n = 3/24 per time point. *p < 0.05, **p < 0.01, ****p < 0.0001. Scale bars 100 µm. Arrows (in B and E) indicate the infiltration of neutrophils (Ly6G+) or monocytes (CD11b+) at 3 h
Fig. 2 The sequential recruitment of neutrophils and monocytes into the injured site post-CI. A Representative images for pan-CD45 + (leukocytes) cells at specified time points post-CI. The dotted line represents the boundary of the injured site. B Representative IHC staining images of Ly6G + cells at the indicated time intervals. C Quantitation of Ly6G+ cells fields are shown. Ly6G+ cells were quantified in 5 random fields by quantifying positive cells per sample, n = 3/24 per time point. The data were averaged and presented as mean ± SD. **P < 0.01, ****p < 0.0001. D mRNA expression of Ly6G at the injured liver as compared to sham control. E Representative images for CD11b+ immunostaining showing monocyte trafficking at the injured site at the indicated time intervals. F Quantitation of CD11b+ cells per 5 fields is shown. CD11b+ cells are quantified by quantifying positive pixels in 5 random fields, averaged, and presented as mean ± SD of the positive area. n = 3/24 per time point. *p < 0.05, **p < 0.01, ****p < 0.0001. Scale bars 100 µm. Arrows (in B and E) indicate the infiltration of neutrophils (Ly6G+) or monocytes (CD11b+) at 3 hCC BY · PubMed Central
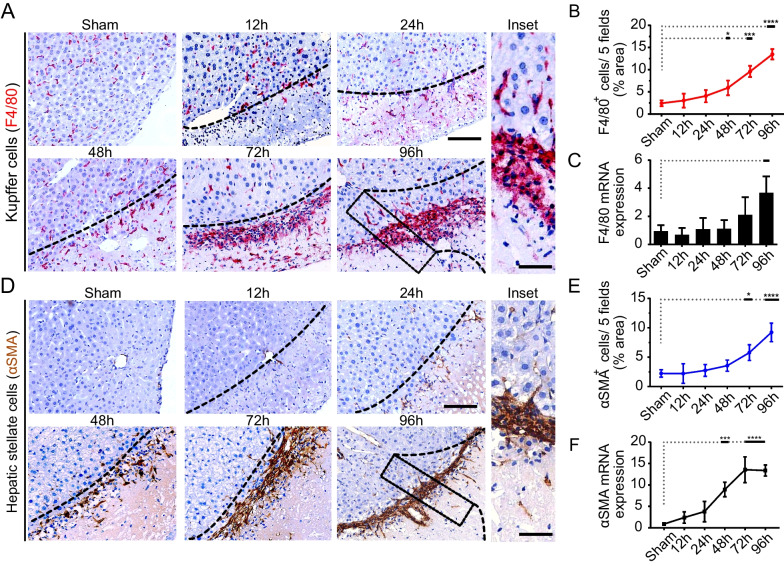
Fig. 3 KCs accumulation at the injured site induces recruitment of HSCs mediating liver repair response. A Representative IHC images for F4/80+ cells (KCs) at indicated time intervals. Scale bars 100 µm (inset = 50 µm). B, C Quantitation of IHC images of F4/80+ cells, and F4/80 mRNA gene expression, respectively. F4/80 + cells are quantified by quantifying positive pixels in 5 random fields, averaged, and presented as mean ± SD. n = 3/24 per time point. Scale bars 100 µm, n = 3/24 per group. *P < 0.05, ***p < 0.001, and ****p < 0.0001. D Representative IHC images for αSMA expression indicating preliminary activation of HSCs at 24 h and subsequent time intervals. Scale bars 100 µm (inset = 50 µm). E, F Quantitation of αSMA+ cells (quantified by quantifying positive pixels in 5 random fields, averaged, and presented as mean ± SD. n = 3/24 per time point. Scale bars 100 µm, n = 3/24 per group. *P < 0.05, and ****p < 0.0001) and αSMA mRNA gene expression at indicated time intervals, respectively. αSMA mRNA data represented as mean ± SD, ***p < 0.001, and ****p < 0.0001., n = 3/24 per group
Fig. 3 KCs accumulation at the injured site induces recruitment of HSCs mediating liver repair response. A Representative IHC images for F4/80+ cells (KCs) at indicated time intervals. Scale bars 100 µm (inset = 50 µm). B, C Quantitation of IHC images of F4/80+ cells, and F4/80 mRNA gene expression, respectively. F4/80 + cells are quantified by quantifying positive pixels in 5 random fields, averaged, and presented as mean ± SD. n = 3/24 per time point. Scale bars 100 µm, n = 3/24 per group. *P < 0.05, ***p < 0.001, and ****p < 0.0001. D Representative IHC images for αSMA expression indicating preliminary activation of HSCs at 24 h and subsequent time intervals. Scale bars 100 µm (inset = 50 µm). E, F Quantitation of αSMA+ cells (quantified by quantifying positive pixels in 5 random fields, averaged, and presented as mean ± SD. n = 3/24 per time point. Scale bars 100 µm, n = 3/24 per group. *P < 0.05, and ****p < 0.0001) and αSMA mRNA gene expression at indicated time intervals, respectively. αSMA mRNA data represented as mean ± SD, ***p < 0.001, and ****p < 0.0001., n = 3/24 per groupCC BY · PubMed Central
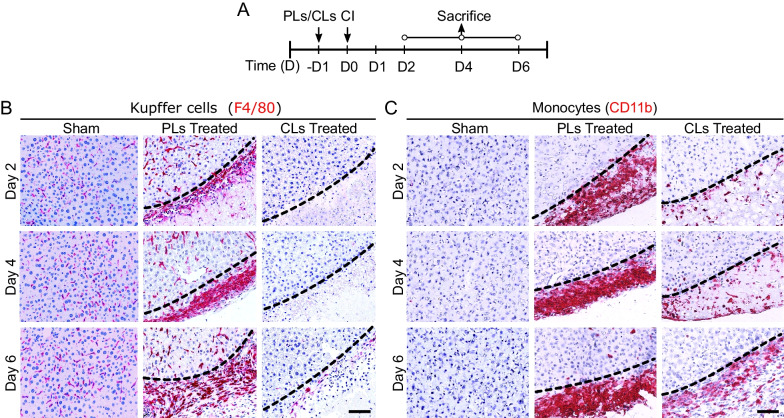
Fig. 4 Depletion of Kupffer cells (KCs) substantially reduces the recruitment of monocytes from blood. A Experimental design of intravenous injection of either PBS liposomes (PLs) or Clodronate liposomes (CLs), induction of CI procedures and samples collection at specified time intervals. B Representative images of depletion of KCs shown in CLs-treated samples in comparison to PLs-treated and sham sections. KCs after depletion began to reappear at the injury site at day 6 post-CI. C Effect of KCs depletion on monocytes in PLs/CLs-treated samples as compared to sham samples. CLs treatment delayed the recruitment of monocytes, scale bar 100 µm, n = 3/27 per time point
Fig. 4 Depletion of Kupffer cells (KCs) substantially reduces the recruitment of monocytes from blood. A Experimental design of intravenous injection of either PBS liposomes (PLs) or Clodronate liposomes (CLs), induction of CI procedures and samples collection at specified time intervals. B Representative images of depletion of KCs shown in CLs-treated samples in comparison to PLs-treated and sham sections. KCs after depletion began to reappear at the injury site at day 6 post-CI. C Effect of KCs depletion on monocytes in PLs/CLs-treated samples as compared to sham samples. CLs treatment delayed the recruitment of monocytes, scale bar 100 µm, n = 3/27 per time pointCC BY · PubMed Central
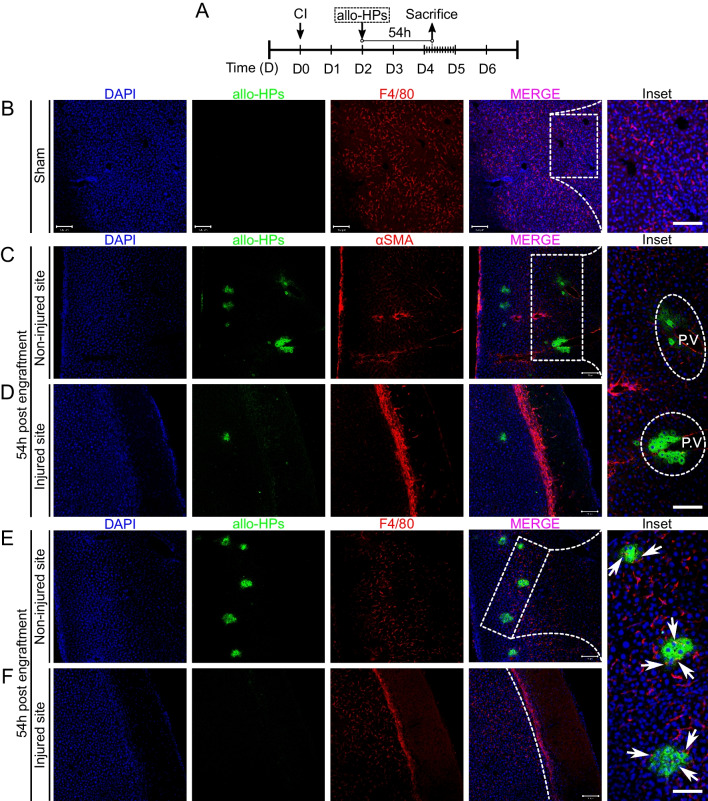
Fig. 5 KCs hindrance affects the translocation of allo-HPs in the sinusoids. A Experimental design: CI was induced at day 0 (D0), and GFP tag allo-HPs were engrafted 48 h after induction of CI in wild-type C57 mice. Samples were subsequently collected 54 h post-engraftment. B Representative images of sham-treated liver samples post-transplantation are shown. Scale bars 100 µm (inset = 50 µm). C Transplanted allo-HPs were localized in the portal vein (PV) at the non-injured site. Scale bars 100 µm (inset = 50 µm). D Very few allo-HPs were detected at the vicinity of the injured site. E KCs dismantle allo-HPs in the sinusoids (inset = 50 µm, non-injured site). The arrows indicate KCs invading the clusters of allo-HPs. F Injured site representing KCs (F4/80+) cells. Scale bar 100 µm (inset = 50 µm), n = 3/27
Fig. 5 KCs hindrance affects the translocation of allo-HPs in the sinusoids. A Experimental design: CI was induced at day 0 (D0), and GFP tag allo-HPs were engrafted 48 h after induction of CI in wild-type C57 mice. Samples were subsequently collected 54 h post-engraftment. B Representative images of sham-treated liver samples post-transplantation are shown. Scale bars 100 µm (inset = 50 µm). C Transplanted allo-HPs were localized in the portal vein (PV) at the non-injured site. Scale bars 100 µm (inset = 50 µm). D Very few allo-HPs were detected at the vicinity of the injured site. E KCs dismantle allo-HPs in the sinusoids (inset = 50 µm, non-injured site). The arrows indicate KCs invading the clusters of allo-HPs. F Injured site representing KCs (F4/80+) cells. Scale bar 100 µm (inset = 50 µm), n = 3/27CC BY · PubMed Central
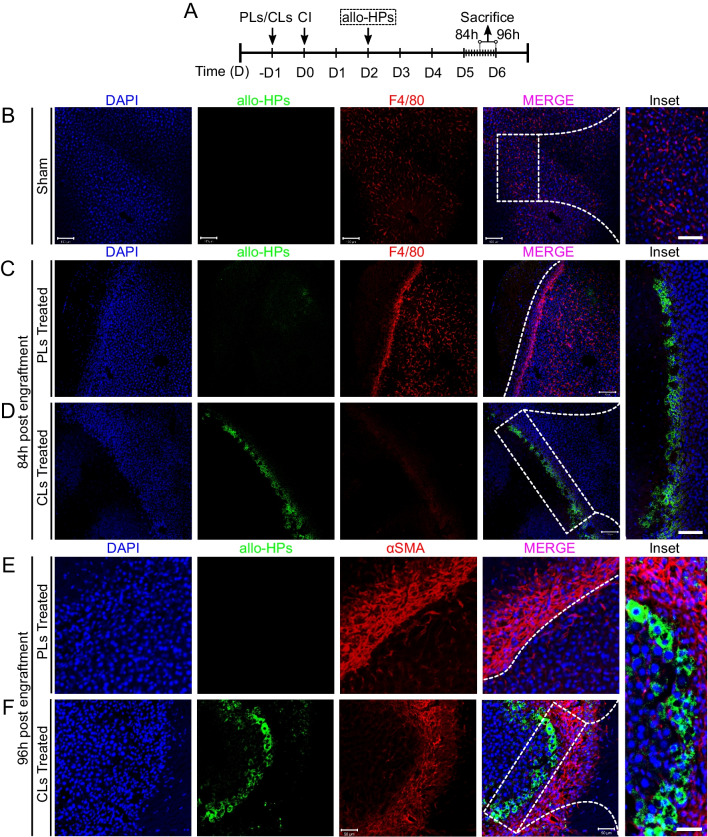
Fig. 6 Engrafted GFP tag allo-HPs repopulating at the border of the injured site. A Experimental design: CI was induced at D0 and samples were collected 84 h or 96 h post-engraftment, respectively. B Representative images of sham-treated samples post-transplantation are shown. C, D PLs- and CLs-treated samples post-84 h of engraftment. CLs-treated samples show repopulation of allo-HPs at the border of injured site as compared to PLs-treated samples. E, F Representative images of engrafted allo-HPs post-96 h of engraftment. CLs-treated samples (inset = 20 µm) show repopulating allo-HPs at the border next to HSCs as compared to PLs-treated sections. Scale bar 100 µm, n = 3/27 per group
Fig. 6 Engrafted GFP tag allo-HPs repopulating at the border of the injured site. A Experimental design: CI was induced at D0 and samples were collected 84 h or 96 h post-engraftment, respectively. B Representative images of sham-treated samples post-transplantation are shown. C, D PLs- and CLs-treated samples post-84 h of engraftment. CLs-treated samples show repopulation of allo-HPs at the border of injured site as compared to PLs-treated samples. E, F Representative images of engrafted allo-HPs post-96 h of engraftment. CLs-treated samples (inset = 20 µm) show repopulating allo-HPs at the border next to HSCs as compared to PLs-treated sections. Scale bar 100 µm, n = 3/27 per groupCC BY · PubMed Central
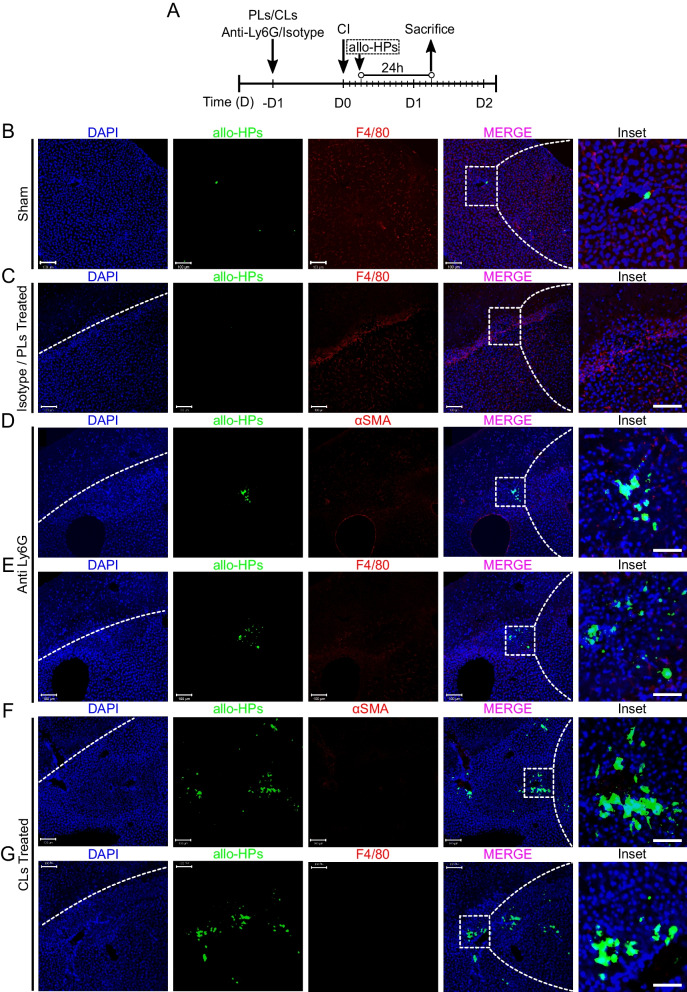
Fig. 7 Initial innate immune response collectively eliminate engrafted allo-HPs at early stages. A Experimental design: anti-Ly6G and CLs/PLs were injected 24 h before CI, whereas allo-HPs were engrafted 6 h post-CI. The samples were collected post-24 h allo-HPs engraftment. B Representative images of sham-treated samples post-transplantation. C Isotype—or PLs-treated liver samples are presented. D, E Anti-Ly6G-treated samples representing few allo-HPs at the injured site. F, G CLs-treated samples representing substantially accumulated allo-HPs as compared to D and E. Scale bar 100 µm (inset = 50 µm), n = 3/27
Fig. 7 Initial innate immune response collectively eliminate engrafted allo-HPs at early stages. A Experimental design: anti-Ly6G and CLs/PLs were injected 24 h before CI, whereas allo-HPs were engrafted 6 h post-CI. The samples were collected post-24 h allo-HPs engraftment. B Representative images of sham-treated samples post-transplantation. C Isotype—or PLs-treated liver samples are presented. D, E Anti-Ly6G-treated samples representing few allo-HPs at the injured site. F, G CLs-treated samples representing substantially accumulated allo-HPs as compared to D and E. Scale bar 100 µm (inset = 50 µm), n = 3/27CC BY · PubMed Central

Verification

Claims the paper makes

The claims and statistics of this paper haven’t been checked yet.

Run the check — free, no account needed. It reads the open-access text and checks the sources it cites.

A few free checks a day · papers already verified open instantly · results are public

Claims other papers make about this one

Each is checked against this paper’s own text: does it say what the citing paper says it does?

Self-check

Percentages, sums and reported differences re-computed from the paper’s own numbers.

The self-check needs the paper’s full text.

Citations

Cites

Show all 67 references

Cited by

Sorted by citations

See all 5

Metadata

Authors
Abbas, N., You, K., Getachew, A., Wu, F., Hussain, M., Huang, X., Chen, Y., Pan, T., & Li, Y.
Affiliations
  • Chinese Academy of Sciences (CN)
  • University of Alabama at Birmingham (US)
  • New York University (US)
  • Zhujiang Hospital (CN)
Corresponding author
Li, Yinxiong
Venue
Stem Cell Research & Therapy
Published
2024-02-20
Volume
15
Issue
1
Pages
48-48
ISSN
1757-6512 (ISSN-L)
OpenAlex
W4391965420
Cited by
5
References
67
Citations by year
2026: 4 · 2024: 1
FWCI
1.31
Type
journal article
Language
en
Open access
Locations
  • Stem Cell Research & Therapy (publishedVersion, cc-by)
  • PubMed Central (publishedVersion, cc-by)
  • PubMed (publishedVersion)
  • DOAJ (DOAJ: Directory of Open Access Journals) (submittedVersion)
Funders
  • National Key R&D Program of China (2019YFA0111300)
  • China-New Zealand Joint Laboratory on Biomedicine and Health (2022YFE0210600)
  • Guangdong Basic and Applied Basic Research Foundation (2021A1515220095)
  • Guangzhou Science and technology planning project (202102021138)
  • Guangzhou Science and Technology Program (2023B01J1004)
Topics
  • Health Sciences › Medicine › Hepatology › Liver physiology and pathology
  • Health Sciences › Medicine › Surgery › Organ Transplantation Techniques and Outcomes
  • Health Sciences › Medicine › Surgery › Tissue Engineering and Regenerative Medicine
Keywords
Kupffer cells, hepatocyte transplantation, cell engraftment, innate immune response, cryoinjury, liver regeneration, monocytes, neutrophils, Kupffer cell depletion, allogeneic rejection, cell therapy
MeSH terms
Kupffer Cells, Liver, Liver Regeneration, Hematopoietic Stem Cell Transplantation, Hepatocytes

About these checks

Registry, retraction, Cites and statistics results are computed, not judged, with one exception: a printed reference that no index lists is read once by a model before it counts as a citation error. Claims are extracted by a model and kept only when their quote appears verbatim in the text; each cited source is then checked, with a model’s help, for whether it says what the claim relies on. Those verdicts can be wrong — read the claim’s quote and the cited source before relying on one.

Statistics and arithmetic are recomputed, not judged.

Confidence bands are shown only for fields calibrated on our annotated test set. None is calibrated yet, so no band is shown.

What counts as a claim ›How we measure confidence ›How we check this ›

Are you an author, or do you see a problem with this page? Request a review