

The DOI matches its Crossref record; 40 of the 40 references it cites were found in a registry or an index.
Characterizing oral microbial communities across dentition states and colonization niches
Open accessAbstract
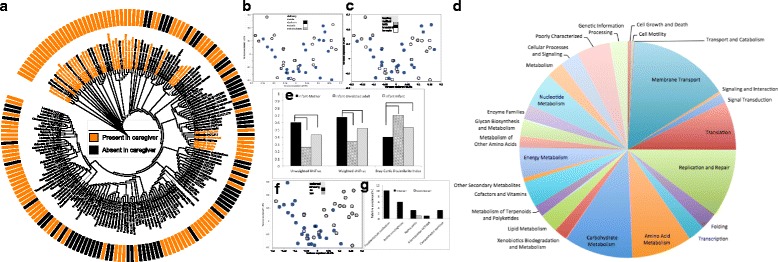
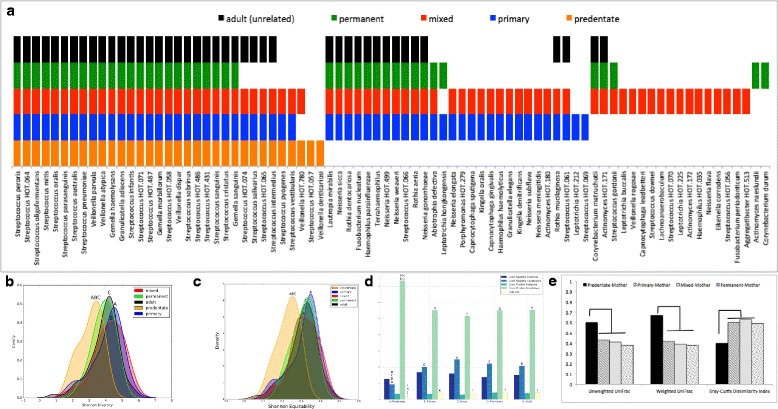
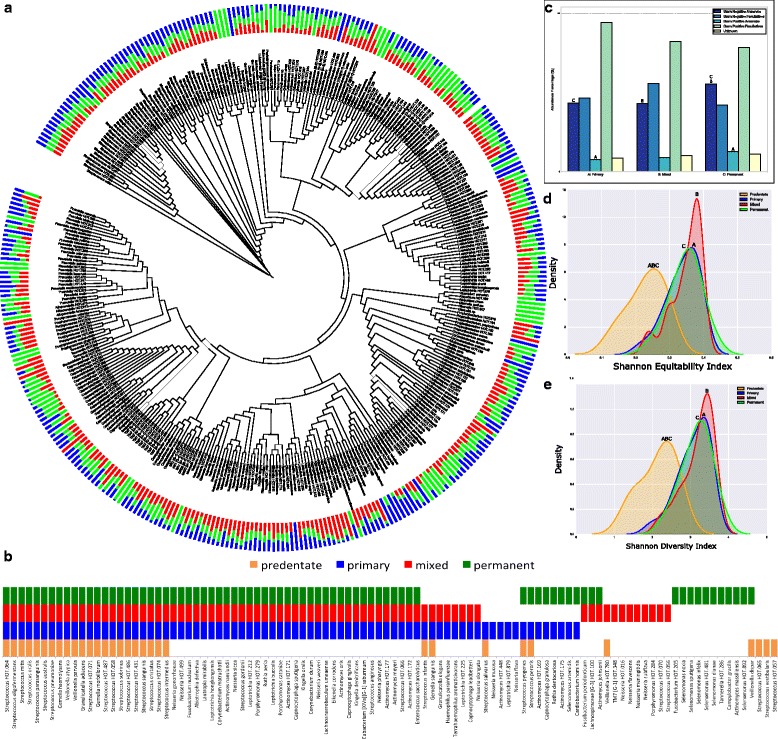
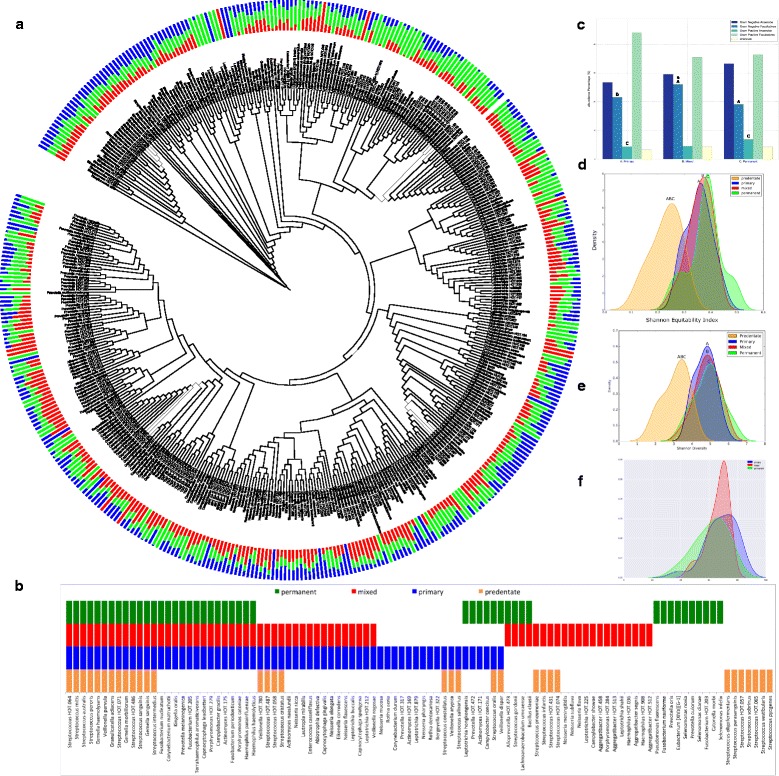
METHODS: The present study aimed to identify patterns and processes in acquisition of oral bacteria and to characterize the microbiota of different dentition states and habitats. Mucosal, salivary, supragingival, and subgingival biofilm samples were collected from orally and systemically healthy children and mother-child dyads in predentate, primary, mixed, and permanent dentitions. 16S rRNA gene sequences were compared to the Human Oral Microbiome Database (HOMD). Functional potential was inferred using PICRUSt. RESULTS: Unweighted and weighted UniFrac distances were significantly smaller between each mother-predentate dyad than infant-unrelated female dyads. Predentate children shared a median of 85% of species-level operational taxonomic units (s-OTUs) and 100% of core s-OTUs with their mothers. Maternal smoking, but not gender, mode of delivery, feeding habits, or type of food discriminated between predentate microbial profiles. The primary dentition demonstrated expanded community membership, structure, and function when compared to the predentate stage, as well as significantly lower similarity between mother-child dyads. The primary dentition also included 85% of predentate core s-OTUs. Subsequent dentitions exhibited over 90% similarity to the primary dentition in phylogenetic and functional structure. Species from the predentate mucosa as well as new microbial assemblages were identified in the primary supragingival and subgingival microbiomes. All individuals shared 65% of species between supragingival and subgingival habitats; however, the salivary microbiome exhibited less than 35% similarity to either habitat. CONCLUSIONS: Within the limitations of a cross-sectional study design, we identified two definitive stages in oral bacterial colonization: an early predentate imprinting and a second wave with the eruption of primary teeth. Bacterial acquisition in the oral microbiome is influenced by the maternal microbiome. Personalization begins with the eruption of primary teeth; however, this is limited to phylogeny; functionally, individuals exhibit few differences, suggesting that microbial assembly may follow a defined schematic that is driven by the functional requirements of the ecosystem. This early microbiome forms the foundation upon which newer communities develop as more colonization niches emerge, and expansion of biodiversity is attributable to both introduction of new species and increase in abundance of predentate organisms.
Overview
The claims and statistics of this paper haven’t been checked yet.
Run the check — free, no account needed. It reads the open-access text and checks the sources it cites.
Integrity signals
Registry
Cites
Statistics
Figures
Verification
Claims the paper makes
The claims and statistics of this paper haven’t been checked yet.
Run the check — free, no account needed. It reads the open-access text and checks the sources it cites.
Claims other papers make about this one
Each is checked against this paper’s own text: does it say what the citing paper says it does?
In the citing paper
“The most frequently detected early colonizers of the predental oral cavity include Streptococcus, Staphylococcus, and Fusobacterium species.142, 143”
From The oral microbiome: Role of key organisms and complex networks in oral health and disease (2021) · cites this paper as [143]
In the citing paper
“Interestingly, salivary microbial communities from oral cavities of primary teeth‐only cohorts demonstrate greater microbial diversity than do pre‐dentate, mixed dentition, and permanent teeth cohorts.”
From The oral microbiome: Role of key organisms and complex networks in oral health and disease (2021) · cites this paper as [143]
In the citing paper
“Among infants, phylogenetic divergences across individuals are observed prior to eruption of deciduous teeth143; however, functional signatures remain conserved.143”
From The oral microbiome: Role of key organisms and complex networks in oral health and disease (2021) · cites this paper as [143]
In the citing paper
“Tooth eruption introduces the relative abundance of Streptococcus, Gemella, Granulicatella, and Veillonella species.143”
From The oral microbiome: Role of key organisms and complex networks in oral health and disease (2021) · cites this paper as [143]
In the citing paper
“Exfoliation of primary dentition, the presence of mixed dentition, and the emergence of permanent teeth continue to alter the oral microbiome in early life and childhood.143”
From The oral microbiome: Role of key organisms and complex networks in oral health and disease (2021) · cites this paper as [143]
In the citing paper
“The eruption of deciduous teeth creates additional niches, such as nonshedding enamel surfaces, dentogingival borders, and a subgingival environment, for colonization of microbes.143, 145”
From The oral microbiome: Role of key organisms and complex networks in oral health and disease (2021) · cites this paper as [143]
In the citing paper
“Expansion of microbial functions at the time of tooth eruption reflect changes in the oral ecosystem, including increased expression of genes related to adhesion, biofilm formation, membrane transport, cell mobility, secretion systems, chemotaxis, flagella assembly, and oxidative phosphorylation.143”
From The oral microbiome: Role of key organisms and complex networks in oral health and disease (2021) · cites this paper as [143]
In the citing paper
“Marked expansion of oral microbial phylogenetic and functional diversity is observed with the eruption of deciduous teeth, suggesting the significance of related microbial ecosystems and parallel changes in dietary habits (solid foods) to oral microbiome diversity.143”
From The oral microbiome: Role of key organisms and complex networks in oral health and disease (2021) · cites this paper as [143]
Self-check
Percentages, sums and reported differences re-computed from the paper’s own numbers.
The self-check needs the paper’s full text.
Citations
Cites
Structure, function and diversity of the healthy human microbiome
The Human Microbiome Project Consortium (2012) · Nature · doi:10.1038/nature11234 · Cited by 11,726
Predictive functional profiling of microbial communities using 16S rRNA marker gene sequences
Langille, M. G. I., Zaneveld, J., Caporaso, J. G., McDonald, D., Knights, D., Reyes, J. A., Clemente, J. C., Burkepile, D. E., Vega Thurber, R. L., Knight, R., et al. (2013) · Nature Biotechnology · doi:10.1038/nbt.2676 · Cited by 9,116
Human gut microbiome viewed across age and geography
Yatsunenko, T., Rey, F. E., Manary, M. J., Trehan, I., Dominguez-Bello, M. G., Contreras, M., Magris, M., Hidalgo, G., Baldassano, R. N., Anokhin, A. P., et al. (2012) · Nature · doi:10.1038/nature11053 · Cited by 7,815
Defining the normal bacterial flora of the oral cavity
Aas, J. A., Paster, B. J., Stokes, L. N., Olsen, I., & Dewhirst, F. E. (2005) · Journal of Clinical Microbiology · doi:10.1128/jcm.43.11.5721-5732.2005 · Cited by 3,092
The Placenta Harbors a Unique Microbiome
Aagaard, K., Ma, J., Antony, K. M., Ganu, R., Petrosino, J., & Versalovic, J. (2014) · Science Translational Medicine · doi:10.1126/scitranslmed.3008599 · Cited by 2,494
Occlusal Caries: Biological Approach for Its Diagnosis and Management
Carvalho, J. C., Dige, I., Mačhiulskienė, V., Qvist, V., Bakhshandeh, A., Parolo, C. C. F., & Maltz, M. (2016) · Caries Research · doi:10.1159/000448662 · Cited by 2,159
Defining the healthy “core microbiome” of oral microbial communities
Zaura, E., Keijser, B. J., Huse, S. M., & Crielaard, W. (2009) · BMC Microbiology · doi:10.1186/1471-2180-9-259 · Cited by 1,323
Chu, D. M., Ma, J., Prince, A. L., Antony, K. M., Seferovic, M. D., & Aagaard, K. M. (2017) · Nature Medicine · doi:10.1038/nm.4272 · Cited by 1,063
The core gut microbiome, energy balance and obesity
Turnbaugh, P. J., & Gordon, J. I. (2009) · The Journal of Physiology · doi:10.1113/jphysiol.2009.174136 · Cited by 993
Normal Human Aging: The Baltimore Longitudinal Study on Aging
Shock, N. W., Greulich, R. C., Costa, P. T., Andres, R., Lakatta, E. G., Arenberg, D., & Tobin, J. D. (1984) · University Libraries (University of Maryland) · doi:10.13016/sclw-iccq · Cited by 757
Research works printed but not linked: 1
- Loesche WJ. Dental caries: a treatable infection. Springfield: Charles C. Thomas; 1982. p. c1982.
Cited by
Sorted by citations
The oral microbiome: Role of key organisms and complex networks in oral health and disease
Sedghi, L., DiMassa, V., Harrington, A., Lynch, S. V., & Kapila, Y. L. (2021) · Periodontology 2000 · doi:10.1111/prd.12393 · Cited by 755
Microbiota succession throughout life from the cradle to the grave
Martino, C., Dilmore, A. H., Burcham, Z. M., Metcalf, J. L., Jeste, D., & Knight, R. (2022) · Nature Reviews Microbiology · doi:10.1038/s41579-022-00768-z · Cited by 275
Biogeography of the Oral Microbiome: The Site-Specialist Hypothesis
Mark Welch, J. L., Dewhirst, F. E., & Borisy, G. G. (2019) · Annual Review of Microbiology · doi:10.1146/annurev-micro-090817-062503 · Cited by 284
Ma, Z., Zuo, T., Frey, N., & Rangrez, A. Y. (2024) · Signal Transduction and Targeted Therapy · doi:10.1038/s41392-024-01946-6 · Cited by 322
The Role of Oral Microbiome in Respiratory Health and Diseases
Pathak, J. L., Yan, Y., Zhang, Q., Wang, L., & Ge, L. (2021) · Respiratory Medicine · doi:10.1016/j.rmed.2021.106475 · Cited by 228
Metadata
- Authors
- Mason, M. R., Chambers, S., Dabdoub, S. M., Thikkurissy, S., & Kumar, P. S.
- Affiliations
- University of North Carolina at Chapel Hill (US)
- Nationwide Children's Hospital (US)
- The Ohio State University (US)
- Cincinnati Children's Hospital Medical Center (US)
- Corresponding author
- Kumar, Purnima S.
- Venue
- Microbiome
- Published
- 2018-04-10
- Volume
- 6
- Issue
- 1
- Pages
- 67-67
- ISSN
- 2049-2618 (ISSN-L)
- PMC
- PMC5891995
- OpenAlex
- W2798163555
- Cited by
- 142
- References
- 40
- Citations by year
- 2026: 15 · 2025: 17 · 2024: 19 · 2023: 21 · 2022: 29 · 2021: 21 · 2020: 11 · 2019: 7 · 2018: 2
- FWCI
- 11.78
- Type
- journal article
- Language
- en
- Open access
- gold
- doi.org
- Locations
- Microbiome (publishedVersion, cc-by)
- Europe PMC (PubMed Central) (publishedVersion, other-oa)
- PubMed Central (publishedVersion, cc-by)
- PubMed (publishedVersion)
- DOAJ (DOAJ: Directory of Open Access Journals) (submittedVersion, cc-by-sa)
- Funders
- National Institute of Dental and Craniofacial Research (R01-DE022579, T32-DE014320, F30- DE024940)
- Topics
- Health Sciences › Dentistry › Periodontics › Oral microbiology and periodontitis research
- Life Sciences › Biochemistry, Genetics and Molecular Biology › Molecular Biology › Gut microbiota and health
- Physical Sciences › Environmental Science › Ecology › Microbial Community Ecology and Physiology
- Keywords
- oral microbiota, bacterial colonization, primary teeth, maternal microbiome, mother-child dyads, salivary microbiome, supragingival plaque, subgingival plaque, mucosal microbiota, maternal smoking, 16S rRNA gene sequencing
- MeSH terms
- Cross-Sectional Studies, Dentition, Gingiva, Humans, Mouth, Phylogeny, RNA, Ribosomal, 16S, Saliva, Biodiversity, Metagenome, Metagenomics, Microbiota
About these checks
Registry, retraction, Cites and statistics results are computed, not judged, with one exception: a printed reference that no index lists is read once by a model before it counts as a citation error. Claims are extracted by a model and kept only when their quote appears verbatim in the text; each cited source is then checked, with a model’s help, for whether it says what the claim relies on. Those verdicts can be wrong — read the claim’s quote and the cited source before relying on one.
Statistics and arithmetic are recomputed, not judged.
Confidence bands are shown only for fields calibrated on our annotated test set. None is calibrated yet, so no band is shown.
What counts as a claim ›How we measure confidence ›How we check this ›
Are you an author, or do you see a problem with this page? Request a review
