

The DOI matches its Crossref record; 85 of the 85 references it cites were found in a registry or an index.
Taxonomic profiling and populational patterns of bacterial bile salt hydrolase (BSH) genes based on worldwide human gut microbiome
Open accessPublished version of a preprint
Abstract
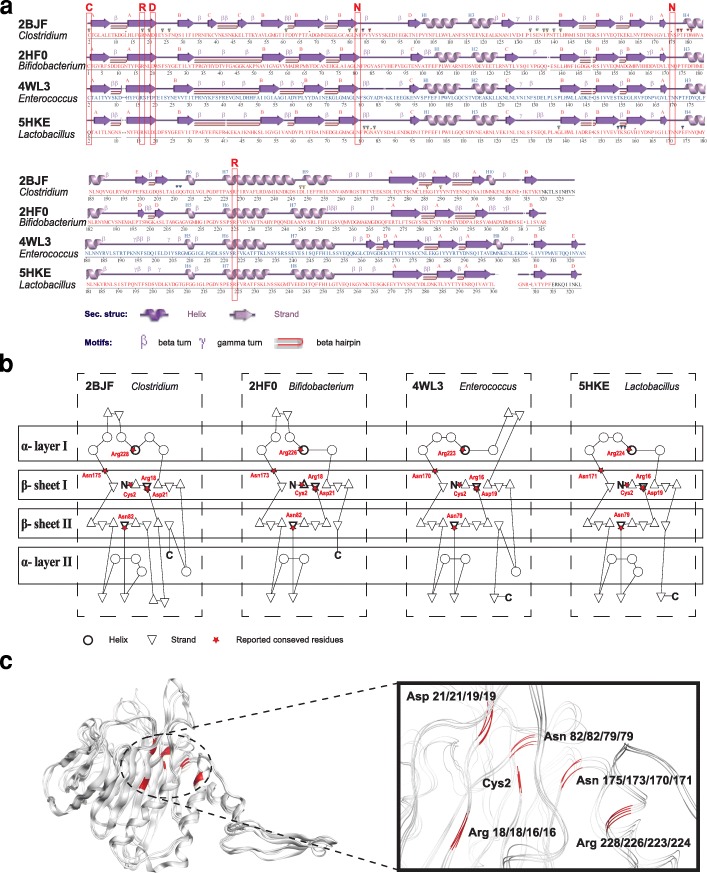
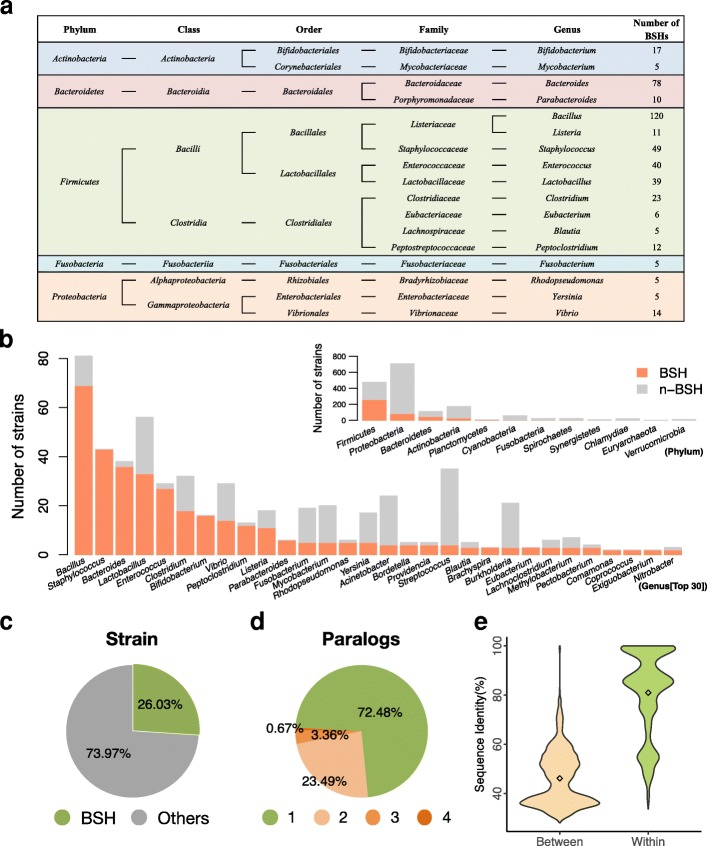
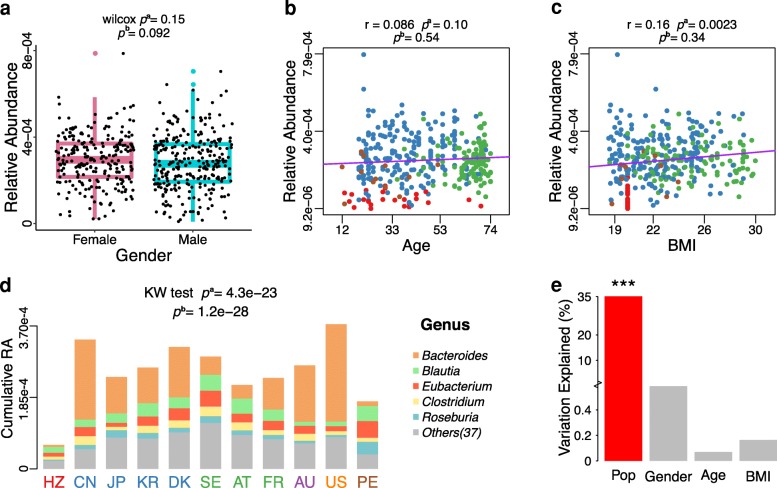
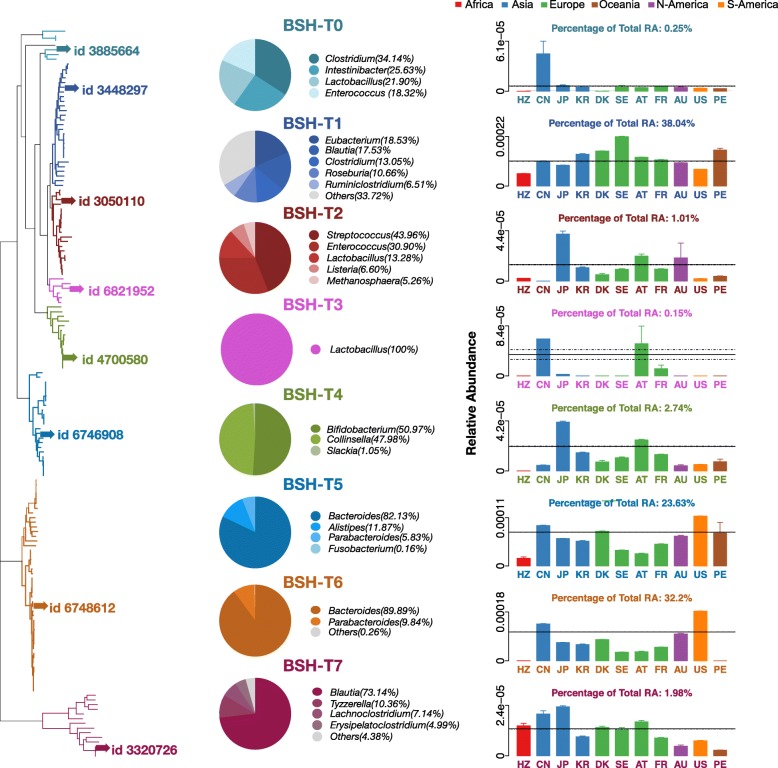
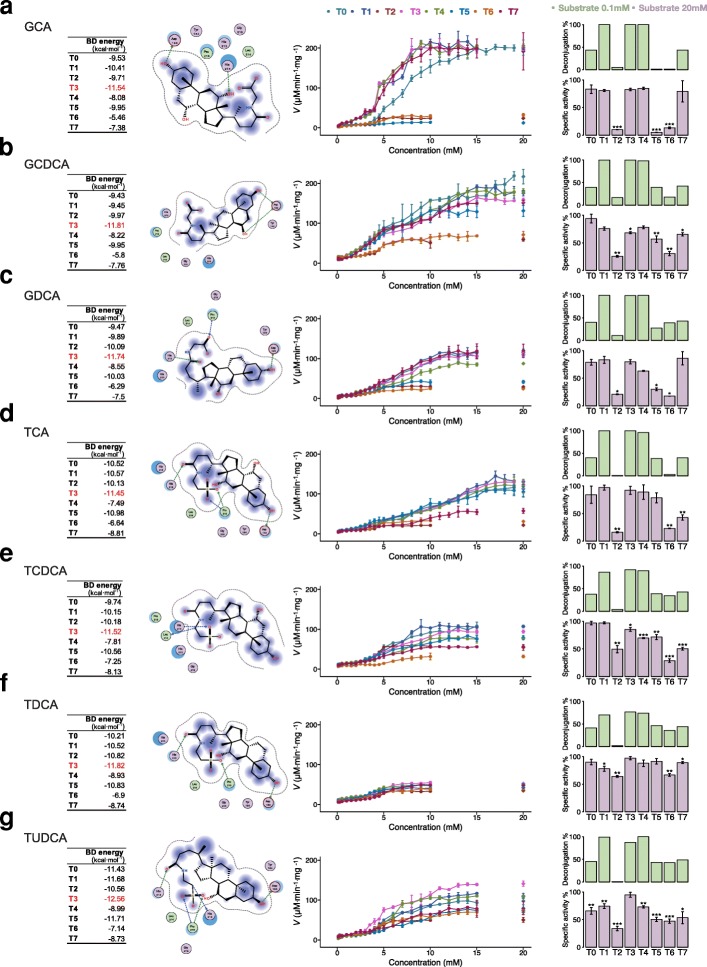
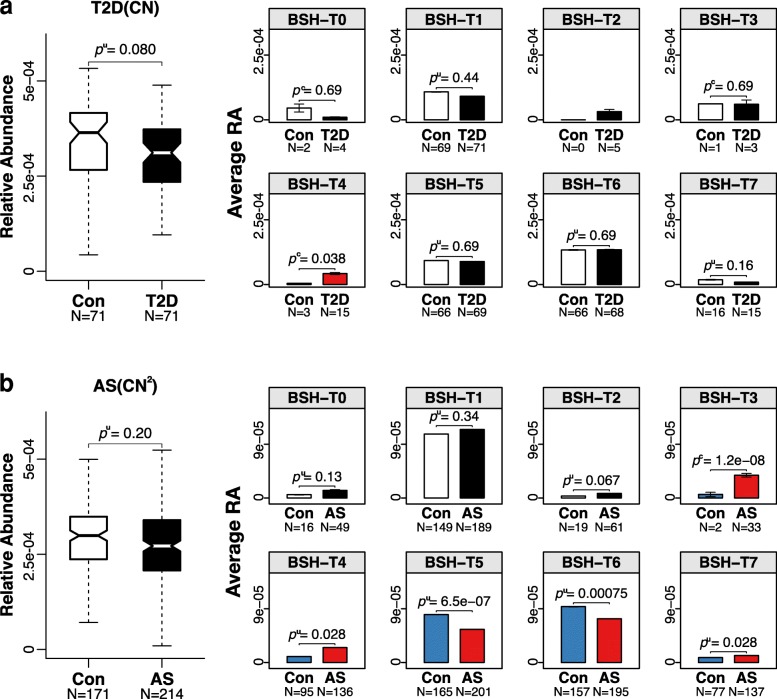
BACKGROUND: Bile salt hydrolase plays an important role in bile acid-mediated signaling pathways, which regulate lipid absorption, glucose metabolism, and energy homeostasis. Several reports suggest that changes in the composition of bile acids are found in many diseases caused by dysbacteriosis. RESULTS: Here, we present the taxonomic identification of bile salt hydrolase (BSH) in human microbiota and elucidate the abundance and activity differences of various bacterial BSH among 11 different populations from six continents. For the first time, we revealed that bile salt hydrolase protein sequences (BSHs) are distributed in 591 intestinal bacterial strains within 117 genera in human microbiota, and 27.52% of these bacterial strains containing BSH paralogs. Significant variations are observed in BSH distribution patterns among different populations. Based on phylogenetic analysis, we reclassified these BSHs into eight phylotypes and investigated the abundance patterns of these phylotypes among different populations. From the inspection of enzyme activity among different BSH phylotypes, BSH-T3 showed the highest enzyme activity and is only found in Lactobaclillus. The phylotypes of BSH-T5 and BSH-T6 mainly from Bacteroides with high percentage of paralogs exhibit different enzyme activity and deconjugation activity. Furthermore, we found that there were significant differences between healthy individuals and patients with atherosclerosis and diabetes in some phylotypes of BSHs though the correlations were pleiotropic. CONCLUSION: This study revealed the taxonomic and abundance profiling of BSH in human gut microbiome and provided a phylogenetic-based system to assess BSHs activity by classifying the target sequence into specific phylotype. Furthermore, the present work disclosed the variation patterns of BSHs among different populations of geographical regions and health/disease cohorts, which is essential to understand the role of BSH in the development and progression of related diseases.
Overview
The claims and statistics of this paper haven’t been checked yet.
Run the check — free, no account needed. It reads the open-access text and checks the sources it cites.
Integrity signals
Registry
Cites
Statistics
Figures
Verification
Claims the paper makes
The claims and statistics of this paper haven’t been checked yet.
Run the check — free, no account needed. It reads the open-access text and checks the sources it cites.
Claims other papers make about this one
Each is checked against this paper’s own text: does it say what the citing paper says it does?
The cited source says what the claim attributes to it.
In the citing paper
“BSH activity is widely distributed among gastrointestinal microbes, including various Lactobacillaceae species [5–8], where the presence of multiple bsh orthologs reflects strain-specific adaptations into the intestinal environment [5, 8–10].”
From Bile Salt Hydrolase Activity in the Food-Derived Strain Levilactobacillus brevis M3R3: Genomic and Functional Characterization (2026) · cites this paper as [7]
Self-check
Percentages, sums and reported differences re-computed from the paper’s own numbers.
The self-check needs the paper’s full text.
Citations
Cites
BLAST+: architecture and applications
Camacho, C., Coulouris, G., Avagyan, V., Ma, N., Papadopoulos, J., Bealer, K., & Madden, T. L. (2009) · BMC Bioinformatics · doi:10.1186/1471-2105-10-421 · Cited by 22,074
Structure, function and diversity of the healthy human microbiome
The Human Microbiome Project Consortium (2012) · Nature · doi:10.1038/nature11234 · Cited by 11,726
The Phyre2 web portal for protein modeling, prediction and analysis
Kelley, L. A., Mezulis, S., Yates, C. M., Wass, M. N., & Sternberg, M. J. E. (2015) · Nature Protocols · doi:10.1038/nprot.2015.053 · Cited by 9,652
<tt>BLAT</tt> —The <tt>BLAST</tt> -Like Alignment Tool
Kent, W. J. (2002) · Genome Research · doi:10.1101/gr.229202 · Cited by 8,480
Changes of Intestinal Functions in Liver Cirrhosis
Fukui, H., & Wiest, R. (2016) · Inflammatory Intestinal Diseases · doi:10.1159/000444436 · Cited by 6,820
A metagenome-wide association study of gut microbiota in type 2 diabetes
Qin, J., Li, Y., Cai, Z., Li, S., Zhu, J., Zhang, F., Liang, S., Zhang, W., Guan, Y., Shen, D., et al. (2012) · Nature · doi:10.1038/nature11450 · Cited by 6,762
Self-citationDe Filippo, C., Cavalieri, D., Di Paola, M., Ramazzotti, M., Poullet, J. B., Massart, S., Collini, S., Pieraccini, G., & Lionetti, P. (2010) · Proceedings of the National Academy of Sciences · doi:10.1073/pnas.1005963107 · Cited by 5,579
SOAPdenovo2: an empirically improved memory-efficient short-read de novo assembler
Luo, R., Liu, B., Xie, Y., Li, Z., Huang, W., Yuan, J., He, G., Chen, Y., Pan, Q., Liu, Y., et al. (2012) · GigaScience · doi:10.1186/2047-217x-1-18 · Cited by 5,365
Richness of human gut microbiome correlates with metabolic markers
Le Chatelier, E., Nielsen, T., Qin, J., Prifti, E., Hildebrand, F., Falony, G., Almeida, M., Arumugam, M., Batto, J.-M., Kennedy, S., et al. (2013) · Nature · doi:10.1038/nature12506 · Cited by 4,662
Self-citationThe Human Intestinal Microbiome in Health and Disease
Lynch, S. V., & Pedersen, O. (2016) · New England Journal of Medicine · doi:10.1056/nejmra1600266 · Cited by 3,637
Research works printed but not linked: 2
- National Center for Biotechnology Information, U.S. https://www.ncbi.nlm.nih.gov . Accessed 17 Oct 2018.
- Haeusler RA, Astiarraga B, Camastra S, Accili D, Ferrannini E. Human insulin resistance is associated with increased plasma levels of 12a-hydroxylated bile acids. Diabetes. 2013;62:4184–91. · DOI · Paper page
Cited by
Sorted by citations
Items 101–200 of 518
Microbiome-encoded bile acid metabolism modulates colonic transit times
Li, N., Koester, S. T., Lachance, D. M., Dutta, M., Cui, J. Y., & Dey, N. (2021) · iScience · doi:10.1016/j.isci.2021.102508 · Cited by 48
Smith, B. J., Piceno, Y. M., Zydek, M., Zhang, B., Syriani, L. A., Terdiman, J. P., Kassam, Z., Ma, A. I., Lynch, S. V., Pollard, K. S., et al. (2022) · Scientific Reports · doi:10.1038/s41598-022-09307-5 · Cited by 46
Kastl, A., Zong, W., Gershuni, V. M., Friedman, E. S., Tanes, C., Boateng, A., Mitchell, W. J., O’Connor, K., Bittinger, K. L., Terry, N. A., et al. (2022) · Gut Microbes · doi:10.1080/19490976.2022.2083417 · Cited by 49
Bile acid metabolism and signaling: Emerging pharmacological targets of dietary polyphenols
Tveter, K. M., Mezhibovsky, E., Wu, Y., & Roopchand, D. E. (2023) · Pharmacology & Therapeutics · doi:10.1016/j.pharmthera.2023.108457 · Cited by 52
Yu, J., Zhang, H., Chen, L., Ruan, Y., Chen, Y., & Liu, Q. (2021) · Frontiers in Cellular and Infection Microbiology · doi:10.3389/fcimb.2021.698852 · Cited by 45
Chen, Q., Li, Q., Cao, M., Yan, J., & Zhang, X. (2022) · Advanced Science · doi:10.1002/advs.202200986 · Cited by 47
Wang, A., Guan, B., Shao, C., Zhao, L., Li, Q., Hao, H., Gao, Z., Chen, K., Hou, Y., & Xu, H. (2022) · Phytomedicine · doi:10.1016/j.phymed.2022.154220 · Cited by 45
Hernandez, G. V., Smith, V. A., Melnyk, M., Burd, M. A., Sprayberry, K. A., Edwards, M. S., Peterson, D. G., Bennet, D. C., Fanter, R. K., Columbus, D. A., et al. (2020) · American Journal of Physiology-Gastrointestinal and Liver Physiology · doi:10.1152/ajpgi.00344.2019 · Cited by 44
Xu, F., Yu, Z., Liu, Y., Du, T., Yu, L., Tian, F., Chen, W., & Zhai, Q. (2023) · Nutrients · doi:10.3390/nu15173829 · Cited by 49
Excess iron intake induced liver injury: The role of gut-liver axis and therapeutic potential
Liu, Y., Li, G., Lu, F., Guo, Z., Cai, S., & Huo, T. (2023) · Biomedicine & Pharmacotherapy · doi:10.1016/j.biopha.2023.115728 · Cited by 53
Targeting the human gut microbiome with small-molecule inhibitors
Woo, A. Y. M., Aguilar Ramos, M. A., Narayan, R., Richards-Corke, K. C., Wang, M. L., Sandoval-Espinola, W. J., & Balskus, E. P. (2023) · Nature Reviews Chemistry · doi:10.1038/s41570-023-00471-4 · Cited by 42
Huang, Y., Chen, H., Chen, J., Wu, Q.-X., Zhang, W., Li, D., Lu, Y., & Chen, Y. (2024) · Phytomedicine · doi:10.1016/j.phymed.2024.155919 · Cited by 43
Lin, X., Xia, L., Zhou, Y., Xie, J., Tuo, Q., Lin, L., & Liao, D. (2025) · International Journal of Molecular Sciences · doi:10.3390/ijms26094240 · Cited by 48
Self-citationReview of the Relationships Between Human Gut Microbiome, Diet, and Obesity
Patloka, O., Komprda, T., & Franke, G. (2024) · Nutrients · doi:10.3390/nu16233996 · Cited by 50
Fan, S., Huang, Y., Lu, G., Sun, N., Wang, R., Lu, C., Ding, L., Han, J., Zhou, J., Li, Y., et al. (2022) · Food & Function · doi:10.1039/d1fo03981d · Cited by 42
Advances in the role and mechanism of lactic acid bacteria in treating obesity
Shen, Y., Zhang, L., Yang, Y., Yin, B., Ye, B., & Zhou, Y. Q. (2022) · Food Bioengineering · doi:10.1002/fbe2.12002 · Cited by 41
Yang, S., Li, D., Yu, Z., Li, Y., & Wu, M. (2021) · Frontiers in Pharmacology · doi:10.3389/fphar.2021.709629 · Cited by 40
Functional and Phylogenetic Diversity of BSH and PVA Enzymes
Daly, J. W., Keely, S. J., & Gahan, C. G. M. (2021) · Microorganisms · doi:10.3390/microorganisms9040732 · Cited by 40
Xie, Z., Jiang, H., Liu, W., Zhang, X., Chen, D., Sun, S.-M., Zhou, C., Liu, J., Bao, S., Wang, X., et al. (2020) · Cell Death and Disease · doi:10.1038/s41419-020-02974-0 · Cited by 40
Self-citationZhu, H., Zhao, F., Zhang, W., Xia, W., Chen, Y., Liu, Y., Fan, Z., Zhang, Y., & Yang, Y. (2021) · Food & Function · doi:10.1039/d1fo03143k · Cited by 40
Wei, D., Li, Y., Che, M., Li, C., Wu, Q., & Sun, C. (2022) · Cellular and Molecular Life Sciences · doi:10.1007/s00018-022-04412-0 · Cited by 41
Aoi, W., Inoüe, R., Mizushima, K., Honda, A., Björnholm, M., Takagi, T., & Naito, Y. (2023) · iScience · doi:10.1016/j.isci.2023.106251 · Cited by 45
Qian, X., Yanagi, K., Kane, A. V., Alden, N., Lei, M., Snydman, D. R., Vickers, R. J., Lee, K., & Thorpe, C. M. (2020) · American Journal of Physiology-Gastrointestinal and Liver Physiology · doi:10.1152/ajpgi.00046.2020 · Cited by 40
Zhao, Y., Wei, S., Chen, L., Zhou, X., & Ma, X. (2023) · Frontiers in Immunology · doi:10.3389/fimmu.2023.1164202 · Cited by 38
Ecophysiology and interactions of a taurine-respiring bacterium in the mouse gut
Ye, H., Borusak, S., Eberl, C., Krasenbrink, J., Weiß, A. S., Chen, S., Hanson, B. T., Hausmann, B., Herbold, C. W., Pristner, M., et al. (2023) · Nature Communications · doi:10.1038/s41467-023-41008-z · Cited by 44
Wen, X., Feng, X., Xin, F., An, R. F., Huang, H., Mao, L., Liu, P., Zhang, J., Huang, H., Liu, X., et al. (2024) · Gut Microbes · doi:10.1080/19490976.2024.2423040 · Cited by 38
Jia, B., Park, D., Chun, B. H., Hahn, Y., & Jeon, C. O. (2021) · International Journal of Molecular Sciences · doi:10.3390/ijms22073652 · Cited by 39
Rochoń, J., Kalinowski, P., Szymanek-Majchrzak, K., & Grąt, M. (2024) · World Journal of Gastroenterology · doi:10.3748/wjg.v30.i23.2964 · Cited by 41
Gutiérrez‐Repiso, C., Moreno‐Indias, I., & Tinahones, F. J. (2021) · Reviews in Endocrine and Metabolic Disorders · doi:10.1007/s11154-021-09676-8 · Cited by 37
Gao, X., Lin, X., Yan, X., Zhu, X., Li, X., Chen, M., Huang, Z., & Guo, H. (2023) · The Journal of Nutritional Biochemistry · doi:10.1016/j.jnutbio.2023.109347 · Cited by 38
Self-citationNi, Y., Hu, Y., Lou, X., Rong, N., Liu, F., Yang, C., Zheng, A., Yang, S. T., Bao, J., & Fu, Z. (2022) · Journal of Agricultural and Food Chemistry · doi:10.1021/acs.jafc.2c02729 · Cited by 38
Hou, J.-J., Wang, X., Wang, Y.-M., & Wang, B.-M. (2021) · Critical Reviews in Microbiology · doi:10.1080/1040841x.2021.2018401 · Cited by 36
Self-citationKey Signaling in Alcohol-Associated Liver Disease: The Role of Bile Acids
Way, G. W., Jackson, K. G., Muscu, S., & Zhou, H. (2022) · Cells · doi:10.3390/cells11081374 · Cited by 36
Lin, D., Sun, Q., Liu, Z., Pan, J., Zhu, J., Wang, S., Jia, S., Zheng, M., Li, X., & Gong, F. (2022) · Free Radical Biology and Medicine · doi:10.1016/j.freeradbiomed.2022.12.087 · Cited by 37
Li, X., Xia, X. L., Wang, S., Wu, B., Zhou, Y., & Deng, P. (2025) · Gut Microbes · doi:10.1080/19490976.2025.2464225 · Cited by 39
A structural metagenomics pipeline for examining the gut microbiome
Walker, M. E., Simpson, J. B., & Redinbo, M. R. (2022) · Current Opinion in Structural Biology · doi:10.1016/j.sbi.2022.102416 · Cited by 35
Lv, W., Huang, J.-Y., Lin, J., Ma, Y., He, S.-Q., Zhang, Y., Wang, T.-Z., Cheng, K., Xiong, Y., Sun, F., et al. (2023) · Oxidative Medicine and Cellular Longevity · doi:10.1155/2023/6409385 · Cited by 36
Identifying a Novel Bile Salt Hydrolase from the Keystone Gut Bacterium Christensenella minuta
Déjean, G., Tudela, H., Bruno, L., Kissi, D., Rawadi, G., & Claus, S. P. (2021) · Microorganisms · doi:10.3390/microorganisms9061252 · Cited by 35
[Retracted] A Review of Bile Acid Metabolism and Signaling in Cognitive Dysfunction‐Related Diseases
Weng, Z.-B., Chen, Y.-R., Lv, J.-T., Wang, M.-X., Chen, Z.-Y., Zhou, W., Shen, X.-C., Zhan, L.-B., & Wang, F. (2022) · Oxidative Medicine and Cellular Longevity · doi:10.1155/2022/4289383 · Cited by 32
RetractedHe, X., Gao, J., Peng, L., Hu, T., Wan, Y., Zhou, M., Zhen, P., & Cao, H. (2020) · Gut · doi:10.1136/gutjnl-2020-322468 · Cited by 33
Liver’s influence on the brain through the action of bile acids
Yeo, X. Y., Tan, L. Y., Chae, W. R., Lee, D., Lee, Y., Wüestefeld, T., & Jung, S. (2023) · Frontiers in Neuroscience · doi:10.3389/fnins.2023.1123967 · Cited by 35
Bile acids, bioactive signalling molecules in interoceptive gut‐to‐brain communication
Joyce, S. A., & O'Malley, D. (2022) · The Journal of Physiology · doi:10.1113/jp281727 · Cited by 32
Gut microbiota in alcohol-related liver disease: pathophysiology and gut-brain cross talk
Zhu, L., Wang, Y., Pan, C. Q., & Xing, H. (2023) · Frontiers in Pharmacology · doi:10.3389/fphar.2023.1258062 · Cited by 32
Yang, J., Qin, K., Sun, Y., & Yang, X. (2023) · Microbiology Spectrum · doi:10.1128/spectrum.02065-23 · Cited by 34
Microbial metabolism marvels: a comprehensive review of microbial drug transformation capabilities
Martinelli, F., & Thiele, I. (2024) · Gut Microbes · doi:10.1080/19490976.2024.2387400 · Cited by 33
Bacterial extracellular vesicles in the initiation, progression and treatment of atherosclerosis
Lin, Y., Wang, J., Bu, F., Zhang, R., Wang, J., Wang, Y., Huang, M., Huang, Y., Zheng, L., Wang, Q., et al. (2025) · Gut Microbes · doi:10.1080/19490976.2025.2452229 · Cited by 33
Impact of the gut microbiome on atherosclerosis
Mao, Y., Kong, C., Zang, T., You, L., Wang, L., Shen, L. W., & Ge, J. (2024) · mLife · doi:10.1002/mlf2.12110 · Cited by 30
Huang, Y., Xu, W., Dong, W., Chen, G., Sun, Y., & Zeng, X. (2024) · Journal of Advanced Research · doi:10.1016/j.jare.2024.06.027 · Cited by 37
Tian, Y., Yang, W., Chen, G., Men, C., Gu, Y., Song, X., Zhang, R., Wang, L., & Zhang, X. (2022) · Food Science and Biotechnology · doi:10.1007/s10068-021-01015-6 · Cited by 30
Gut microbiota causally affects cholelithiasis: a two-sample Mendelian randomization study
Liu, X., Qi, X., Han, R., Mao, T., & Tian, Z. (2023) · Frontiers in Cellular and Infection Microbiology · doi:10.3389/fcimb.2023.1253447 · Cited by 31
Luo, Z., Zhou, W., Xie, T., Xu, W., Shi, C., Xiao, Z., Si, Y., Ma, Y., Ren, Q., Di, L., et al. (2024) · Acta Pharmaceutica Sinica B · doi:10.1016/j.apsb.2024.04.027 · Cited by 31
He, Q., Li, J., Ma, Y., Chen, Q., & Chen, G. (2021) · Microorganisms · doi:10.3390/microorganisms9061224 · Cited by 30
Self-citationCui, Y., Yin, Y., Li, S., Wu, Z., Xie, Y., Qian, Q., Yang, H., & Li, X. (2022) · Food & Function · doi:10.1039/d1fo04116a · Cited by 29
Self-citationCorrelation between Peptacetobacter hiranonis, the baiCD Gene, and Secondary Bile Acids in Dogs
Lopes, B. C., Chen, C.-C., Sung, C., Ishii, P. E., Medina, L. F. D. C., Gaschen, F. P., Suchodolski, J. S., & Pilla, R. (2024) · Animals · doi:10.3390/ani14020216 · Cited by 27
Gurung, B., Stricklin, M. L., & Wang, S. (2024) · Metabolites · doi:10.3390/metabo14010074 · Cited by 28
Carcinogenic and anticancer activities of microbiota-derived secondary bile acids
Kouhzad, M., Götz, F., Navidifar, T., Taki, E., Ghamari, M., Mohammadzadeh, R., Seyedolmohadesin, M., & Bostanghadiri, N. (2025) · Frontiers in Oncology · doi:10.3389/fonc.2025.1514872 · Cited by 31
Mohammed, A. D., Mohammed, Z., Roland, M. M., Chatzistamou, I., Jolly, A., Schoettmer, L., Arroyo, M. J. D. M., Kakar, K., Tian, Y., Patterson, A. D., et al. (2022) · Nature Communications · doi:10.1038/s41467-022-28126-w · Cited by 30
Gillard, J., & Leclercq, I. A. (2023) · Clinical Science · doi:10.1042/cs20220697 · Cited by 29
Mo, W., Zou, J., Wu, M., Peng, Z., He, W., Li, W., & Wu, X. (2023) · Journal of Functional Foods · doi:10.1016/j.jff.2023.105408 · Cited by 27
Chintakovid, N., Singkhamanan, K., Yaikhan, T., Nokchan, N., Wonglapsuwan, M., Jitpakdee, J., Kantachote, D., & Surachat, K. (2024) · Heliyon · doi:10.1016/j.heliyon.2024.e33823 · Cited by 26
Qin, F., Li, J., Mao, T., Feng, S., Li, J., & Lai, M. (2023) · Metabolites · doi:10.3390/metabo13030451 · Cited by 25
Self-citationBile acids and their receptors in hepatic immunity
Fiorucci, S., Marchianò, S., Distrutti, E., & Biagioli, M. (2025) · Liver Research · doi:10.1016/j.livres.2025.01.005 · Cited by 31
Ginsenosides retard atherogenesis via remodelling host–microbiome metabolic homeostasis
Wang, Y., Wu, J., Hong, Y., Zhu, J., Zhang, Y., Zhang, J., Ding, C., Che, Y., Wang, G., Jiang, A., et al. (2024) · British Journal of Pharmacology · doi:10.1111/bph.16320 · Cited by 29
Luo, Y., Peng, S.-J., Cheng, J., Yang, H., Lin, L., Yang, G., Jin, Y., Wang, Q., & Wen, Z. (2024) · Journal of Functional Biomaterials · doi:10.3390/jfb15080236 · Cited by 28
Thibaut, M. M., Roumain, M., Piron, E., Gillard, J., Loriot, A. E., Neyrinck, A. M., Rodriguez, J., Massart, I. S., Thissen, J., Huot, J. R., et al. (2025) · Gut Microbes · doi:10.1080/19490976.2025.2449586 · Cited by 26
Hu, L., Wang, X., Bao, Z., Xu, Q., Qian, M., & Jin, Y. (2022) · Chemosphere · doi:10.1016/j.chemosphere.2022.136141 · Cited by 25
Self-citationErtürkmen, P., Fırıncıoğulları, B., & Öner, Z. (2023) · Current Microbiology · doi:10.1007/s00284-023-03311-2 · Cited by 25
Zhang, M., Xiao, B., Chen, X., Ou, B., & Wang, S. (2023) · Acta Physiologica · doi:10.1111/apha.14065 · Cited by 28
Dietary resistant starch supplementation increases gut luminal deoxycholic acid abundance in mice
Reuter, M. A., Tucker, M., Marfori, Z., Shishani, R., Bustamante, J. M., Moreno, R., Goodson, M. L., Ehrlich, A. K., Taha, A. Y., Lein, P. J., et al. (2024) · Gut Microbes · doi:10.1080/19490976.2024.2315632 · Cited by 25
Chemoproteomic profiling of substrate specificity in gut microbiota-associated bile salt hydrolases
Han, L., Pendleton, A., Singh, A., Xu, R., Scott, S. A., Palma, J. A., Diebold, P. J., Malarney, K. P., Brito, I., & Chang, P. V. (2024) · Cell chemical biology · doi:10.1016/j.chembiol.2024.05.009 · Cited by 26
Lucas, L. N., Mallikarjun, J., Cattaneo, L. E., Gangwar, B., Zhang, Q., Clay, A. P., Kerby, R. L., Stevenson, D. M., Blackwell, H. E., Rey, F. E., et al. (2026) · Nature Communications · doi:10.1038/s41467-026-68556-4 · Cited by 28
Geng, W., Long, S. L., Chang, Y., Saxton, A. M., Joyce, S. A., & Lin, J. (2020) · Scientific Reports · doi:10.1038/s41598-020-61723-7 · Cited by 24
Mahnič, A., Auchtung, J. M., Ulrih, N. P., Britton, R. A., & Rupnik, M. (2020) · Scientific Reports · doi:10.1038/s41598-020-65253-0 · Cited by 24
Profiling gut microbiota and bile acid metabolism in critically ill children
Kean, I. R. L., Wagner, J., Wijeyesekera, A., de Goffau, M. C., Thurston, S., Clark, J. A., White, D. K., Ridout, J. A., Agrawal, S., Kayani, R., et al. (2022) · Scientific Reports · doi:10.1038/s41598-022-13640-0 · Cited by 25
Targeted metabolomics reveals aberrant profiles of serum bile acids in patients with schizophrenia
Qing, Y., Wang, P., Cui, G., Zhang, J., Liang, K., Xia, Z., Wang, P., He, L., & Jia, W. P. (2022) · Schizophrenia · doi:10.1038/s41537-022-00273-5 · Cited by 25
Polychronidis, G., Siddiqi, H., Ahmed, F. A., Papatheodorou, S., Giovannucci, E. L., & Song, M. (2023) · International Journal of Epidemiology · doi:10.1093/ije/dyad042 · Cited by 27
Umanets, A., SURONO, I. S., & Venema, K. (2023) · BMC Genomics · doi:10.1186/s12864-023-09495-y · Cited by 24
Wang, P., Sun, J., Zhao, W., Wang, D., Ma, Y., Zhao, Y., Wang, Y., & Zhao, X. (2024) · Journal of Agricultural and Food Chemistry · doi:10.1021/acs.jafc.4c01598 · Cited by 25
Sun, L., Jiang, J., Zeng, Y., Zhu, J., Wang, S., Huang, D., & Cao, C. (2024) · Journal of Agricultural and Food Chemistry · doi:10.1021/acs.jafc.4c06030 · Cited by 23
Jiang, J., Zhang, H., Hussain, M., Abdullah, Feng, F., Guan, R., & Zhong, H. (2025) · Biology · doi:10.3390/biology14070802 · Cited by 28
Gao, Y., Lin, J., Ye, C., Guo, S., & Jiang, C. (2023) · Liver Research · doi:10.1016/j.livres.2023.09.002 · Cited by 26
Pan, T. J., Li, X., Guo, X., Wang, H., Zhou, X., Shang, R., Xie, D., Qian, X., Dai, M., Fan, E., et al. (2023) · Diabetes Metabolic Syndrome and Obesity · doi:10.2147/dmso.s421134 · Cited by 23
He, X., Gao, X., Hong, Y., Zhong, J., Li, Y., Zhu, W., Ma, J., Huang, W., Li, Y., Li, Y., et al. (2023) · Journal of Agricultural and Food Chemistry · doi:10.1021/acs.jafc.3c02909 · Cited by 23
Age-related sarcopenia and altered gut microbiota: A systematic review
Wang, M., Ren, F., Zhou, Y., He, Y., Du, T., & Tan, Y. (2024) · Microbial Pathogenesis · doi:10.1016/j.micpath.2024.106850 · Cited by 24
Disentangling the nutrition-microbiota liaison in inflammatory bowel disease
Florio, M., Crudele, L., Sallustio, F., Moschetta, A., Cariello, M., & Gadaleta, R. M. (2025) · Molecular Aspects of Medicine · doi:10.1016/j.mam.2025.101349 · Cited by 22
Bile acid signaling in MASLD: From pathogenesis to therapeutic applications
Simbrunner, B., Paternostro, R., Reiberger, T., & Trauner, M. (2025) · Hepatology · doi:10.1097/hep.0000000000001539 · Cited by 30
Navarro, S. L., Levy, L., Curtis, K. R., Elkon, I., Kahsai, O. J., Ammar, H., Randolph, T. W., Hong, N. N., Neto, F. C., Raftery, D., et al. (2020) · Nutrients · doi:10.3390/nu12061837 · Cited by 22
Cheng, T., Li, J., Chen, J., Chen, P., Ma, L.-R., Zhang, G., & Yan, P. (2021) · Chinese Medicine · doi:10.1186/s13020-021-00516-0 · Cited by 22
Self-citationXu, D., Pan, D., Liu, H., Yang, C., Yang, X., Wang, X., Liu, F., Feng, M., Wu, Q., Shen, Y., et al. (2022) · Food Research International · doi:10.1016/j.foodres.2022.111701 · Cited by 24
Self-citationAguirre, A. M., Adegbite, A. O., & Sorg, J. A. (2022) · npj Biofilms and Microbiomes · doi:10.1038/s41522-022-00358-0 · Cited by 24
Kiriyama, Y., & Nochi, H. (2023) · Genes · doi:10.3390/genes14040825 · Cited by 22
Yan, B., Zheng, X., Wang, Y., Yang, J., Zhu, X., Qiu, M., Xia, K., Wang, Y., Li, M., Li, S., et al. (2023) · ACS Pharmacology & Translational Science · doi:10.1021/acsptsci.3c00210 · Cited by 23
Advances in the Application of Transition-Metal Composite Nanozymes in the Field of Biomedicine
Wang, H., Cheng, C., Zhao, J., Han, F., Zhao, G., Zhang, Y., & Wang, Y. (2024) · Biosensors · doi:10.3390/bios14010040 · Cited by 23
Zhou, L., Lu, G., Nie, Y., Ren, Y., Shi, J., Xue, Y., Xu, Z., & Geng, Y. (2024) · Gut Microbes · doi:10.1080/19490976.2024.2370634 · Cited by 22
Torres-Miranda, A., Melis-Arcos, F., & Garrido, D. A. (2022) · Probiotics and Antimicrobial Proteins · doi:10.1007/s12602-022-09999-1 · Cited by 21
Li, H., Xi, Y., Xin, X., Feng, Q., & Hu, Y. (2023) · Frontiers in Pharmacology · doi:10.3389/fphar.2023.1148737 · Cited by 22
Kang, M. H., Elnar, A. G., & Kim, G.-B. (2025) · Food Science of Animal Resources · doi:10.5851/kosfa.2025.e1 · Cited by 21
Xu, H., Yuan, M., Niu, K., Yang, W. J., Jiang, M., Zhang, L., & Zhou, J. (2024) · Molecules · doi:10.3390/molecules29050976 · Cited by 21
Poopan, B., Kasorn, A., Puttarat, N., Kasemwong, K., Pachekrepapol, U., & Taweechotipatr, M. (2024) · Food Science and Biotechnology · doi:10.1007/s10068-024-01706-w · Cited by 21
Sun, Q., Xin, X., An, Z., Hu, Y., & Feng, Q. (2022) · Frontiers in Cellular and Infection Microbiology · doi:10.3389/fcimb.2022.854879 · Cited by 20
Metadata
- Authors
- Song, Z., Cai, Y., Lao, X., Wang, X., Lin, X., Cui, Y., Kalavagunta, P. K., Liao, J., Jin, L., Shang, J., & Li, J.
- Affiliations
- China Pharmaceutical University (CN)
- Corresponding author
- Jin, Liang
- Shang, Jing
- Li, Jing
- ORCID
- Venue
- Microbiome
- Published
- 2019-01-23
- Volume
- 7
- Issue
- 1
- Pages
- 9-9
- ISSN
- 2049-2618 (ISSN-L)
- PMC
- PMC6345003
- OpenAlex
- W2952656298
- Cited by
- 505
- References
- 85
- Citations by year
- 2026: 56 · 2025: 88 · 2024: 109 · 2023: 78 · 2022: 77 · 2021: 58 · 2020: 32 · 2019: 6
- FWCI
- 14.31
- Type
- journal article
- Language
- en
- Open access
- gold
- doi.org
- Licence
- Locations
- Microbiome (publishedVersion, cc-by)
- bioRxiv (Cold Spring Harbor Laboratory) (acceptedVersion)
- Europe PMC (PubMed Central) (publishedVersion, cc-by)
- PubMed Central (publishedVersion, cc-by)
- PubMed (publishedVersion)
- DOAJ (DOAJ: Directory of Open Access Journals) (submittedVersion, cc-by-sa)
- Funders
- National Natural Science Foundation of China (31670495)
- Topics
- Life Sciences › Biochemistry, Genetics and Molecular Biology › Molecular Biology › Gut microbiota and health
- Health Sciences › Medicine › Oncology › Drug Transport and Resistance Mechanisms
- Physical Sciences › Chemistry › Organic Chemistry › Steroid Chemistry and Biochemistry
- Keywords
- bile salt hydrolase, human gut microbiome, bile acid deconjugation, Lactobacillus, Bacteroides, population variation, atherosclerosis, diabetes mellitus, dysbiosis, bile acid signaling
- MeSH terms
- Gastrointestinal Microbiome, Amidohydrolases, Amino Acid Sequence, Bacteria, Bile Acids and Salts, Humans, Phylogeny, Protein Structure, Secondary, Enzyme Assays, Molecular Docking Simulation
About these checks
Registry, retraction, Cites and statistics results are computed, not judged, with one exception: a printed reference that no index lists is read once by a model before it counts as a citation error. Claims are extracted by a model and kept only when their quote appears verbatim in the text; each cited source is then checked, with a model’s help, for whether it says what the claim relies on. Those verdicts can be wrong — read the claim’s quote and the cited source before relying on one.
Statistics and arithmetic are recomputed, not judged.
Confidence bands are shown only for fields calibrated on our annotated test set. None is calibrated yet, so no band is shown.
What counts as a claim ›How we measure confidence ›How we check this ›
Are you an author, or do you see a problem with this page? Request a review
