

The DOI matches its Crossref record; 78 of the 78 references it cites were found in a registry or an index.
RapidAIM: a culture- and metaproteomics-based Rapid Assay of Individual Microbiome responses to drugs
Open accessPublished version of a preprint
Abstract
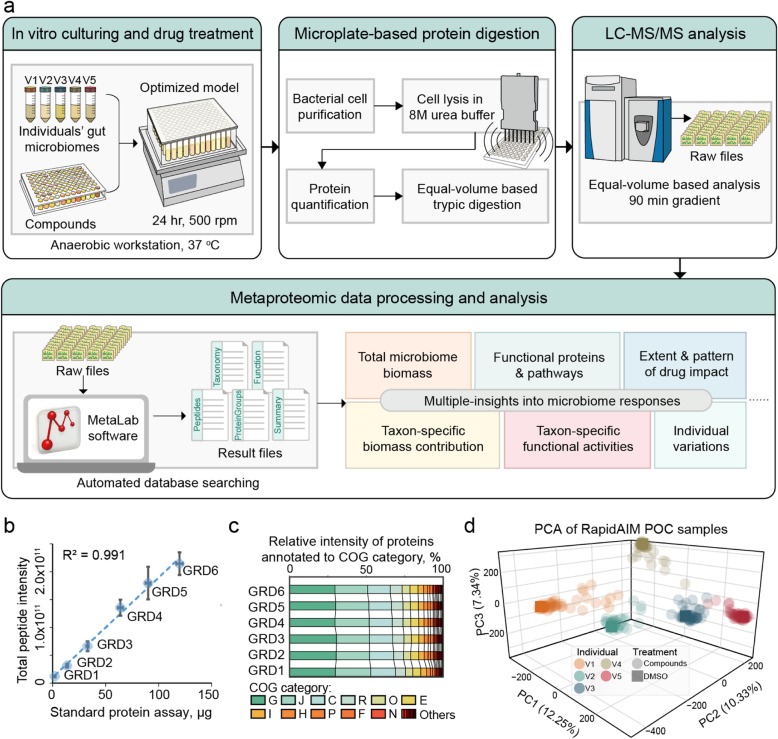
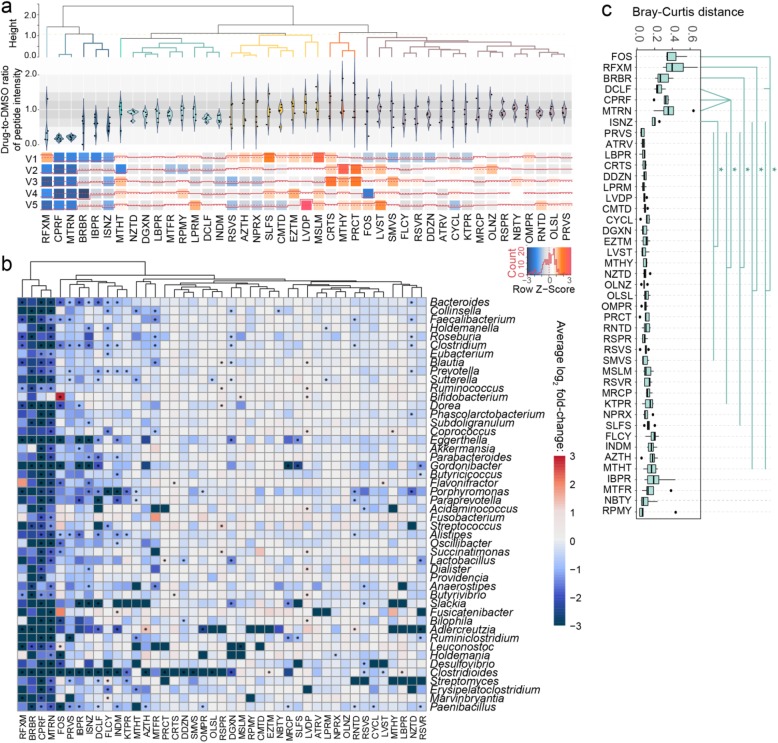
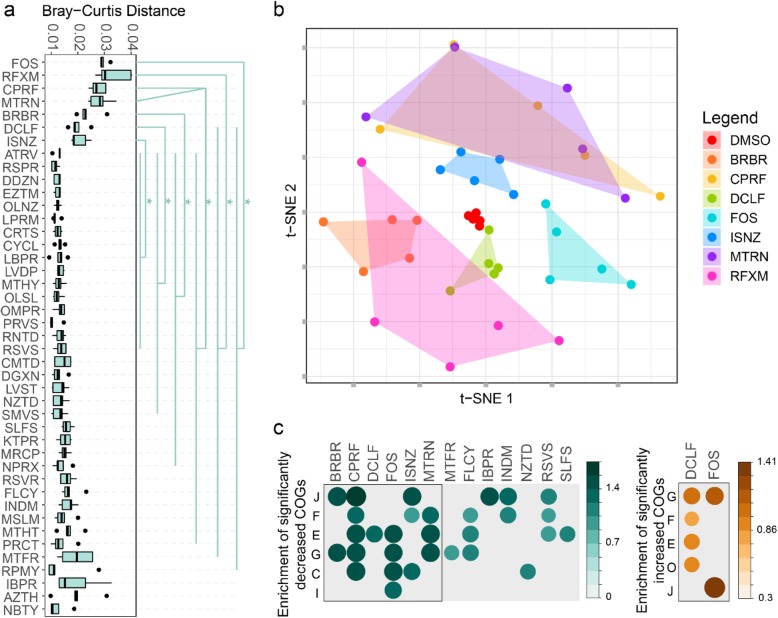
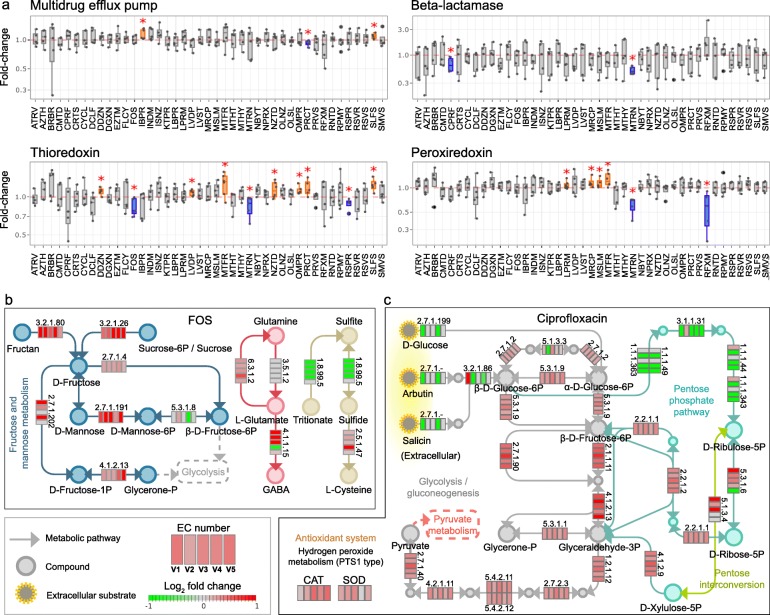
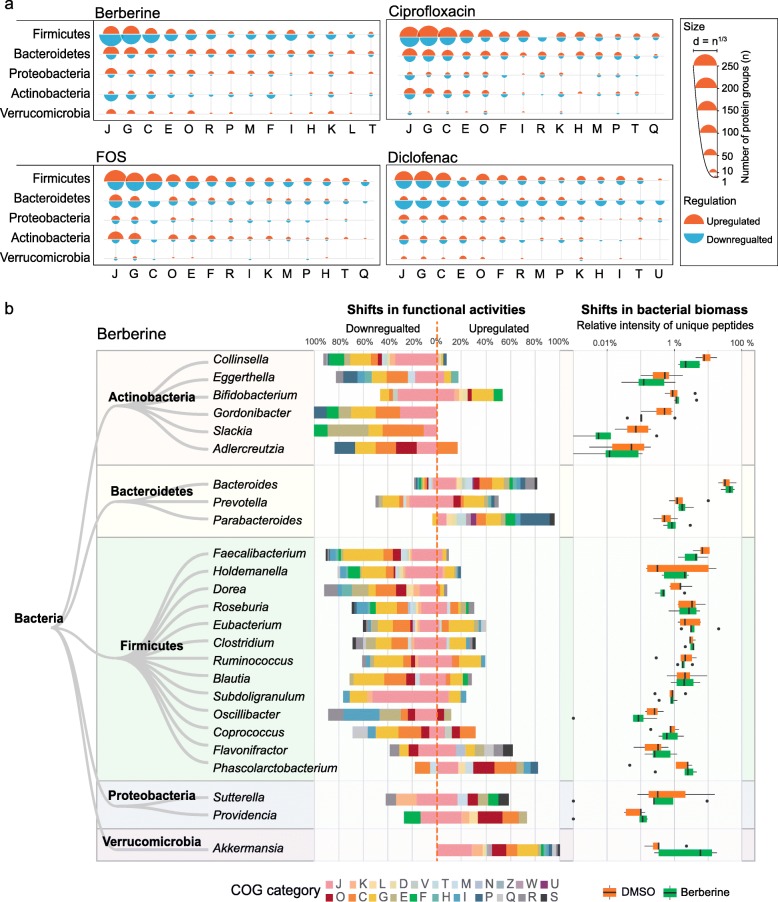
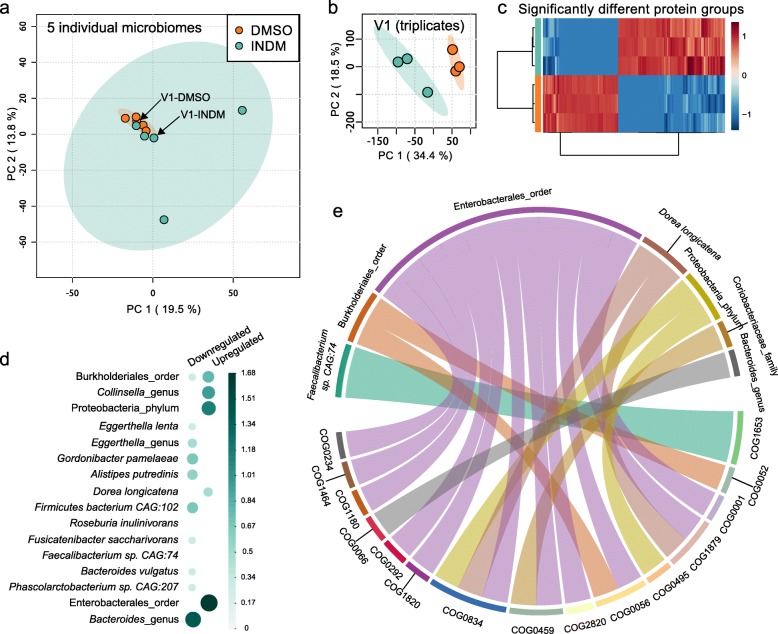
Background: Human-targeted drugs may exert off-target effects or can be repurposed to modulate the gut microbiota. However, our understanding of such effects is limited due to a lack of rapid and scalable assay to comprehensively assess microbiome responses to drugs. Drugs and other compounds can drastically change the overall abundance, taxonomic composition, and functions of a gut microbiome. Results: Here, we developed an approach to screen compounds against individual microbiomes in vitro, using metaproteomics to both measure absolute bacterial abundances and to functionally profile the microbiome. Our approach was evaluated by testing 43 compounds (including 4 antibiotics) against 5 individual microbiomes. The method generated technically highly reproducible readouts, including changes of overall microbiome abundance, microbiome composition, and functional pathways. Results show that besides the antibiotics, the compounds berberine and ibuprofen inhibited the accumulation of biomass during in vitro growth of the microbiota. By comparing genus and species level-biomass contributions, selective antibacterial-like activities were found with 35 of the 39 non-antibiotic compounds. Seven of the compounds led to a global alteration of the metaproteome, with apparent compound-specific patterns of functional responses. The taxonomic distributions of altered proteins varied among drugs, i.e., different drugs affect functions of different members of the microbiome. We also showed that bacterial function can shift in response to drugs without a change in the abundance of the bacteria. Conclusions: Current drug-microbiome interaction studies largely focus on relative microbiome composition and microbial drug metabolism. In contrast, our workflow enables multiple insights into microbiome absolute abundance and functional responses to drugs. The workflow is robust, reproducible, and quantitative and is scalable for personalized high-throughput drug screening applications.
Overview
The claims and statistics of this paper haven’t been checked yet.
Run the check — free, no account needed. It reads the open-access text and checks the sources it cites.
Integrity signals
Registry
Cites
Statistics
Figures
Verification
Claims the paper makes
The claims and statistics of this paper haven’t been checked yet.
Run the check — free, no account needed. It reads the open-access text and checks the sources it cites.
Self-check
Percentages, sums and reported differences re-computed from the paper’s own numbers.
The self-check needs the paper’s full text.
Citations
Cites
Controlling the False Discovery Rate: A Practical and Powerful Approach to Multiple Testing
Benjamini, Y., & Hochberg, Y. (1995) · Journal of the Royal Statistical Society Series B: Statistical Methodology · doi:10.1111/j.2517-6161.1995.tb02031.x · Cited by 109,482
(2008) · Journal of Machine Learning Research · Cited by 33,051
Structure, function and diversity of the healthy human microbiome
The Human Microbiome Project Consortium (2012) · Nature · doi:10.1038/nature11234 · Cited by 11,726
Mind-altering microorganisms: the impact of the gut microbiota on brain and behaviour
Cryan, J. F., & Dinan, T. G. (2012) · Nature Reviews Neuroscience · doi:10.1038/nrn3346 · Cited by 4,572
Kanehisa, M. I., Sato, Y., & Morishima, K. (2015) · Journal of Molecular Biology · doi:10.1016/j.jmb.2015.11.006 · Cited by 4,106
MetaboAnalyst 4.0: towards more transparent and integrative metabolomics analysis
Chong, J., Soufan, O., Li, C., Caraus, I., Li, S., Bourque, G., Wishart, D. S., & Xia, J. (2018) · Nucleic Acids Research · doi:10.1093/nar/gky310 · Cited by 3,637
The Human Intestinal Microbiome in Health and Disease
Lynch, S. V., & Pedersen, O. (2016) · New England Journal of Medicine · doi:10.1056/nejmra1600266 · Cited by 3,637
On the Dependency of Cellular Protein Levels on mRNA Abundance
Liu, Y., Beyer, A., & Aebersold, R. (2016) · Cell · doi:10.1016/j.cell.2016.03.014 · Cited by 3,221
The re-emergence of natural products for drug discovery in the genomics era
Harvey, A. L., Edrada‐Ebel, R., & Quinn, R. J. (2015) · Nature Reviews Drug Discovery · doi:10.1038/nrd4510 · Cited by 2,654
Thompson, A., Schäfer, J., Kuhn, K., Kienle, S., Schwarz, J., Schmidt, G., Neumann, T., & Hamon, C. (2003) · Analytical Chemistry · doi:10.1021/ac0262560 · Cited by 2,425
Research works printed but not linked: 1
- Maier L, Pruteanu M, Kuhn M, Zeller G, Telzerow A, Anderson EE, Brochado AR, Fernandez KC, Dose H, Mori H, et al. Extensive impact of non-antibiotic drugs on human gut bacteria. Nature. 2018;555:623. · DOI · Paper page
Cited by
Sorted by citations
Items 301–330 of 330
Geographic Variation and Host Genetics Shape the Human Skin MicrobiomePreprint
Seong, H. J., & Quince, C. (2025) · bioRxiv (Cold Spring Harbor Laboratory) · doi:10.1101/2025.05.01.651599
Genome sequence of Talaromyces trachyspermus , a biocontrol fungus isolated from broomrapePreprint
Hemmati, R., Dolatabadian, A., Saeedi, S., & Batley, J. (2025) · bioRxiv (Cold Spring Harbor Laboratory) · doi:10.1101/2025.07.07.663553
Ndlovu, K. S., Pavan, R. R., Corry, J., Gregory, A., Mahamed, S., Zotova, N., Tabala, M., Babakazo, P., Funderburg, N., Yotebieng, M., et al. (2025) · bioRxiv (Cold Spring Harbor Laboratory) · doi:10.1101/2025.08.18.670785
Ha, A. D., Howe, D. K., Colton, A. J., Donnell, R. J. M., & Denver, D. R. (2025) · Frontiers in Microbiology · doi:10.3389/fmicb.2025.1619231
High-resolution microbial network analysis defines biocontrol consortia in the wheat phyllospherePreprint
Stalder, L., Spescha, A., Maurhofer, M., & Croll, D. (2025) · bioRxiv (Cold Spring Harbor Laboratory) · doi:10.1101/2025.09.05.674409
Transitions in human gut viral communities from ancient to modern societiesPreprint
Karatas, A. L., Iter, M., Kelman, J., Shahwan, N., Bonver, S., Falta, N. A., Fox, M. M., Fujimoto, C., Gorham, E., Jang, Y., et al. (2025) · bioRxiv (Cold Spring Harbor Laboratory) · doi:10.1101/2025.09.16.676446
Zhao, Z., Liu, S., Nikkhah, H., Zhang, Y., Wang, Y., Liang, J., Lu, S., Beykal, B., Qiao, M., & Li, B. (2025) · bioRxiv (Cold Spring Harbor Laboratory) · doi:10.1101/2025.10.06.680780
Ecology of hydrocarbon degradation in widespread virusesPreprint
Ren, L., Zheng, K., Liang, Y., Wang, H., Wang, Z., Liu, Y., Zhang, X., Dong, Y., Shao, H., Dong, X., et al. (2025) · bioRxiv (Cold Spring Harbor Laboratory) · doi:10.64898/2025.12.08.692962
Self-citationSu, Q., Song, B., González, A. P., Angelidaki, İ., Ng, H. Y., Smets, B. F., Reitzel, K., Thamdrup, B., & Jensen, M. M. (2025) · bioRxiv (Cold Spring Harbor Laboratory) · doi:10.64898/2025.12.17.695019
Shen, S., Wang, J., Ma, C., Chen, Y., Ding, H., & Zhang, J. (2024) · Figshare · doi:10.6084/m9.figshare.26619511
Shen, S., Wang, J., Ma, C., Chen, Y., Ding, H., & Zhang, J. (2024) · Figshare · doi:10.6084/m9.figshare.26619514
Modeling assembly dynamics and stability of microbial communitiesPreprint
Eilersen, A., Sneppen, K., & Bonhoeffer, S. (2025) · bioRxiv (Cold Spring Harbor Laboratory) · doi:10.64898/2025.12.17.694811
Pokrovskaya, M. S., Borisova, A. L., А., Я. А., Sheptulina, A. F., & Drapkina, O. M. (2025) · Russian Journal of Evidence-Based Gastroenterology · doi:10.17116/dokgastro20251404127
Chan, Y., Chiang, P., Lim, S. L., Rogozin, D. Y., Zykov, V. V., Ye, C.-H., & Tang, S. (2026) · bioRxiv (Cold Spring Harbor Laboratory) · doi:10.64898/2026.01.18.698864
Ngcongco, K., Govindsamy, A., Nundkumar, N., & Pillay, K. (2026) · bioRxiv (Cold Spring Harbor Laboratory) · doi:10.64898/2026.02.12.705669
Graells, T., Yi-Ting, L., Rodríguez-García, P., Lukjančenko, O., Schillemans, T., Moll, J. M., Nielsen, H. B., Ahmad, S., Fall, T., & Ärnlöv, J. (2026) · bioRxiv (Cold Spring Harbor Laboratory) · doi:10.64898/2026.02.25.707997
PhyMapNet: A Phylogeny-Guided Bayesian Framework for Reliable Microbiome Network InferencePreprint
Shahdoust, M., Aghdam, R., & Taheri, G. (2026) · bioRxiv (Cold Spring Harbor Laboratory) · doi:10.64898/2026.02.24.707538
Doane, M. P., Martin, B., Kerr, E. N., Dinsdale, E. A., Rangers, M. M., Guida, L., & Kyne, P. M. (2026) · bioRxiv (Cold Spring Harbor Laboratory) · doi:10.64898/2026.03.05.709720
Bayesian inference captures metabolite–bacteria interactions in a microbial community
Jansma, J., Landi, P., & Hui, C. (2026) · ISME Communications · doi:10.1093/ismeco/ycag066 · Cited by 1
Wang, Q., Tian, L., Zhou, Z., & Yan, G. (2026) · Biomedical Signal Processing and Control · doi:10.1016/j.bspc.2026.110119
A billion-year-old bacterial machinery replicates plastid DNA and supports kleptoplastidyPreprint
Antoine, T., Burki, F., Archibald, J. M., Pelletier, É., & Delmont, T. O. (2026) · bioRxiv (Cold Spring Harbor Laboratory) · doi:10.64898/2026.05.23.727376
Petry, B., Boggiatto, P. M., Buckley, A., Cassmann, E. D., Davila, K. M. S., Olsen, S. C., Fernandes, L. G. V., Tibbs‐Cortes, B. W., Rahic-Seggerman, F. M., Palmer, M. V., et al. (2026) · G3 Genes Genomes Genetics · doi:10.1093/g3journal/jkag231
Salimi, Y., Namdarzadeh, B., Dehghani-Arani, F., Vahabie, A., & Rezayat, E. (2026) · Behavioural Brain Research · doi:10.1016/j.bbr.2026.116349
Precision microbiome medicine and therapeutics: the enabling role of in vitro gut models
Huang, Z., Ng, S. C., Sokol, H., & Rolhion, N. (2026) · FEMS Microbiology Reviews · doi:10.1093/femsre/fuag038
Host and environment shape the giant clam-associated photosymbiont communityPreprint
Quijano, J. B., Tayaban, K., Baquiran, J. I., Maala, G. J., Requilme, J. N. C., Sayco, S. L. G., Dolorosa, R. G., Cabaitan, P. C., & Conaco, C. (2026) · bioRxiv (Cold Spring Harbor Laboratory) · doi:10.64898/2026.08.07.743467
Craig, A. M., Clemens, K. J., & Leigh, S. (2026) · Clinical Science · doi:10.1042/cs20250049
Drug–microbiome–host interactions: antimicrobial effects of non-antibiotic compounds
de la Cuesta‐Zuluaga, J., Patil, K. R., & Maier, L. (2026) · Nature Reviews Gastroenterology & Hepatology · doi:10.1038/s41575-026-01258-w
Computational approaches to predicting xenobiotic metabolism by the human gut microbiota
Kolodnitsky, A. S., Lagunin, A. A., & Poroikov, V. (2026) · Expert Opinion on Drug Metabolism & Toxicology · doi:10.1080/17425255.2026.2738611
Jaegher, S. D., Podrini, C., D’Aguanno, M., Santoro, F., & Biazzo, M. (2026) · Frontiers in Microbiology · doi:10.3389/fmicb.2026.1949973
Zhang, D., Chu, H., Zhang, Y., Wang, Y., Zhang, Y., Guo, Y., Wan, P., Yue, H., Sun, G., Chao, Y., et al. (2026) · Gut · doi:10.1136/gutjnl-2026-339603
Metadata
- Authors
- Li, L., Ning, Z., Zhang, X., Mayne, J., Cheng, K., Stintzi, A., & Figeys, D.
- Affiliations
- University of Ottawa (CA)
- Canadian Institute for Advanced Research (CA)
- Corresponding author
- Stintzi, Alain
- Figeys, Daniel
- Venue
- Microbiome
- Published
- 2020-03-11
- Volume
- 8
- Issue
- 1
- Pages
- 33-33
- ISSN
- 2049-2618 (ISSN-L)
- PMC
- PMC7066843
- OpenAlex
- W3010746544
- Cited by
- 328
- References
- 78
- Citations by year
- 2026: 28 · 2025: 60 · 2024: 60 · 2023: 60 · 2022: 53 · 2021: 49 · 2020: 14
- FWCI
- 14.28
- Type
- journal article
- Language
- en
- Open access
- gold
- doi.org
- Locations
- Microbiome (publishedVersion, cc-by)
- bioRxiv (Cold Spring Harbor Laboratory) (acceptedVersion)
- Europe PMC (PubMed Central) (publishedVersion, cc-by)
- PubMed Central (publishedVersion, cc-by)
- PubMed (publishedVersion)
- UEA Digital Repository (University of East Anglia) (acceptedVersion)
- uO Research (University of Ottawa) (submittedVersion, public-domain)
- DOAJ (DOAJ: Directory of Open Access Journals) (submittedVersion, cc-by-sa)
- Funders
- Genome Canada (OGI-114 and OGI-149)
- Canadian Institutes of Health Research (ECD-144627)
- Natural Sciences and Engineering Research Council of Canada (210034)
- Ontario Ministry of Economic Development and Innovation (REG1-4450)
- Topics
- Life Sciences › Biochemistry, Genetics and Molecular Biology › Molecular Biology › Gut microbiota and health
- Physical Sciences › Environmental Science › Ecology › Microbial Community Ecology and Physiology
- Health Sciences › Dentistry › Periodontics › Oral microbiology and periodontitis research
- Keywords
- gut microbiota, drug-microbiome interactions, metaproteomics, antibiotic effects on microbiota, selective antibacterial activity, bacterial biomass, berberine, ibuprofen, drug repurposing, personalized drug screening
- MeSH terms
- Proof of Concept Study, Adult, Anti-Bacterial Agents, Bacteria, Nonprescription Drugs, Feces, Female, Humans, Male, RNA, Ribosomal, 16S, Colony Count, Microbial, Proteomics, Prescription Drugs, Microbiota
About these checks
Registry, retraction, Cites and statistics results are computed, not judged, with one exception: a printed reference that no index lists is read once by a model before it counts as a citation error. Claims are extracted by a model and kept only when their quote appears verbatim in the text; each cited source is then checked, with a model’s help, for whether it says what the claim relies on. Those verdicts can be wrong — read the claim’s quote and the cited source before relying on one.
Statistics and arithmetic are recomputed, not judged.
Confidence bands are shown only for fields calibrated on our annotated test set. None is calibrated yet, so no band is shown.
What counts as a claim ›How we measure confidence ›How we check this ›
Are you an author, or do you see a problem with this page? Request a review
