

The DOI matches its Crossref record; 86 of the 86 references it cites were found in a registry or an index.
The microbiota-gut-brain axis participates in chronic cerebral hypoperfusion by disrupting the metabolism of short-chain fatty acids
Open accessAbstract
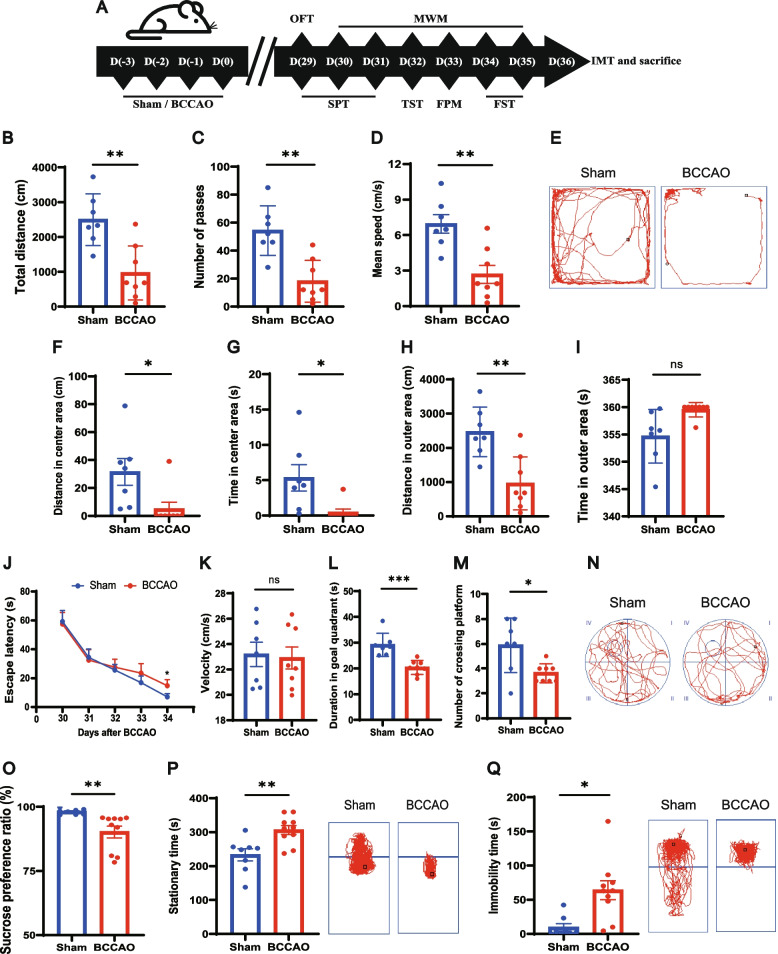
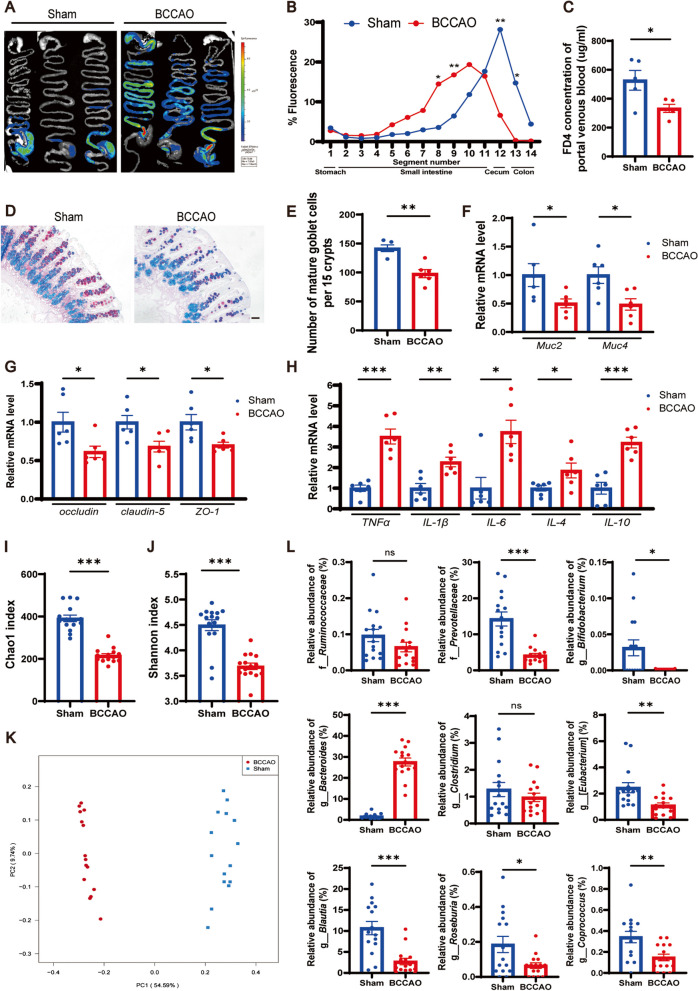
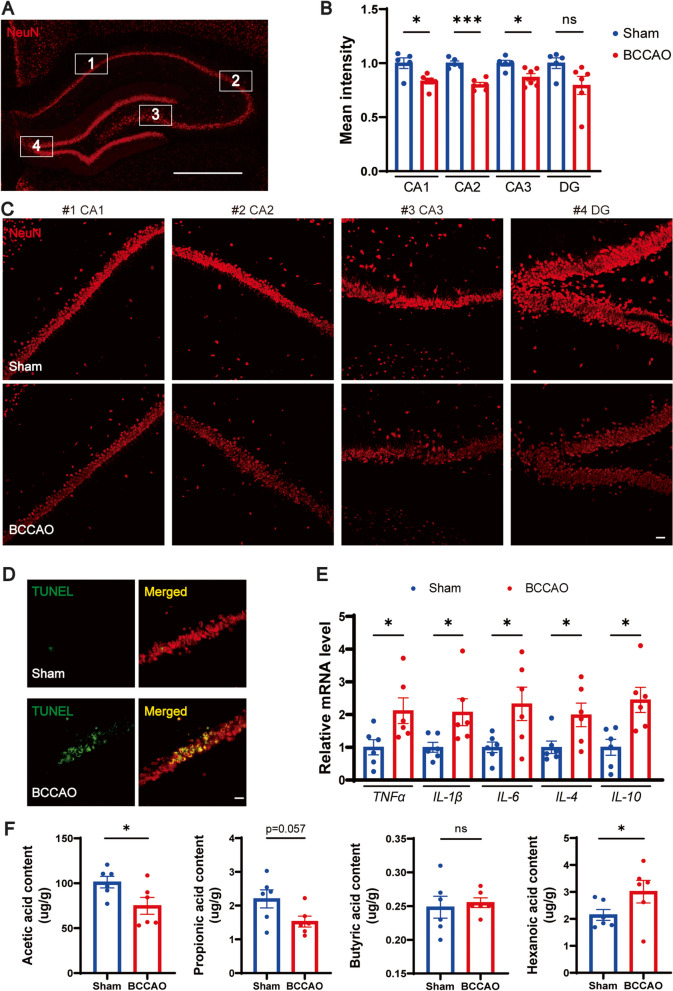
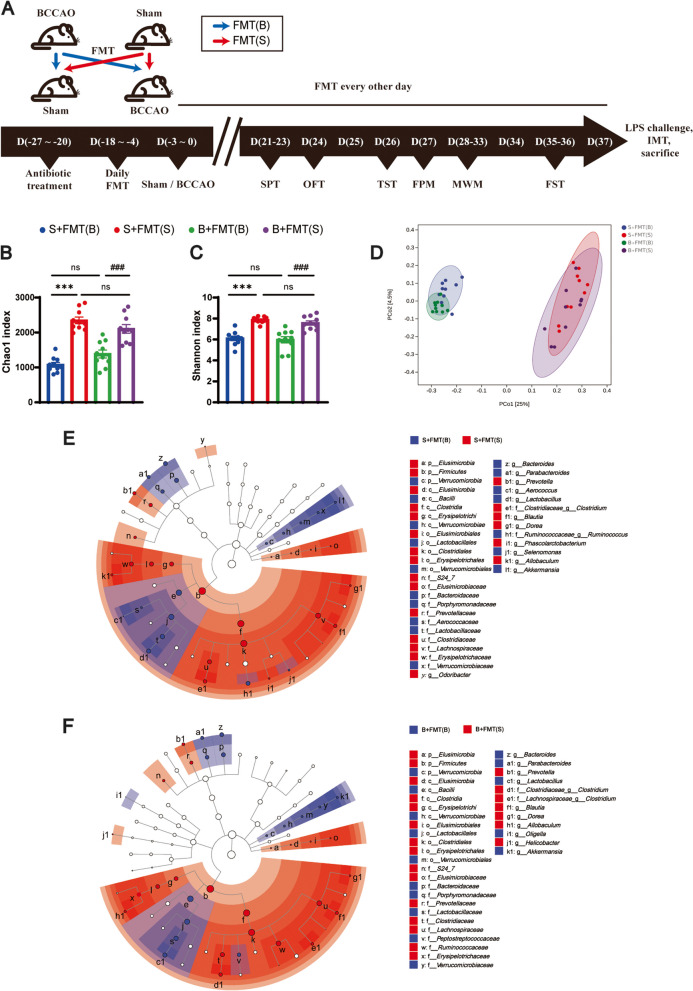
Background: Chronic cerebral hypoperfusion (CCH) underlies secondary brain injury following certain metabolic disorders and central nervous system (CNS) diseases. Dysregulation of the microbiota-gut-brain axis can exacerbate various CNS disorders through aberrantly expressed metabolites such as short-chain fatty acids (SCFAs). Yet, its relationship with CCH remains to be demonstrated. And if so, it is of interest to explore whether restoring gut microbiota to maintain SCFA metabolism could protect against CCH. Results: Rats subjected to bilateral common carotid artery occlusion (BCCAO) as a model of CCH exhibited cognitive impairment, depressive-like behaviors, decreased gut motility, and compromised gut barrier functions. The 16S ribosomal RNA gene sequencing revealed an abnormal gut microbiota profile and decreased relative abundance of some representative SCFA producers, with the decreased hippocampal SCFAs as the further evidence. Using fecal microbiota transplantation (FMT), rats recolonized with a balanced gut microbiome acquired a higher level of hippocampal SCFAs, as well as decreased neuroinflammation when exposed to lipopolysaccharide. Healthy FMT promoted gut motility and gut barrier functions, and improved cognitive decline and depressive-like behaviors by inhibiting hippocampal neuronal apoptosis in BCCAO rats. Long-term SCFA supplementation further confirmed its neuroprotective effect in terms of relieving inflammatory response and hippocampal neuronal apoptosis following BCCAO. Conclusion: Our results demonstrate that modulating the gut microbiome via FMT can ameliorate BCCAO-induced gut dysbiosis, cognitive decline, and depressive-like behaviors, possibly by enhancing the relative abundance of SCFA-producing floras and subsequently increasing SCFA levels.
Overview
The claims and statistics of this paper haven’t been checked yet.
Run the check — free, no account needed. It reads the open-access text and checks the sources it cites.
Integrity signals
Registry
Cites
Statistics
Figures
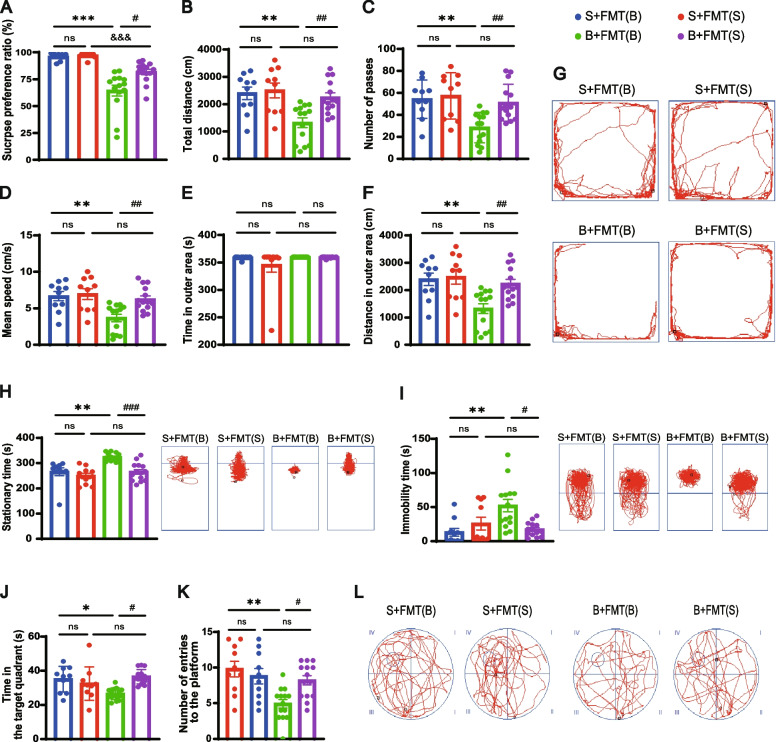
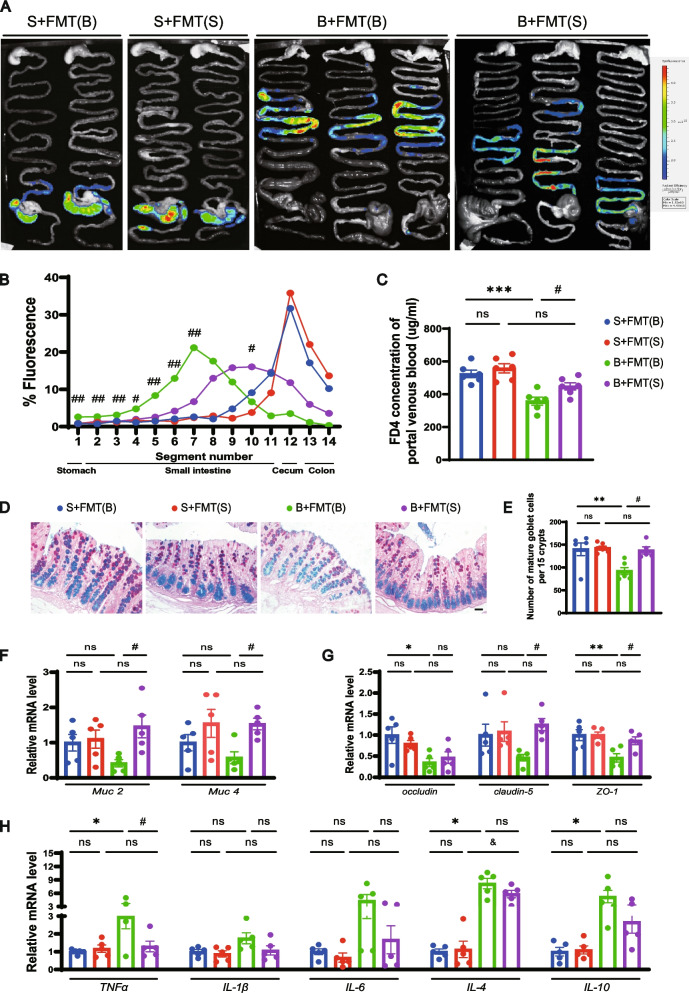
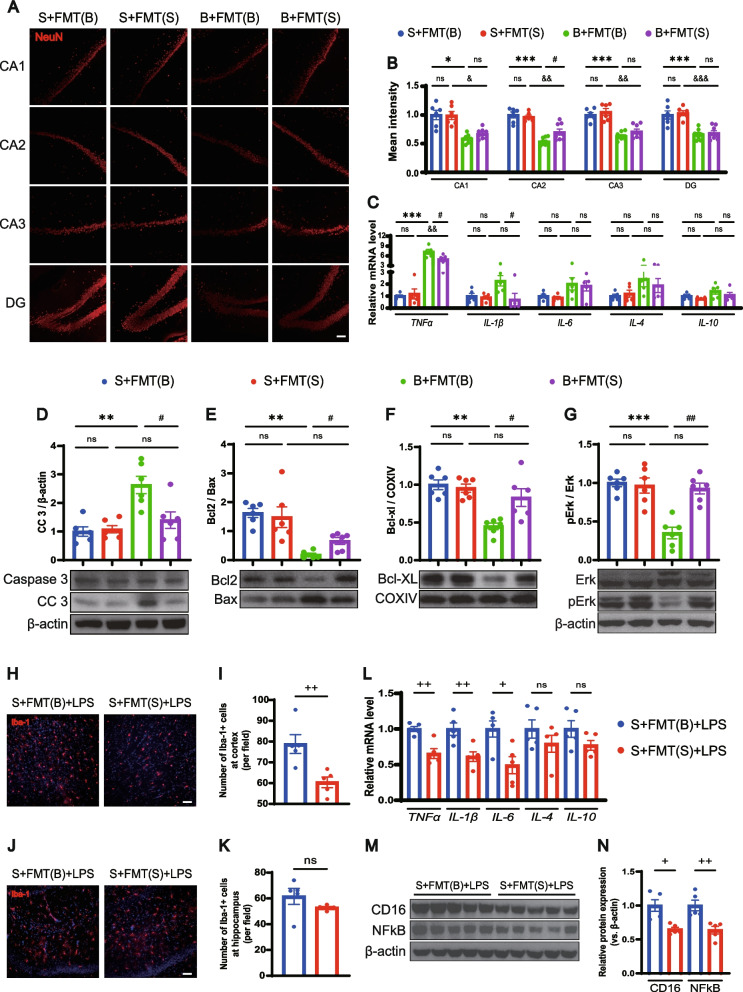
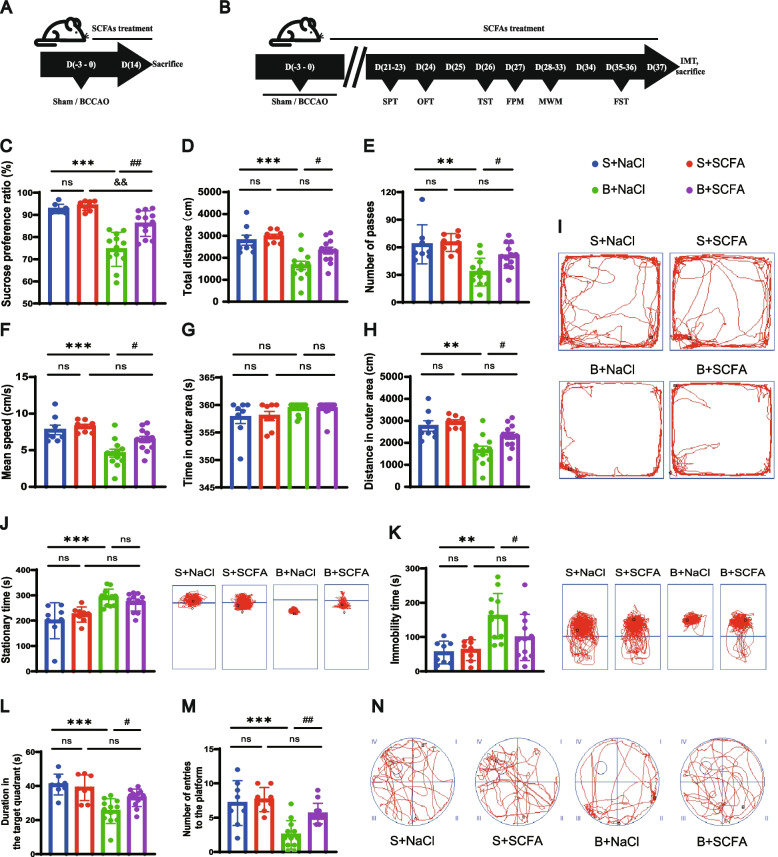
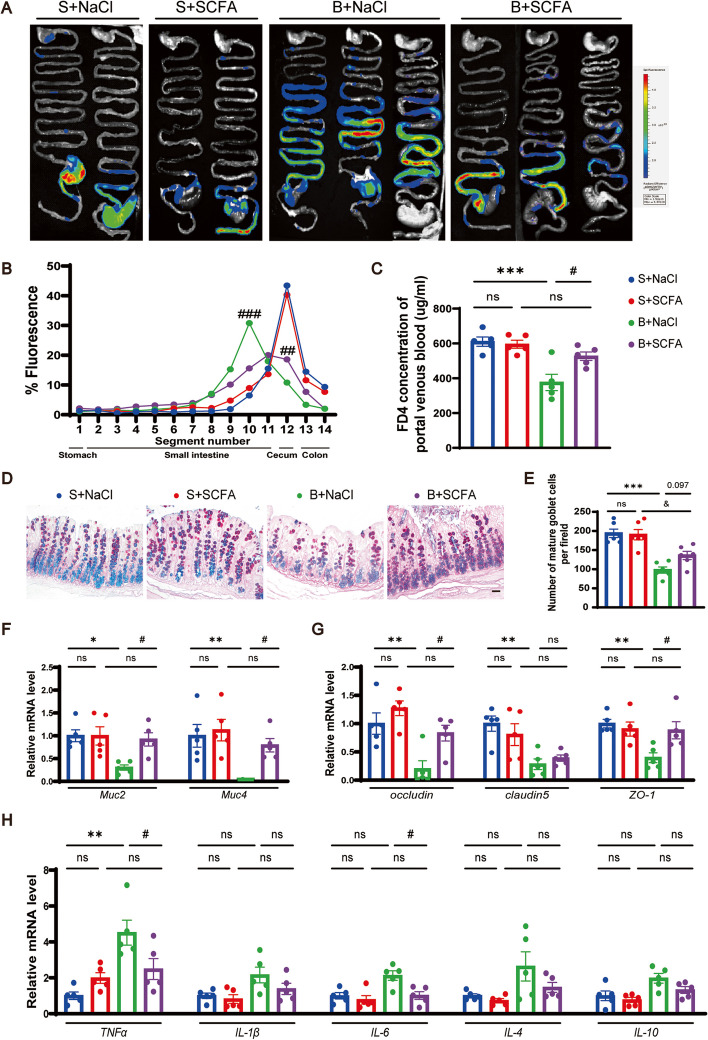
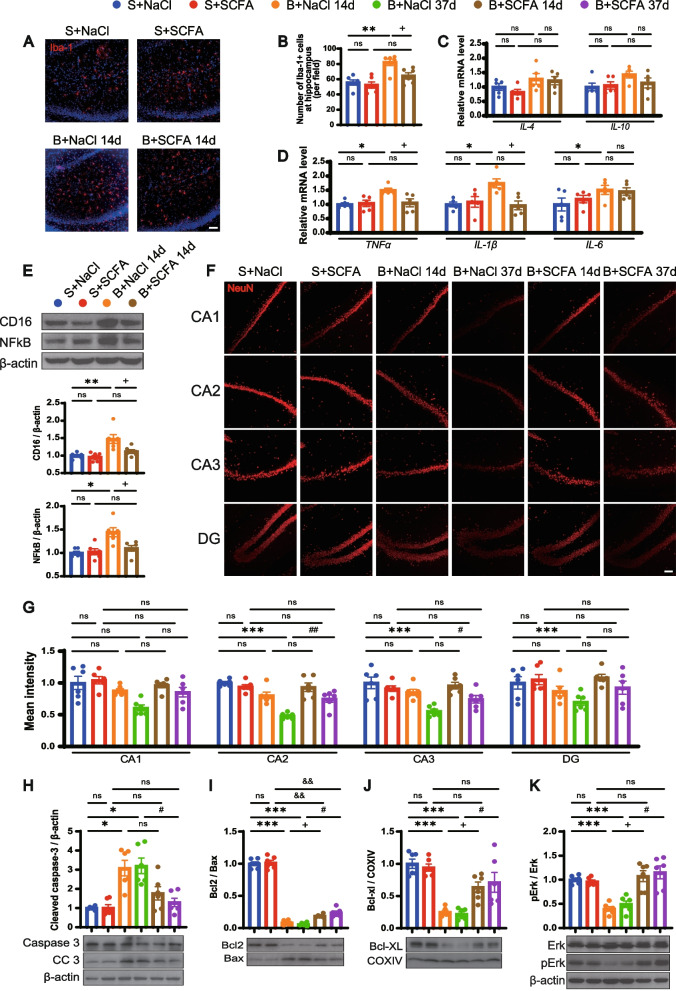
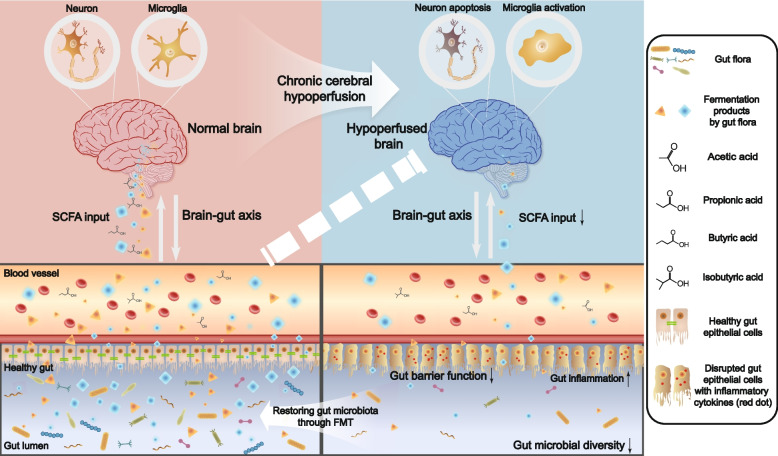
Verification
Claims the paper makes
The claims and statistics of this paper haven’t been checked yet.
Run the check — free, no account needed. It reads the open-access text and checks the sources it cites.
Claims other papers make about this one
Each is checked against this paper’s own text: does it say what the citing paper says it does?
In the citing paper
“Xiao et al. (59) found that modulation of the gut microbiota and supplementation with SCFAs promoted gastrointestinal transit, and modulated intestinal barrier function in a rat model of bilateral carotid artery obstruction, as well as improving symptoms of cognitive decline and depressive-like behavior, revealing the neuroprotective potential of gastrointestinal microbes.”
From Modulation of the gut–brain axis via the gut microbiota: a new era in treatment of amyotrophic lateral sclerosis (2023) · cites this paper as [59]
Self-check
Percentages, sums and reported differences re-computed from the paper’s own numbers.
The self-check needs the paper’s full text.
Citations
Cites
Revised Estimates for the Number of Human and Bacteria Cells in the Body
Sender, R., Fuchs, S., & Milo, R. (2016) · PLOS Biology · doi:10.1371/journal.pbio.1002533 · Cited by 5,425
The gut microbiota shapes intestinal immune responses during health and disease
Round, J. L., & Mazmanian, S. K. (2009) · Nature Reviews Immunology · doi:10.1038/nri2515 · Cited by 5,029
Host microbiota constantly control maturation and function of microglia in the CNS
Erny, D., Hrabě de Angelis, A. L., Jaitin, D., Wieghofer, P., Staszewski, O., David, E., Keren-Shaul, H., Mahlakoiv, T., Jakobshagen, K., Buch, T., et al. (2015) · Nature Neuroscience · doi:10.1038/nn.4030 · Cited by 3,569
The role of short-chain fatty acids in microbiota–gut–brain communication
Dalile, B., Van Oudenhove, L., Vervliet, B., & Verbeke, K. (2019) · Nature Reviews Gastroenterology & Hepatology · doi:10.1038/s41575-019-0157-3 · Cited by 3,357
Brown, A. J., Goldsworthy, S. M., Barnes, A. A., Eilert, M. M., Tcheang, L., Daniels, D., Muir, A. I., Wigglesworth, M. J., Kinghorn, I., Fraser, N. J., et al. (2003) · Journal of Biological Chemistry · doi:10.1074/jbc.m211609200 · Cited by 2,409
Gut microbiome alterations in Alzheimer’s disease
Vogt, N. M., Kerby, R. L., Dill-McFarland, K. A., Harding, S. J., Merluzzi, A. P., Johnson, S. C., Carlsson, C. M., Asthana, S., Zetterberg, H., Blennow, K., et al. (2017) · Scientific Reports · doi:10.1038/s41598-017-13601-y · Cited by 2,137
Zheng, P., Zeng, B., Zhou, C., Liu, M., Fang, Z., Xu, X., Zeng, L., Chen, J., Fan, S., Du, X., et al. (2016) · Molecular Psychiatry · doi:10.1038/mp.2016.44 · Cited by 2,023
The Pathobiology of Vascular Dementia
Iadecola, C. (2013) · Neuron · doi:10.1016/j.neuron.2013.10.008 · Cited by 1,857
Le Poul, E., Loison, C., Struyf, S., Springael, J.-Y., Lannoy, V., Decobecq, M.-E., Brezillon, S., Dupriez, V., Vassart, G., Van Damme, J., et al. (2003) · Journal of Biological Chemistry · doi:10.1074/jbc.m301403200 · Cited by 1,651
The central nervous system and the gut microbiome
Sharon, G., Sampson, T. R., Geschwind, D. H., & Mazmanian, S. K. (2016) · Cell · doi:10.1016/j.cell.2016.10.027 · Cited by 1,513
Cited by
Sorted by citations
Items 101–200 of 251
Klepinowski, T., Skonieczna‐Żydecka, K., Pala, B., Stachowska, E., & Sagan, L. M. (2023) · Frontiers in Neuroscience · doi:10.3389/fnins.2023.1247151 · Cited by 12
Composition and Function of Gut Microbiome: From Basic Omics to Precision Medicine
Ma, Y., Wang, L., Hu, H., Shieh, A. R.-E., Li, E., He, D., He, L., Liu, Z., Paing, T. M., Chen, X., et al. (2026) · Genes · doi:10.3390/genes17010116 · Cited by 13
Ye, H.-M., Li, Z., Zhang, P., Kang, Z., & Zhou, D.-S. (2024) · Chinese Journal of Integrative Medicine · doi:10.1007/s11655-024-3766-9 · Cited by 12
Li, Y., Sun, M., Tian, X., Bao, T., Yu, Q., Ling, N., Gan, R., Cheang, W. S., & Wu, X. F. (2024) · The Journal of Nutritional Biochemistry · doi:10.1016/j.jnutbio.2024.109709 · Cited by 11
Gut Lactococcus garvieae promotes protective immunity to foodborne Clostridium perfringens infection
Wang, X.-Y., Fan-hua, M., Zhang, M., Li, F.-X., Lei, Y.-X., Ma, Z.-G., Li, J., Lou, Y.-N., Chu, Y., Ma, K., et al. (2024) · Microbiology Spectrum · doi:10.1128/spectrum.04025-23 · Cited by 11
Wei, H., Chen, Y., Qin, Z., Wang, H., Liu, Y., Song, T., Wu, Y., Hu, W., Huang, X., Lu, G., et al. (2025) · Neuropharmacology · doi:10.1016/j.neuropharm.2025.110426 · Cited by 11
Petrisko, T. J., Gargus, M. D., Chu, S., Selvan, P., Whiteson, K., & Tenner, A. J. (2023) · Journal of Neuroinflammation · doi:10.1186/s12974-023-02885-9 · Cited by 11
Ding, L., Wang, J., Qiu, S., Ren, Z., Li, Y., & An, P. (2024) · Molecular Neurobiology · doi:10.1007/s12035-024-04176-7 · Cited by 11
Zhong, G., Wang, X., Zhang, Q., Zhang, X., Fang, X., Li, S., Pan, Y., Ma, Y., Wang, X., Wan, T., et al. (2024) · Phytotherapy Research · doi:10.1002/ptr.8316 · Cited by 10
Wang, J., Shen, Y., Li, L., Li, L., Zhang, J., Li, M., & Qiu, F. (2024) · The Journal of Nutritional Biochemistry · doi:10.1016/j.jnutbio.2024.109777 · Cited by 12
Gut microbiota and sepsis-associated encephalopathy: pathogenesis and precision therapies
Wei, N., Dai, S., Li, W., Zhou, J., & Chen, Y. (2025) · Frontiers in Neuroscience · doi:10.3389/fnins.2025.1596467 · Cited by 11
Wu, Y., Sun, J., Chen, M., Lin, Q. D., Jin, K.-Y., Su, S., & Hai, J. (2023) · International Immunopharmacology · doi:10.1016/j.intimp.2023.111108 · Cited by 10
Xiao, W., Su, J., Gao, X., Yang, H., Weng, R., Ni, W., & Gu, Y. (2022) · Microbiome · doi:10.1186/s40168-022-01277-0 · Cited by 10
Self-citationNguyen, H. D., Vu, G. H., & Kim, W. (2024) · Aspects of Molecular Medicine · doi:10.1016/j.amolm.2024.100047 · Cited by 9
Xiao, L., Liu, J., Qin, L., Deng, S., Mo, G., Zhang, D., & Huang, B. (2025) · Poultry Science · doi:10.1016/j.psj.2025.104981 · Cited by 9
Si, J., Yu, K., Hao, J., Wang, J., & Zhang, L. (2025) · Therapeutic Advances in Neurological Disorders · doi:10.1177/17562864251332035 · Cited by 9
Chen, L., Zhuo, L., Zheng, J., Sun, X., Sun, J., & Liu, J. (2025) · Journal of Translational Medicine · doi:10.1186/s12967-025-06803-w · Cited by 9
Zhang, L., Chen, X., Li, J., Hou, Q., Song, J., Fu, X., Liu, Y., Jin, B., Feng, Y., Zhang, W., et al. (2025) · International Journal of Biological Macromolecules · doi:10.1016/j.ijbiomac.2025.147728 · Cited by 9
Liu, T., Zhou, L., Dong, R., Qu, Y., Liu, Y., Wei, S., Lv, J., Wu, S., Peng, W. H., & Shi, L. S. (2024) · Journal of Agricultural and Food Chemistry · doi:10.1021/acs.jafc.4c07351 · Cited by 9
Chen, L., Yan, L., Zhang, X., Du, X., Zhang, Y., Li, X., Zhong, Z., Zhou, C., Liu, X., Wang, J., et al. (2024) · International Journal of Biological Macromolecules · doi:10.1016/j.ijbiomac.2024.134186 · Cited by 8
Han, X., Du, L., Dou, Y., Wang, H., Lv, M., Wang, L., Xiao, J., Yin, J., & Wu, J. (2025) · Journal of Nanobiotechnology · doi:10.1186/s12951-025-03711-5 · Cited by 9
Gut microbiota, nutrients, and depression
Qiao, Y., Rong, L., Chen, H., Guo, J., Li, G., Wang, Q., Bi, H., Wei, L., & Gao, T. (2025) · Frontiers in Nutrition · doi:10.3389/fnut.2025.1581848 · Cited by 11
Zhang, L., Wu, Z., Shen, H., Meng, Y., Li, H., Cai, R., Tang, D., Kang, M., Yin, Y., Tan, B., et al. (2026) · Microbiome · doi:10.1186/s40168-025-02310-8 · Cited by 8
Natural products: Harnessing the power of gut microbiota for neurological health
Cheng, H., Liu, J., Zhang, D., Wu, J., Wu, J., Zhou, Y., Tan, Y., Feng, W., & Peng, C. Y. (2024) · Phytomedicine · doi:10.1016/j.phymed.2024.156019 · Cited by 7
Asperuloside Suppresses the Development of Depression through Wnt3α/GSK-3β Signal Pathway in Rats
Yin, L. H., Lu, C.-S., Zeng, S., Jiang, D.-Q., Zeng, G., & Wang, H. (2024) · Biological and Pharmaceutical Bulletin · doi:10.1248/bpb.b24-00200 · Cited by 7
Xie, Q., Sun, J., Sun, M., Wang, Q., & Wang, M. (2024) · Multiple Sclerosis and Related Disorders · doi:10.1016/j.msard.2024.105936 · Cited by 7
Zhang, Y., Li, H., Li, B., Li, Y., Chai, X., Li, S., Xia, X., Li, H., Zhao, Y., Tang, Y., et al. (2025) · Frontiers in Microbiology · doi:10.3389/fmicb.2025.1535451 · Cited by 8
Li, P., Zhang, Y., Lang, H., Hou, P., Yao, Y., Zhang, R., Wang, X., Zhang, Q., Mi, M., & Yi, L. (2025) · Molecular Nutrition & Food Research · doi:10.1002/mnfr.202400491 · Cited by 7
Jing, Z., Zhang, J., Hou, L., Yang, C., Jiang, L., & Liang, D. (2025) · Materials Today Bio · doi:10.1016/j.mtbio.2025.101665 · Cited by 7
Wang, D., Yao, H., Wang, L., Lu, B., Liu, W., Li, J., Gong, Y., Cai, Y., Li, Y., Cai, X., et al. (2025) · Frontiers in Microbiology · doi:10.3389/fmicb.2025.1564928 · Cited by 7
Li, S., Yang, P., Cai, X., He, M. L., He, Y., & He, F. (2025) · European Journal of Pharmacology · doi:10.1016/j.ejphar.2025.177787 · Cited by 7
Li, S., He, M., He, Y., Jin, T., Chen, J., Peng, J., Hu, W., & He, F. (2025) · Journal of Agricultural and Food Chemistry · doi:10.1021/acs.jafc.5c02024 · Cited by 8
Lu, R., Yang, J., Fan, R., Li, H., Liu, Y., Wang, T., Yu, Y., Zhang, R., Liu, J., Liu, J., et al. (2025) · Phytomedicine · doi:10.1016/j.phymed.2025.156997 · Cited by 7
Chronic stress in mice: how gut bacteria influence gene activity in key brain neurons
Jiang, W., Li, Y., Yang, J., Tan, X., Tian, R., Ma, G., Wu, J., Zhang, J., Huang, Y., Liu, P., et al. (2025) · Translational Psychiatry · doi:10.1038/s41398-025-03479-0 · Cited by 7
Liu, M., Pang, Y., Xu, L., Ji, T., Yang, J., Huang, D., Cheng, M., Chen, M. H., Huang, B., Xu, S., et al. (2025) · Journal of Neurotrauma · doi:10.1177/08977151251367404 · Cited by 8
Fan, Y., Xiao, B., Zhou, H., Liu, Z., Wang, L., Jin, W., Yin, Y., & Mao, X. (2025) · Pharmacological Research · doi:10.1016/j.phrs.2025.108031 · Cited by 7
Ying, G., Yu, J., Jiao, L., Liang, J., Wu, Z., Pan, B., Gao, S., Suhong, C., & Lv, G. (2025) · Journal of Ethnopharmacology · doi:10.1016/j.jep.2025.121053 · Cited by 7
Liu, Y. J., Li, Z., Sun, T., Li, Z., Manyande, A., Xiang, H., & He, Z. (2024) · CNS Neuroscience & Therapeutics · doi:10.1111/cns.14610 · Cited by 7
Gut microbiota linked to hydrocephalus through inflammatory factors: a Mendelian randomization study
Shen, Y., Li, C., Zhang, X., Wang, Y., Zhang, H., Zhao, Y., Gui, B., Hu, R., Li, Q., Gao, A., et al. (2024) · Frontiers in Immunology · doi:10.3389/fimmu.2024.1372051 · Cited by 7
Zhang, J., Chen, K., & Chen, F. (2024) · Journal of Pharmaceutical Analysis · doi:10.1016/j.jpha.2024.101077 · Cited by 7
Ortlek, B. E., & Akan, Ö. B. (2025) · IEEE Transactions on Molecular Biological and Multi-Scale Communications · doi:10.1109/tmbmc.2025.3585798 · Cited by 10
Gut–liver axis dysregulation and microbial dysbiosis in invasive liver abscess: a narrative review
Bai, X., Wang, Z., Guo, K., Zhou, P., & Shi, L. (2025) · Frontiers in Immunology · doi:10.3389/fimmu.2025.1646893 · Cited by 6
Remember the gut: The emerging role of microbial SCFAs in cognitive health
de Paiva, I. H. R., Duarte-Silva, E. P., & Peixoto, C. A. (2025) · Food Bioscience · doi:10.1016/j.fbio.2025.107838 · Cited by 8
Qiu, Y., Mo, C., Li, J., Chen, L., Kang, Y., Chen, G., & Zhu, T. (2024) · Biochemical and Biophysical Research Communications · doi:10.1016/j.bbrc.2024.150492 · Cited by 6
Microbiome dysbiosis by antibiotics protects cartilage degradation in OAOP mice
Yin, Q., Gu, J., Ren, P., Guan, Z., Wang, Y., Bai, R., & Liu, Y. (2024) · Journal of Endocrinology · doi:10.1530/joe-23-0330 · Cited by 6
Xiao, W., Su, J., Gao, X., Yang, H., Weng, R., Ni, W., & Gu, Y. (2024) · Microbiome · doi:10.1186/s40168-024-01842-9 · Cited by 6
Self-citationGarg, G., Trisal, A., & Singh, A. K. (2025) · Neuroscience · doi:10.1016/j.neuroscience.2025.03.020 · Cited by 6
Meng, T., Zhang, Y., Fu, S., & Ma, S. (2025) · Research · doi:10.34133/research.0846 · Cited by 6
Wu, H., Pang, M.-M., Li, Y.-L., Hong, J., Liu, P.-M., Bian, M., & Yang, J. (2025) · Drug Design Development and Therapy · doi:10.2147/dddt.s540116 · Cited by 5
Liu, X., Ning, L., Fan, W., Jia, C., & Ge, L. (2025) · Nutrition Reviews · doi:10.1093/nutrit/nuaf156 · Cited by 6
Su, S., Chen, M., Lu, D., Wu, Y.-F., Huang, X.-S., & Zhang, L. (2025) · The Journal of Nutritional Biochemistry · doi:10.1016/j.jnutbio.2025.110122 · Cited by 5
Ren, Y., Sun, Y., Liu, Q., Chen, J.-L., Chen, Y.-H., Sun, L., Cui, Z., Yan, S.-Y., Cheng, L., Li, N., et al. (2025) · Phytomedicine · doi:10.1016/j.phymed.2025.157297 · Cited by 5
wang, X., Liu, M., Cao, L., Huang, H., Yang, J., Zhang, H., pan, C., & Xu, Z. (2025) · Brain Behavior & Immunity - Health · doi:10.1016/j.bbih.2025.101150 · Cited by 5
Meng, W., Ma, Z., Ye, H., Liu, L., Han, Q., & Shi, Q. (2024) · Journal of Materials Chemistry B · doi:10.1039/d3tb02676k · Cited by 5
Yi, C., Zou, H., Lin, X., Liu, S., Wang, J., Tian, Y., Deng, X., Luo, J., Li, C., & Long, Y. (2024) · Heliyon · doi:10.1016/j.heliyon.2024.e29723 · Cited by 5
Ma, Z., Wen, X., Zhang, Y., Ai, Z., Zhao, X., Dong, N., Dou, X., & Shan, A. (2025) · Journal of Agricultural and Food Chemistry · doi:10.1021/acs.jafc.4c10406 · Cited by 5
Fan, M., Jiang, Y., Cai, C., Wang, Z., Chen, Z., Zhang, X., Yin, H., Hu, S., Liu, J., Qian, Z., et al. (2025) · International Journal of Biological Macromolecules · doi:10.1016/j.ijbiomac.2025.144008 · Cited by 5
Liu, S., Yang, Y., Zong, Y., Chen, W., Geng, J., Zhao, Y. D., Du, R., & He, Z. (2025) · Phytomedicine · doi:10.1016/j.phymed.2025.156838 · Cited by 5
Liu, F., Yu, J., Chen, Z., Zhang, S., Zhang, Y., Zhang, L., Zhang, Y., Li, J., Ding, L., & Wu, J. (2025) · Poultry Science · doi:10.1016/j.psj.2025.104944 · Cited by 6
Total Saponins of Panax notoginseng Leaves Alleviate Vascular Dementia via the Gut–Brain Axis
Ren, Y., Sun, Y., Sun, L., Chen, J.-L., Chen, Y.-H., Yan, S.-Y., Cheng, L., Yuan, J., & Li, X. (2025) · The American Journal of Chinese Medicine · doi:10.1142/s0192415x25500430 · Cited by 5
Shi, Q., Wu, W., Sun, X., Liu, Y., Zeng, J., Li, W., Dai, X., Gong, G., & Huang, Q. (2025) · Frontiers in Aging Neuroscience · doi:10.3389/fnagi.2025.1710009 · Cited by 4
Zhu, L., Hu, J., Li, J., Qu, X., Zhou, X., Gan, G., Liu, Y., Liu, S., & Chen, X. (2025) · BMC Complementary Medicine and Therapies · doi:10.1186/s12906-025-05190-5 · Cited by 5
Zhao, Z., Dong, M., Mu, Z., ZHENG, Z., & ZHANG, Z. (2025) · Journal of Pharmaceutical Analysis · doi:10.1016/j.jpha.2025.101521 · Cited by 4
Wang, L., Zhang, S., Liu, Y., Li, D., Tian, G., Li, X., & Li, Y. (2026) · Scientific Reports · doi:10.1038/s41598-026-41801-y · Cited by 7
Interaction of major facilitator superfamily domain containing 2A with the blood–brain barrier
Ma, Y., Dong, T., Luan, F., Yang, J., Feng, M., & Wei, P. (2024) · Neural Regeneration Research · doi:10.4103/nrr.nrr-d-24-00191 · Cited by 4
Bridging the gap between gut microbiota and sleep disorders through intermediary metabolites
Zhang, Y., Zhou, S., Han, H., & Du, X. (2025) · Journal of Affective Disorders · doi:10.1016/j.jad.2024.12.104 · Cited by 4
Zhong, Z., Fan, F., Lv, J., Wang, Z., Wang, B., Chen, D., & Sun, L. (2025) · Frontiers in Microbiology · doi:10.3389/fmicb.2025.1483794 · Cited by 4
The rise of probiotics as adjuvant therapeutics in Alzheimer’s disease
Noreña, C. P. Z., & Brandelli, A. (2025) · Discover Food · doi:10.1007/s44187-025-00523-2 · Cited by 6
Gut-brain connection in schizophrenia: A narrative review
Iqbal, A., Bokhari, S. F. H., Rehman, M. U., Sattar, S. M. F., Bakht, D., Dost, W., & Basit, A. (2025) · World Journal of Psychiatry · doi:10.5498/wjp.v15.i5.103751 · Cited by 6
Cui, X., Yi, C., Liu, J., Qi, J., Deng, W., Yuan, X., Zhou, R., Chen, M., Xiang, Q., & Xu, H. (2025) · Investigative Ophthalmology & Visual Science · doi:10.1167/iovs.66.9.6 · Cited by 4
Bibliometric analysis of the gut microbiota and stroke from 2002 to 2022
Wang, C., Zhu, H., Li, Y., Zhang, Y., Ye, Y., Zhong, Y., Qiu, S., Xiong, X., & Jian, Z. (2024) · Heliyon · doi:10.1016/j.heliyon.2024.e30424 · Cited by 4
Karska, J., Skonieczna‐Żydecka, K., Jakubiak, N., Czarnecka, W., & Misiak, B. (2025) · Progress in Neuro-Psychopharmacology and Biological Psychiatry · doi:10.1016/j.pnpbp.2025.111430 · Cited by 4
Zeng, K.-H., Yu, L.-P., Chen, Z., & Li, X. (2025) · Brain Research Bulletin · doi:10.1016/j.brainresbull.2025.111677 · Cited by 3
Matsukawa, H., Fujita, M., Kuramoto, Y., Kuwahara, S., Tsuji, S., Takeda, Y., Son, A., Kato, T., Shirakawa, M., & Yoshimura, S. (2026) · Neurosurgery · doi:10.1227/neu.0000000000004035 · Cited by 3
Engineering the Gut Microbiome: Emerging Genome-Editing Strategies and Therapeutic Applications
Liu, W., Li, Z., Zhu, J., Sun, Z., Yan, L., Luo, M., Chen, H., & Yin, Y. (2026) · Microorganisms · doi:10.3390/microorganisms14061174 · Cited by 4
Li, X., Ren, Y., Gao, X., Wang, H., Zhang, J., Xie, J., Liang, J., Zhao, B., Zhou, H., & Yin, J. (2024) · Journal of Cerebral Blood Flow & Metabolism · doi:10.1177/0271678x241309777 · Cited by 6
Self-citationMao, P., Hu, J., Mai, X., Li, N., Liao, Y., Feng, L., & Long, Q.-H. (2025) · International Journal of Molecular Sciences · doi:10.3390/ijms26041560 · Cited by 3
Fecal microbiota transplantation for glaucoma; a potential emerging treatment strategy
Ebrahimi, R., Farsi, Y., & Nejadghaderi, S. A. (2024) · Current Research in Microbial Sciences · doi:10.1016/j.crmicr.2024.100314 · Cited by 4
Zhang, Q., Gao, Z., Deng, Y., Xu, X., Sun, W., Liu, R., Zhang, T., & Sun, X. (2025) · Frontiers in Microbiology · doi:10.3389/fmicb.2025.1577597 · Cited by 3
Innovative drug discovery for cardiovascular metabolic inflammation diseases
Zhao, Y., Wang, Q., Ma, Y., Wang, J., Han, Y., & Ji, Y. H. (2025) · British Journal of Pharmacology · doi:10.1111/bph.70131 · Cited by 2
Tang, T., Yang, L., Liu, H., Fan, X., Wang, H., Tao, X., Zhang, F., & Chen, W. (2025) · Journal of Agriculture and Food Research · doi:10.1016/j.jafr.2025.102304 · Cited by 2
Gu, M., Peng, X., Dai, X., Ma, X., Ge, W., Yang, S., & Wei, W. (2025) · Biochemical and Biophysical Research Communications · doi:10.1016/j.bbrc.2025.152846 · Cited by 2
Zhou, Y., Yu, J., Qi, L., Tan, H., & Xiao, J. (2025) · Journal of Affective Disorders · doi:10.1016/j.jad.2025.120523 · Cited by 2
Liang, Y., Sheng, R., Hu, Y., Huang, D., Li, X., Deng, H., & Liu, D. (2025) · Microbial Pathogenesis · doi:10.1016/j.micpath.2025.108204 · Cited by 2
Role of gut microbiomes in different ocular pathologies: A systematic review
Priyanka, P., Khullar, S., Singh, M., Morya, A. K., Sharma, B., Periasamy, B., Moharana, B., & Morya, R. (2025) · World Journal of Gastrointestinal Pathophysiology · doi:10.4291/wjgp.v16.i4.113488 · Cited by 2
Zhang, Y., Chen, L., Jin, J., Xin, Y., Wang, J., & Zhang, A. (2025) · Experimental Neurology · doi:10.1016/j.expneurol.2025.115631 · Cited by 2
Peng, L., Zhang, Z., Hu, Y., Chen, H., Tian, Y., & Ling, H. (2026) · Frontiers in Immunology · doi:10.3389/fimmu.2026.1706811 · Cited by 2
Chen, H.-Y., Sun, X., Huang, H., Huang, W.-Q., Liu, C., & Liu, S. (2026) · Systematic and Applied Microbiology · doi:10.1016/j.syapm.2026.126696 · Cited by 2
Ma, Z., Shi, H., Bai, X., Wang, Z. P., Cao, J., Dong, Y., & Chen, Y. (2026) · Gut Microbes · doi:10.1080/19490976.2026.2667735 · Cited by 3
Exploring the therapeutic potential of quercetin: Mitigating neuroinflammation
Kaundal, R. S., Pandey, T., & Pandey, V. P. (2024) · Neuroscience and Behavioral Physiology · doi:10.1007/s11055-024-01640-8 · Cited by 2
Xian, L., Xu, X., Mai, Y., Guo, T., Chen, Z., & Deng, X. (2024) · Medicine · doi:10.1097/md.0000000000039740 · Cited by 2
Xi, C., Zhang, J., Liu, H., Jia, X., Ding, Y., Wei, W., Wang, L., & Liu, Z. (2024) · Journal of Alzheimer s Disease · doi:10.3233/jad-231457 · Cited by 2
Li, J., Dong, D., Sun, Y., Wang, Q., Yu, L. J., Tao, X., Wang, K., & Zhao, L. (2025) · Phytomedicine · doi:10.1016/j.phymed.2025.156448 · Cited by 2
Lu, Y., Zhu, H., Xie, L., Yang, J., Wei, H.-T., Yu, Q., Li, H., Yang, M., & Li, Z. (2025) · Translational Psychiatry · doi:10.1038/s41398-025-03771-z · Cited by 2
Xia, Y.-M., Zhang, M.-X., Ma, X., Tan, L., Li, T., Wu, J., Li, M., Zhao, W., Qiao, C.-M., Jia, X.-B., et al. (2025) · Brain Sciences · doi:10.3390/brainsci15050433 · Cited by 1
Introduction to Gut Microbiota and Its Role in Health and Diseases
Sharma, S., Hussain, M. S., Khan, Y., & Maqbool, M. (2025) · Cancer drug discovery and develogment/Cancer drug discovery and development · doi:10.1007/978-3-031-86065-2_2 · Cited by 1
Integrated analysis of metabolome and microbiome in a mouse model of sodium valproate-induced autism
Zhao, S., Zhang, X., Miao, Y., Gao, X., Wan, Q., Qiu, W., Si, H., Han, Y., Du, X., Feng, Y., et al. (2025) · Experimental Biology and Medicine · doi:10.3389/ebm.2025.10452 · Cited by 1
Self-citationLi, Y., Dong, J., Wang, S., Xiong, R., & Kang, X. (2025) · Food & Function · doi:10.1039/d5fo02560e · Cited by 1
Ma, C., Wang, Y., Huang, Q., Dai, G., Xu, M., Ju, W., Zhang, Y., Chen, D., & Sun, Y. (2025) · Journal of Pharmaceutical and Biomedical Analysis · doi:10.1016/j.jpba.2025.117225 · Cited by 1
Fan, Y., Zhao, B., Jia, M., Qi, Z., Gao, Y., Wen, B., Dong, Y., Wang, W., Feng, J., Ma, X., et al. (2025) · BMC Psychiatry · doi:10.1186/s12888-025-07619-0 · Cited by 2
Metadata
- Authors
- Xiao, W., Su, J., Gao, X., Yang, H., Weng, R., Ni, W., & Gu, Y.
- Affiliations
- Shanghai Medical College of Fudan University (CN)
- Fudan University (CN)
- Corresponding author
- Ni, Wei
- Gu, Yuxiang
- Venue
- Microbiome
- Published
- 2022-04-17
- Volume
- 10
- Issue
- 1
- Pages
- 62-62
- ISSN
- 2049-2618 (ISSN-L)
- PMC
- PMC9013454
- OpenAlex
- W4224080430
- Cited by
- 252
- References
- 86
- Citations by year
- 2026: 47 · 2025: 91 · 2024: 73 · 2023: 37 · 2022: 4
- FWCI
- 16.72
- Type
- journal article
- Language
- en
- Update notices
- Open access
- gold
- doi.org
- Locations
- Microbiome (publishedVersion, cc-by)
- PubMed Central (publishedVersion, cc-by)
- PubMed (publishedVersion)
- DOAJ (DOAJ: Directory of Open Access Journals) (submittedVersion, cc-by-sa)
- Funders
- Innovative Research Group Project of the National Natural Science Foundation of China (82171313, 81870917, 81771237, 82101397)
- Ministry of Human Resources and Social Security (2016YFC1301704)
- Science and Technology Commission of Shanghai Municipality (2018SHZDZX01)
- Topics
- Life Sciences › Biochemistry, Genetics and Molecular Biology › Molecular Biology › Gut microbiota and health
- Life Sciences › Neuroscience › Neurology › Neurological Disease Mechanisms and Treatments
- Health Sciences › Medicine › Gastroenterology › Gastrointestinal motility and disorders
- Keywords
- microbiota-gut-brain axis, chronic cerebral hypoperfusion, short-chain fatty acids, gut dysbiosis, fecal microbiota transplantation, bilateral common carotid artery occlusion, cognitive impairment, depression-like behavior, neuroinflammation, hippocampal neuronal apoptosis, intestinal motility, intestinal barrier, neuroprotection
- MeSH terms
- Gastrointestinal Microbiome, Fecal Microbiota Transplantation, Brain-Gut Axis, Animals, Fatty Acids, Volatile, Mice, Inbred C57BL, Mice, Rats
About these checks
Registry, retraction, Cites and statistics results are computed, not judged, with one exception: a printed reference that no index lists is read once by a model before it counts as a citation error. Claims are extracted by a model and kept only when their quote appears verbatim in the text; each cited source is then checked, with a model’s help, for whether it says what the claim relies on. Those verdicts can be wrong — read the claim’s quote and the cited source before relying on one.
Statistics and arithmetic are recomputed, not judged.
Confidence bands are shown only for fields calibrated on our annotated test set. None is calibrated yet, so no band is shown.
What counts as a claim ›How we measure confidence ›How we check this ›
Are you an author, or do you see a problem with this page? Request a review
