

The DOI matches its Crossref record; 37 of the 38 references it cites were found in a registry or an index.
Performance evaluation of the Biograph mCT Flow PET/CT system according to the NEMA NU2-2012 standard
Open accessAbstract
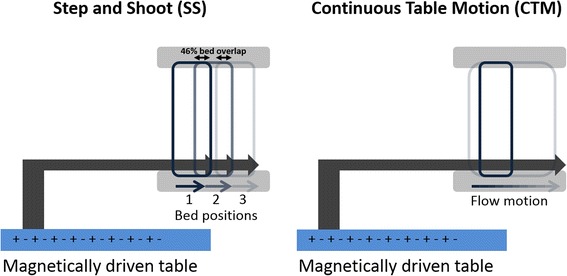
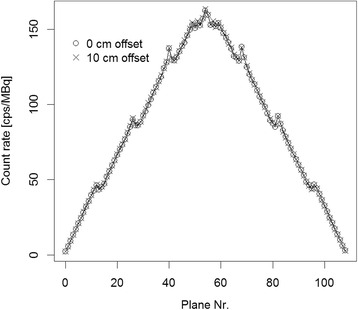
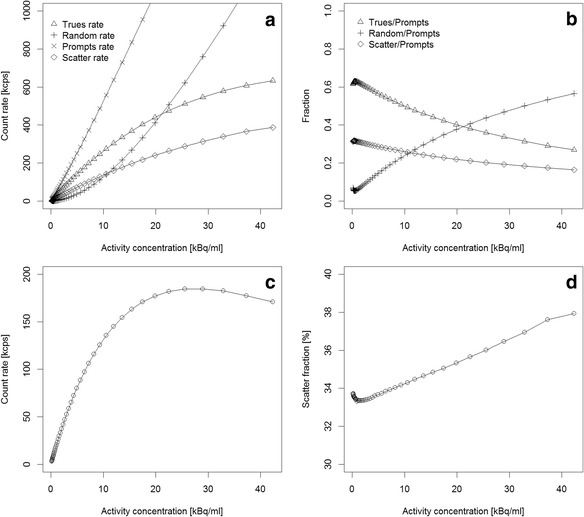
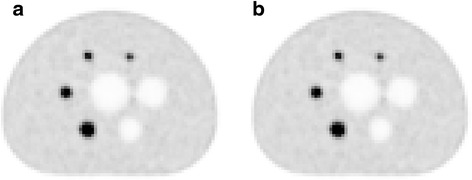
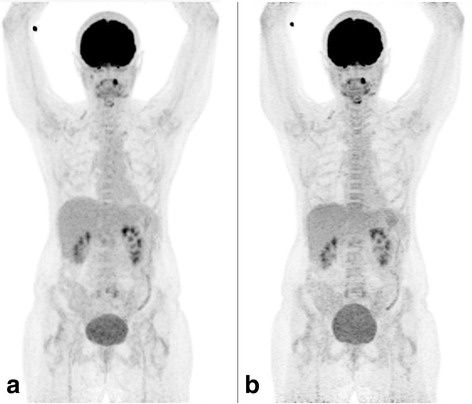
BACKGROUND: The purpose of the study is to evaluate the physical performance of a Biograph mCT Flow 64-4R PET/CT system (Siemens Healthcare, Germany) and to compare clinical image quality in step-and-shoot (SS) and continuous table motion (CTM) acquisitions. METHODS: The spatial resolution, sensitivity, count rate curves, and Image Quality (IQ) parameters following the National Electrical Manufactures Association (NEMA) NU2-2012 standard were evaluated. For resolution measurements, an (18)F point source inside a glass capillary tube was used. Sensitivity measurements were based on a 70-cm-long polyethylene tube, filled with 4.5 MBq of FDG. Scatter fraction and count rates were measured using a 70-cm-long polyethylene cylinder with a diameter of 20 cm and a line source (1.04 GBq of FDG) inserted axially into the cylinder 4.5 cm off-centered. A NEMA IQ phantom containing six spheres (10- to 37-mm diameter) was used for the evaluation of the image quality. First, a single-bed scan was acquired (NEMA standard), followed by a two-bed scan (4 min each) of the IQ phantom with the image plane containing the spheres centered in the overlap region of the two bed positions. In addition, a scan of the same region in CTM mode was performed with a table speed of 0.6 mm/s. Furthermore, two patient scans were performed in CTM and SS mode. Image contrasts and patient images were compared between SS and CTM acquisitions. RESULTS: Full Width Half Maximum (FWHM) of the spatial resolution ranged from 4.3 to 7.8 mm (radial distance 1 to 20 cm). The measured sensitivity was 9.6 kcps/MBq, both at the center of the FOV and 10 cm off-center. The measured noise equivalent count rate (NECR) peak was 185 kcps at 29.0 kBq/ml. The scatter fraction was 33.5 %. Image contrast recovery values (sphere-to-background of 8:1) were between 42 % (10-mm sphere) to 79 % (37-mm sphere). The background variability was between 2.1 and 5.3 % (SS) and between 2.4 and 6.9 % (CTM). No significant difference in image quality was observed between SS and CTM mode. CONCLUSIONS: The spatial resolution, sensitivity, scatter fraction, and count rates were in concordance with the published values for the predecessor system, the Biograph mCT. Contrast recovery values as well as image quality obtained in SS and CTM acquisition modes were similar.
Overview
The claims and statistics of this paper haven’t been checked yet.
Run the check — free, no account needed. It reads the open-access text and checks the sources it cites.
Integrity signals
Registry
Cites
Statistics
Figures
Verification
Claims the paper makes
The claims and statistics of this paper haven’t been checked yet.
Run the check — free, no account needed. It reads the open-access text and checks the sources it cites.
Claims other papers make about this one
Each is checked against this paper’s own text: does it say what the citing paper says it does?
The source backs part of the claim, not all of it — or backs it for a different population, condition or comparison.
In the citing paper
“In contrast, a SiPM system with 100% detector coverage and 214 ps timing resolution [47] can offer increased system sensitivity over a comparable PMT system with lutetium oxyorthosilicate (LSO) crystals [48] that exceeds the expected difference based on the slightly larger axial FOV (16.4 vs. 9.6 cps/kBq with a 25.6 vs. 22.1 cm FOV) [47].”
From Influences on PET Quantification and Interpretation (2022) · cites this paper as [48]
Experimental — accuracy not yet measured
Self-check
Percentages, sums and reported differences re-computed from the paper’s own numbers.
The self-check needs the paper’s full text.
Citations
Cites
A combined PET/CT scanner for clinical oncology.
Beyer, T., Townsend, D. W., Brun, T., Kinahan, P. E., Charron, M., Roddy, R., Jerin, J., Young, J., Byars, L. G., & Nutt, R. (2000) · PubMed · Cited by 1,655
Self-citationNational electrical manufacturers association
Sokole, E. B., & Cradduck, T. D. (1926) · Journal of the A.I.E.E. · doi:10.1109/jaiee.1926.6537344 · Cited by 860
Surti, S., Kuhn, A., Werner, M. E., Perkins, A. E., Kolthammer, J. A., & Karp, J. S. (2007) · PubMed · Cited by 639
Benefit of Time-of-Flight in PET: Experimental and Clinical Results
Karp, J. S., Surti, S., Daube-Witherspoon, M. E., & Muehllehner, G. (2008) · Journal of Nuclear Medicine · doi:10.2967/jnumed.107.044834 · Cited by 585
Fully 3-D PET reconstruction with system matrix derived from point source measurements
Panin, V. Y., Kehren, F., Michel, C., & Casey, M. (2006) · IEEE Transactions on Medical Imaging · doi:10.1109/tmi.2006.876171 · Cited by 536
Physical and clinical performance of the mCT time-of-flight PET/CT scanner
Jakoby, B., Bercier, Y., Conti, M., Casey, M. E., Bendriem, B., & Townsend, D. W. (2011) · Physics in Medicine and Biology · doi:10.1088/0031-9155/56/8/004 · Cited by 487
Resolution modeling in PET imaging: Theory, practice, benefits, and pitfalls
Rahmim, A., Qi, J., & Sossi, V. (2013) · Medical Physics · doi:10.1118/1.4800806 · Cited by 371
Time of flight in PET revisited
Moses, W. W. (2003) · IEEE Transactions on Nuclear Science · doi:10.1109/tns.2003.817319 · Cited by 338
An Assessment of the Impact of Incorporating Time-of-Flight Information into Clinical PET/CT Imaging
Lois, C., Jakoby, B., Long, M. J., Hübner, K. F., Barker, D. W., Casey, M., Conti, M., Panin, V., Kadrmas, D. J., & Townsend, D. W. (2010) · Journal of Nuclear Medicine · doi:10.2967/jnumed.109.068098 · Cited by 263
Karakatsanis, N. A., Lodge, M. A., Tahari, A. K., Zhou, Y., Wahl, R. L., & Rahmim, A. (2013) · Physics in Medicine and Biology · doi:10.1088/0031-9155/58/20/7391 · Cited by 247
Research works printed but not linked: 1
- Melcher CL. Scintillator crystals for PET. J Nucl Med. 2000;41:1051–5.
Cited by
Sorted by citations
Items 101–134 of 134
Human subject study of a transmission-aided attenuation correction for precision PET neuroimaging
Lotfimarangloo, S., Rahman, S. T., Park, M., Fei, B., Badawi, R. D., & Bowen, S. (2025) · EJNMMI Physics · doi:10.1186/s40658-025-00803-x · Cited by 1
Harmonisation of standard uptake values in long-axial field-of-view PET/CT: an exploratory study
Li, Y., Zhang, Z.-Y., Bai, H., Lu, X., & Pang, H. (2026) · EJNMMI Physics · doi:10.1186/s40658-025-00819-3 · Cited by 1
Laymon, C. M., Minhas, D. S., Royse, S. K., Aizenstein, H. J., Cohen, A. D., Tudorascu, D., & Klunk, W. E. (2021) · EJNMMI Physics · doi:10.1186/s40658-021-00403-5 · Cited by 1
Xin, Z., Kao, C.-M., Liu, Y., Chen, X., Zhang, L., Wu, P., & Xie, Q. (2023) · Biomedical Physics & Engineering Express · doi:10.1088/2057-1976/acef24 · Cited by 1
Prior Simulation Test of a Total Body PET Scanner with Multiple Configurations
Cañizares, G., Jiménez-Serrano, S., Morera, C., Barrio, J., Freire, M., Sánchez, D., Lucero, A., Benlloch, J., & González, A. J. (2022) · IEEE Nuclear Science Symposium and Medical Imaging Conference (NSS/MIC) · doi:10.1109/nss/mic44845.2022.10399234 · Cited by 1
Yavuz, G., Kovan, B., Toklu, T., Çermik, T. F., & Öztürk, C. (2025) · BioMedical Engineering OnLine · doi:10.1186/s12938-025-01330-7 · Cited by 1
Physikalisch-technische Grundlagen und Tracerentwicklung in der Positronenemissionstomografie
Glatting, G., Wängler, C., & Wängler, B. (2016) · Springer eBooks · doi:10.1007/978-3-662-50468-0_2 · Cited by 1
Theodorakis, L., Loudos, G. K., Prassopoulos, V., Kappas, C., Tsougos, I., & Georgoulias, P. (2019) · IEEE Transactions on Medical Imaging · doi:10.1109/tmi.2019.2891578
Method for Motion Correction in All-Digital PET Imaging of Moving Object
Li, X., Liu, Y., Dong, C., Huang, J., Xie, Q., & Xiao, P. (2020) · IEEE Nuclear Science Symposium and Medical Imaging Conference (NSS/MIC) · doi:10.1109/nss/mic42677.2020.9507991
Digitale Positronenemissionstomografie – Entwicklung, Detektortechnologie und Perspektiven
Kazek, S. L., Jentzen, W., Seifert, R., Herrmann, K., & Kersting, D. (2022) · Angewandte Nuklearmedizin · doi:10.1055/a-1715-5184
Green, A., Temsah, P., Goldfarb, L., Sanfolippo, K., Knoche, E. M., Muzaffar, R., & Osman, M. (2024) · Nuclear Medicine Communications · doi:10.1097/mnm.0000000000001836
Rausch, I., & Beyer, T. (2024) · Springer eBooks · doi:10.1007/978-3-662-67192-4_3
Self-citationЕфимович, Р. Г., Евгеньевна, П. О., & Андреевич, С. В. (2024) · doi:10.58351/240924.2024.36.90.002
Mohymen, A. A., Farag, H. I., Reda, S., Monem, A. S., & Ali, S. A. (2025) · Journal of Medical Physics · doi:10.4103/jmp.jmp_167_24
Ichikawa, H., Shibutani, T., Kato, T., Banno, T., Terabe, M., & Shimada, H. (2025) · Journal of Nuclear Medicine Technology · doi:10.2967/jnmt.124.269096
A comparison of image quality between digital and analog pet for spatial resolution: A phantom study
Karaca, M. C., Doyuran, M., Çakır, T., Karyağar, S., & Çağlar, M. (2025) · International Journal of Radiation Research · doi:10.61186/ijrr.23.2.19
Ustsinau, U., & Philippe, C. (2025) · Springer eBooks · doi:10.1007/978-3-031-99410-4_14
Kertész, H., Conti, M., Panin, V., Cabello, J., Bharkhada, D., Beyer, T., Papp, L., Jentzen, W., Cal-González, J., Herraiz, J. L., et al. (2022) · Figshare · doi:10.6084/m9.figshare.20521059
Self-citationLaymon, C. M., Minhas, D. S., Royse, S. K., Aizenstein, H. J., Cohen, A. D., Tudorascu, D., & Klunk, W. E. (2021) · Figshare · doi:10.6084/m9.figshare.15026568
Salvadori, J., Odille, F., Karcher, G., Marie, P., & Imbert, L. (2021) · Figshare · doi:10.6084/m9.figshare.13532507
Additional file 1 of A proper protocol for routine 18F-FDG uEXPLORER total-body PET/CT scans
Hu, H., Huang, Y., Sun, H., Zhou, K., Jiang, L., Zhong, J., Chen, L., Wang, L., 韩彦江, & Wu, H. (2024) · Figshare · doi:10.6084/m9.figshare.26616529
Laymon, C. M., Minhas, D. S., Royse, S. K., Aizenstein, H. J., Cohen, A. D., Tudorascu, D., & Klunk, W. E. (2021) · Figshare · doi:10.6084/m9.figshare.15026571
Salvadori, J., Odille, F., Karcher, G., Marie, P., & Imbert, L. (2021) · Figshare · doi:10.6084/m9.figshare.13532513
Rausch, I., Mannheim, J. G., Kupferschläger, J., la Fougère, C. J., & Schmidt, F. P. (2024) · Figshare · doi:10.6084/m9.figshare.26554232
Self-citationLaymon, C. M., Minhas, D. S., Royse, S. K., Aizenstein, H. J., Cohen, A. D., Tudorascu, D., & Klunk, W. E. (2021) · Figshare · doi:10.6084/m9.figshare.15026574
Rausch, I., Mannheim, J. G., Kupferschläger, J., la Fougère, C. J., & Schmidt, F. P. (2024) · Figshare · doi:10.6084/m9.figshare.26554235
Self-citationLinder, P. M., Lan, W., Calderón, E., Rausch, I., la Fougère, C. J., & Schmidt, F. P. (2026) · EJNMMI Physics · doi:10.1186/s40658-026-00867-3
Self-citationVarlow, C., Pees, A., Stehouwer, J. S., Grotegerd, A.-K., Bleher, D., Guarino, D. S., Lindberg, A., Tong, J., Lopresti, B. J., Knight, A. C., et al. (2026) · Journal of Parkinson s Disease · doi:10.1177/1877718x261431108
Performance evaluation of the Biograph Trinion EP2 PET/CT system according to NEMA NU2-2018
Rausch, I., Schmidt, F. P., Hoffmann, M., & Peloschek, P. (2026) · Zeitschrift für Medizinische Physik · doi:10.1016/j.zemedi.2026.07.009
Self-citationRaed, M. D., Muka, P. K., Franzé, D. L., Martins, A. A. F., & Moraes, É. R. (2026) · Applied Radiation and Isotopes · doi:10.1016/j.apradiso.2026.113018
Principe et technique de la tomographie par émission de positons couplée à la tomodensitométrie
Soret, M., & Maisonobe, J.-A. (2026) · EMC - Radiologie et imagerie médicale - Principes et techniques - Radioprotection · doi:10.1016/s1879-8497(25)49588-0
Metadata
- Authors
- Rausch, I., Cal-González, J., Dapra, D., Gallowitsch, H. J., Lind, P., Beyer, T., & Minear, G.
- Affiliations
- Medical University of Vienna (AT)
- Klinikum Klagenfurt (AT)
- Universitätsklinikum St. Pölten (AT)
- Corresponding author
- Rausch, Ivo
- Venue
- EJNMMI Physics
- Published
- 2015-10-26
- Volume
- 2
- Issue
- 1
- Pages
- 26-26
- ISSN
- 2197-7364 (ISSN-L)
- PMC
- PMC4883615
- OpenAlex
- W1866924806
- Cited by
- 133
- References
- 38
- Citations by year
- 2026: 7 · 2025: 11 · 2024: 12 · 2023: 9 · 2022: 15 · 2021: 16 · 2020: 15 · 2019: 20 · 2018: 12 · 2017: 11 · 2016: 5
- FWCI
- 7.56
- Type
- journal article
- Language
- en
- Open access
- gold
- doi.org
- Locations
- EJNMMI Physics (publishedVersion, cc-by)
- Europe PMC (PubMed Central) (publishedVersion, cc-by)
- PubMed Central (publishedVersion, cc-by)
- PubMed (publishedVersion)
- Topics
- Health Sciences › Medicine › Radiology, Nuclear Medicine and Imaging › Medical Imaging Techniques and Applications
- Health Sciences › Medicine › Radiology, Nuclear Medicine and Imaging › Radiation Dose and Imaging
- Health Sciences › Medicine › Radiology, Nuclear Medicine and Imaging › Cardiac Imaging and Diagnostics
- Keywords
- spatial resolution, detector sensitivity, noise equivalent count rate, scatter fraction, image quality, step-and-shoot acquisition, point source resolution, NEMA IQ phantom
About these checks
Registry, retraction, Cites and statistics results are computed, not judged, with one exception: a printed reference that no index lists is read once by a model before it counts as a citation error. Claims are extracted by a model and kept only when their quote appears verbatim in the text; each cited source is then checked, with a model’s help, for whether it says what the claim relies on. Those verdicts can be wrong — read the claim’s quote and the cited source before relying on one.
Statistics and arithmetic are recomputed, not judged.
Confidence bands are shown only for fields calibrated on our annotated test set. None is calibrated yet, so no band is shown.
What counts as a claim ›How we measure confidence ›How we check this ›
Are you an author, or do you see a problem with this page? Request a review
